Munich Personal RePEc Archive
Behavioral Spillovers in Coordination
Games
Cason, Timothy and Savikhin, Anya and Sheremeta, Roman
2011
Online at
https://mpra.ub.uni-muenchen.de/52106/
Behavioral Spillovers in Coordination Games
*
Timothy N. Cason
a, Anya C. Savikhin
b, and Roman M. Sheremeta
caDepartment of Economics, Krannert School of Management, Purdue University,
403 W. State St., West Lafayette, IN 47906-2056, U.S.A.
bBecker Friedman Institute for Economic Research, The University of Chicago,
5807 South Woodlawn Avenue, Chicago, IL 60637, U.S.A.
cArgyros School of Business and Economics, Chapman University,
One University Drive, Orange, CA 92866, U.S.A.
September 1, 2011
Abstract
Motivated by problems of coordination failure observed in weak-link games, we experimentally investigate behavioral spillovers for minimum- and median-effort coordination games. Subjects play these coordination games simultaneously and sequentially. The results show that successful coordination on the Pareto optimal equilibrium in the median game influences behavior in the minimum game when the games are played sequentially. Moreover, this positive, Pareto-improving spillover is present even when group composition changes across games, although the effect is not as strong. We also find that the precedent for uncooperative behavior in the minimum game does not influence play in the median game. These findings suggest guidelines for increasing cooperative behavior within organizations.
JEL Classifications: C72, C91
Keywords: coordination, order-statistic games, experiments, cooperation, minimum game, median game, behavioral spillover
Corresponding author: Timothy Cason, [email protected]
1. Introduction
Coordination failure is often the reason for the inefficient performance of many groups,
ranging from small firms to entire economies (e.g., Brandts and Cooper, 2006). When agents’
actions have strategic interdependence, even when they succeed in coordinating they may be
“trapped” in an equilibrium that is objectively inferior to other equilibria (Van Huyck et al., 1990).
Coordination failure and inefficient coordination has been an important theme across a variety of
fields in economics, ranging from development and macroeconomics to mechanism design for
overcoming moral hazard in teams (e.g., Heller, 1986; Cooper and Ross., 1985; Bryant, 1983).
This paper reports an experiment in which human subjects play the minimum- and median-effort
coordination games simultaneously and sequentially. We also compare behavior when group
composition changes across sequential play of the two games. The results show that successful
coordination on the Pareto optimal equilibrium in the median game influences behavior in the
minimum game when the games are played sequentially. Moreover, this positive,
Pareto-improving spillover is present even when group composition changes across games, although the
effect is not as strong.
Most research in game theory considers specific games in isolation. In practice, however,
individuals interact strategically in many different settings. Sometimes they interact with same
individuals across settings and sometimes with other individuals. Moreover, the order of play in
the field is often a choice variable. Laboratory experiments have documented that prior experience
of cooperation in one game can “spill over,” resulting in cooperation in a related game where
cooperation is usually not observed (Van Huyck et al., 1991; Schotter, 1998; Knez and Camerer,
2000; Ahn et al., 2001). We define a “behavioral spillover” as having occurred whenever observed
to the same game played in isolation. Behavioral spillover can be positive, such as when it induces
Pareto-improving behavior in a game through an increase in cooperation or coordination, or it can
be negative when it reduces efficiency, coordination or cooperation.
Understanding how playing different games in combination affects behavior can have
significant practical relevance. In organizations, for example, workers may engage in a variety of
different group tasks with their colleagues. Organizational experts contend that the context in
which the group functions is important for explaining performance (Gersick, 1988). However, little
evidence exists to help explain how the act of participating in multiple projects that overlap in
time, space and organization composition can influence worker behavior. A central theme for
organizational design is how to assign tasks of varying complexity and interdependence to groups
in order to maximize performance (Postrel, 2001; Kozlowski and Bell, 2003).
In practice, individuals may work on many group projects, and individual effort impacts
group performance in different ways depending on the interdependencies of group tasks and the
degree of specialization required of group members to achieve high performance. In conjunctive
tasks, the group’s performance depends on the quality of work by the weakest member, such as a
software development project where one bad coding bug can make the entire product unstable
(Steiner, 1966). This is an example of a “weakest link” game, also known as a minimum-effort
game. In additive and compensatory tasks, the group’s overall performance depends on typical or
average member work quality, such as in a geographically-dispersed sales team. Coordination
incentives for this type of situation, if the returns to one’s effort are shared with the group, are
captured by the median-effort game. Experiments indicate that with relatively large groups, the
median game often produces Pareto optimal outcomes, while the minimum game often produces
environments in practice, it is important to determine whether behavior may spill over from one
situation to the other. One of the main contributions of this study is to evaluate the existence of
behavioral spillover in two different environments, and to provide some empirical evidence about
the different behavioral effects that may lead to this spillover.
A deeper understanding of the effect of behavioral spillover in sequential and simultaneous
settings could be important for understanding group performance and improving efficiency.
Organizations have the ability to structure their work environment or training in such a way as to
harness advantageous, Pareto-improving (“positive”) behavioral spillover and avoid
disadvantageous, efficiency reducing (“negative”) spillover, and this can explain “team
development” methods used in different types of organizations. For example, the large
consequences of team failure in aviation flight crews has led to widespread Crew Resource
Management training to change the teamwork attitudes of team members early in the training
process when members are more malleable (Kozlowski and Bell, 2003). Subsequent flight
performance has weakest link characteristics, but many training activities include evaluations to
make tasks more compensatory. These include team self-correction, where crew members monitor
each other and provide corrective feedback, and cross training to develop critical knowledge about
the skills and information needs of teammates.
Our use of a laboratory experiment allows us to control for confounding factors and isolate
the impact of behavioral spillover. We also investigate how changing group composition
influences behavioral spillover. Our findings suggest that the extent of behavioral spillover across
activities may depend on when the activities take place. For example, we observe significant
positive spillover from the median to the minimum game when the two games are played
is different across games played sequentially, and any negative spillover is weak and not
statistically significant. This suggests that it may be useful to assign work teams first to less
demanding group tasks in which performance depends on average or median effort, prior to
assigning them to more unforgiving tasks that depend on the effort of the weakest group member.
2. Related Literature
Coordination games are relevant for many settings, including models of team production
(Bryant, 1983), network externalities (Katz and Shapiro, 1985), product warranties under moral
hazard (Cooper and Ross, 1985), and imperfect competition (Heller, 1986; Kiyotaki, 1988;
Diamond, 1982). A number of studies have investigated mechanisms that can help overcome the
coordination failure or convergence to an inefficient equilibrium that frequently occurs in the
minimum game, such as pre-play communication (Cooper et al., 1992; Blume and Ortmann, 2007;
Brandts and Cooper, 2007; Cason et al., 2010), repetition and fixed-matching protocols (Clark and
Sefton, 2001), the introduction of leaders (Weber et al., 2001), and the introduction of
between-group competition (Myung, 2009; Sheremeta, 2011). Other studies have considered the effect of
longer time horizons (Berninghaus and Ehrhart, 1998) and increased feedback (Berninghaus and
Ehrhart, 2001) or various levels of monitoring (Deck and Nikiforakis, 2011). Our work contributes
to this literature by introducing behavioral spillover as another possible coordination- and
efficiency-enhancing mechanism.
History of play from previous interactions has been shown to have an effect on future play
in other games. For example, Knez and Camerer (2000) find that shared experience of efficient
coordination in a minimum-effort game increases cooperation in a subsequent prisoner’s dilemma
establish precedents of cooperation for profit sharing contracts (Schotter, 1998) and prisoner’s
dilemma games (Ahn et al., 2001). Behavioral spillovers due to previously established cooperative
precedent have also been observed between cooperative giving to a charity and a prisoner’s
dilemma game (Albert et al., 2007), between high and low incentive coordination games (Brandts
and Cooper, 2006), and between minimum games and critical mass games (Devetag, 2005). In all
these cases, behavioral spillovers cause an increase in cooperation in the subsequent game.1 In
addition, extrapolation and learning across games has been observed in players who first play a
guessing game and then a coordination game (Mengel and Sciubba, 2010).
Much of the work on history of play from previous interactions focuses on the same groups
playing related games in sequence. For example, Knez and Camerer (2000), Schotter (1998),
Devetag (2005) and Brandts and Cooper (2006) examine how precedents of cooperation can be
established when the same subjects play two games sequentially. One frequently studied game
used for comparing fixed versus randomly matched groups is the prisoner’s dilemma game. Ahn et
al. (2001) consider how random versus fixed matching of 2-player groups in the prisoner’s
dilemma game affects future play, and find that the effect of past play is stronger for fixed
matching. Recent research suggests that when subjects are in a fixed matching environment, a
cooperative norm emerges in the prisoner’s dilemma game, which does not emerge when subjects
are randomly matched every period (Duffy and Ochs, 2009). When new members are introduced
to small groups who have achieved Pareto optimal coordination, the coordination persists in the
larger group (Weber, 2006). Our work contributes to this literature by studying behavioral
spillovers when subjects are matched with the same subjects for both games, as well as when
1 Other types of sequential spillovers are possible. For example, Cherry et al. (2003) and Cherry and Shogren (2007)
subjects are matched with different subjects for each game. These treatments help to identify
whether spillovers arise from learning at the individual level or from common knowledge of a
precedent of play among a fixed group of subjects.
Simultaneous game-play has been under-studied to date and findings about the effect of
behavioral spillover in simultaneous settings have been mixed. Our laboratory experiment provides
additional evidence of the effect of simultaneous game-play in minimum- and median- effort
coordination games on individual behavior. Previous experimental research has demonstrated that
behavior in simultaneous settings differs from games played in isolation, but for games that differ
from those we study. Bednar et al. (2010) report a laboratory experiment with two-player bimatrix
games that produce behavioral spillovers. When two distinct games are played simultaneously with
different opponents, behavior differs from the isolated controls. The authors conclude that subjects
apply similar heuristics across games and that the type of game played influences individual
behavior in predictable ways. Playing ensembles of games is cognitively difficult and compels
agents to apply similar strategies to distinct games in order to reduce their cognitive burdens
(Bednar and Page, 2007; Samuelson, 2001). However, when two identical minimum-effort
coordination games or two identical public goods games are played simultaneously with different
opponents, behavior does not differ from isolated controls (Falk et al., 2011).
3. Experimental Environment, Design and Procedures
3.1. Minimum- and Median-Effort Games
The objective of this study is to document behavioral spillovers between related games, one
that tends to result in Pareto optimal coordination and one that often results in coordination failure
causes of behavioral spillovers by investigating behavioral spillovers both in settings when games
are played simultaneously and in settings when they are played sequentially. For these reasons, we
consider the minimum- and median-effort games.
In the n-player minimum-effort game, each player 𝑖 chooses an effort 𝑒𝑖 between 0 and 𝑒̅.
The payoff of player 𝑖 depends on 𝑒𝑖 and the minimum effort within the group, Min(𝑒𝑖, 𝑒−𝑖):
𝜋𝑖(𝑒𝑖, 𝑒−𝑖) =aMin(𝑒𝑖, 𝑒−𝑖) − 𝑏[𝑒𝑖 −Min(𝑒𝑖, 𝑒−𝑖)] +c, (1)
where 𝑏[𝑒𝑖−Min(𝑒𝑖, 𝑒−𝑖)] denotes the deviation cost and a, b and c are constants such that a=0.5,
b=0.5 and c=3. The Pareto-optimal equilibrium that provides the highest payoffs to all players
occurs when each player chooses the highest effort 𝑒̅. Nevertheless, this game has been shown to
produce convergence to the low-payoff, low-effort equilibria under certain conditions, such as
large group size and high effort cost (Van Huyck et al., 1990; Knez and Camerer, 1994).
In the n-player median-effort game, each player 𝑖 chooses an effort 𝑒𝑖 between 0 and 𝑒̅. The
payoff of player 𝑖 depends on 𝑒𝑖 and the median effort within the group, Med(𝑒𝑖, 𝑒−𝑖):
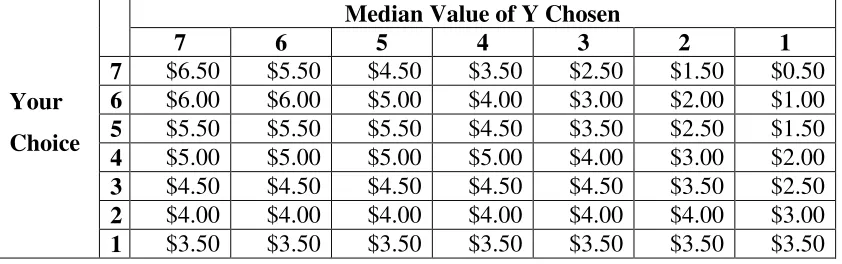
𝜋𝑖(𝑒𝑖, 𝑒−𝑖) =aMed(𝑒𝑖, 𝑒−𝑖) − 𝑏|𝑒𝑖 −Med(𝑒𝑖, 𝑒−𝑖)| +c. (2)
The only difference from (1) is that instead of using the minimum order statistic Min(𝑒𝑖, 𝑒−𝑖), the
median game uses the median order statistic Med(𝑒𝑖, 𝑒−𝑖). This game often results in Pareto
efficient outcomes (Van Huyck et al., 1991; Blume and Ortmann, 2007).2
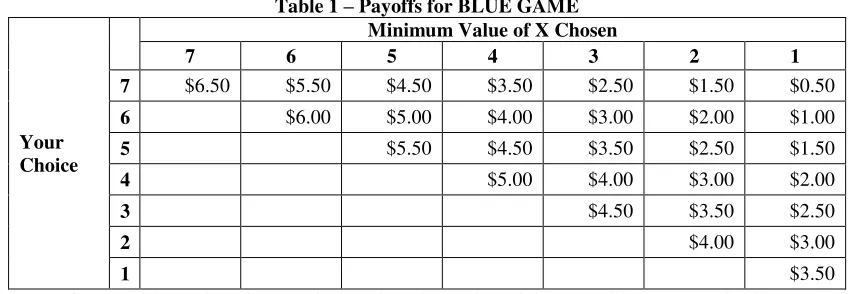
Tables 1 and 2 show the minimum and median games used in the experiment. Subjects
could choose any integer between 1 and 7 as their effort choice, 𝑒𝑖. Clearly, both games have the
same set of equilibria along the diagonal with any common effort level.
2 Note that we use the same linear cost functions for penalizing deviations from the relevant order statistic in both the
3.2. Experimental Design & Procedures
The experiment was conducted at the Vernon Smith Experimental Economics Laboratory
(VSEEL). Volunteers were recruited by email from a subject pool of undergraduate students from
Purdue University. A total of 225 subjects participated in 9 sessions, with 25 subjects participating
in each session. All subjects participated in only one session of this study. Some had participated
in other economics experiments that were unrelated to this research.
The computerized experimental sessions used z-Tree (Fischbacher, 2007) to record subject
decisions. Each session proceeded either in two or in three parts, depending on treatment. Subjects
were given the instructions, shown in Appendix I, at the beginning of each part and the
experimenter read the instructions aloud. In the first part, subjects’ risk attitudes were elicited
using a multiple price list of 15 simple lotteries, similar to Holt and Laury (2002).3 At the end of
each experimental session, one out of the 15 lottery decisions was randomly selected for payment.
We conducted four treatments as summarized in Table 3: a treatment in which the
minimum game was followed by the median game (SeqMin), two treatments in which the median
game was followed by the minimum game (SeqMed and SeqMedDiff), and a treatment in which
these two games were played simultaneously (Sim). In SeqMin, SeqMed, and SeqMedDiff,
subjects played the first game ten times with a known end period, and after reading additional
instructions, played the second game ten times. In Sim, subjects read instructions about both games
and then played both games simultaneously for ten rounds. In SeqMin, SeqMed, and Sim, 25
subjects were randomly assigned to a group of 𝑛=5 players and stayed in the same groups
3 Subjects were asked to state whether they preferred safe option A or risky option B. Option A yielded $1 payoff with
throughout their entire session, playing both supergames with the same four partners. In
SeqMedDiff, 25 subjects were randomly assigned to a group of 𝑛=5 players for the first
supergame, and then were reassigned to a new group of 𝑛=5 players for the second supergame,
using a perfect strangers matching protocol such that no subjects played the second supergame
with any of their group members from the first supergame. This treatment allows us to distinguish
learning at the individual level from common knowledge of precedent of play at the group level as
contributing factors to behavioral spillovers.
At the beginning of each period, all subjects entered their effort choices without knowing
the other subjects’ effort choices for that period. After all subjects made their decisions, the output
screen displayed the minimum effort (minimum game) or median effort (median game) for the
subject’s own group, as well as the subject’s earnings. Subjects recorded their results in a hardcopy
record sheet, and then moved on to the next period.4 Subjects participating in the simultaneous
treatment completed their decisions for both the minimum and median game before learning the
order statistics and their payoffs for either game.
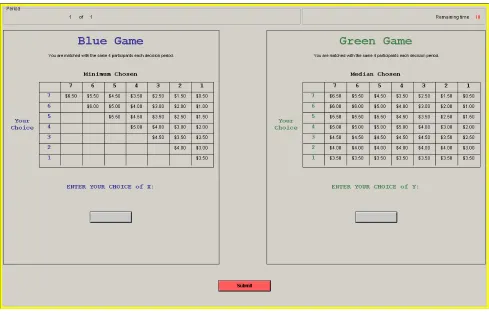
During the simultaneous treatment, the minimum and median games were displayed side
by side on the same screen. Subjects typed their choices into each input box, and clicked “submit”
at the bottom of the screen. The results of each game were also displayed side by side on the same
screen – the median choice and outcome were displayed for the median game, and the minimum
choice and outcome were displayed for the minimum game. We used categorical (and not ordinal)
nomenclature to label each game, employing the colors blue and green as labels (instead of, for
4 Recording results in a hardcopy record sheet is a standard procedure used at the VSEEL laboratory to provide
example, 1 and 2 or A and B).5 To control for presentation effects, we ran an extra session of the
Sim treatment, switching the left-right location of the games on the subjects’ screens. In two of the
three Sim sessions, the minimum game was displayed on the left, and in the additional Sim
session, the minimum game was displayed on the right.
In the Sim sessions, subjects had to click on the input box for that game to enter their
decision. A function was executed in z-Tree that kept track of which input box the subject clicked
on first. When the minimum game was displayed on the left, subjects made a decision in the
minimum game first 94% of the time. When the median game was displayed on the left, subjects
made a decision in the median game first 98% of the time. This consistent left to right
decision-making is not surprising, since over 90% of subjects self-reported in our post-experiment
questionnaire that they read and write from left to right horizontally in their native language.
However, we do not find any difference between behavior in the sessions where the minimum
game is displayed on the left as compared to the session where the median game is displayed on
the left; therefore, we pool the three sessions for the analysis.
At the end of the experiment, one period from each game (minimum and median) was
selected for payment using a random draw from a bingo cage. Subjects earned about $13 on
average, and sessions (including instruction time) lasted approximately 35-45 minutes. Subjects
also completed a demographic questionnaire at the end of each session.
4. Hypothesis Development
Our goal is to document behavior when these two different games are played
simultaneously and in sequence, relative to each game played separately. Formal theoretical
5 Blue and green were specifically chosen to avoid any color-dependent emotional response (Adams and Osgood,
models do not provide precise predictions for potential behavioral spillovers, so we proceed by
providing some conjectures based on the findings of previous work.
Although currently game theory does not pinpoint potential sources of behavioral
differences that have been documented in related work, in recent years some progress has been
made in understanding spillovers (Samuelson, 2001; Page, 2006; Bednar and Page, 2007; Steiner
and Stewart, 2008). This empirical study is intended to contribute additional evidence to inform
the discussion of what behavioral effects may impact individual decisions in two games played
simultaneously and sequentially. Our experimental design includes treatments in which individuals
play the two games with different groups, so only individual learning can lead to spillovers, as well
as when individuals play the games with the same groups, which can measure the marginal impact
of adding common knowledge of a precedent of play on spillovers.
Spillover emerges whenever observed behavior – either individually or collectively in a
group – differs when a game is played in isolation compared to when it is played together with
other games. Behavior can spill over from one game to another when the two games are played
simultaneously (Bednar et al., 2010; Savikhin and Sheremeta, 2010), as well as sequentially
(Schotter, 1998; Knez and Camerer, 2000; Ahn et al., 2001; Devetag, 2005; Brandts and Cooper,
2006; Albert et al., 2007). Behavioral spillovers have also been referred to as “feedback spillovers”
when they occur due to incomplete information or strategic uncertainty about each game (Huck et
al., 2011). Different types of learning can be sources of behavioral spillovers.6 For example,
6 The effect described is a spillover of behavior rather than a focal point. While focal points can be excellent
individuals can learn about the strategies of the game, or they can learn about the social
preferences of their teammates.7
The minimum and median game are descriptively similar since they have common strategy
spaces and player numbers (Knez and Camerer, 2000), but they have different payoff structures.
This could lead to significant differences in strategic uncertainty across games, which could also
have implications for spillover. Standard game theoretic models assume that agents are rational
and can fully optimize in any problem. However, when a problem is complex and requires high
cognitive load to process, agents may use heuristics to make individual decisions (Wright, 1980;
Gigerenzer et al., 1996; Simon, 1982). Cognitive loadis a construct in psychology representing the
burden that performing a task imposes on the learner’s cognitive system (Paas and van
Merrienboer, 1994).8 A relevant measure for assessing cognitive load is the structure of the game,
since tasks that are more complex by design or involve the need to process greater amounts of
information require greater cognitive load than simpler tasks. In addition, games with higher
strategic uncertainty are more demanding on subjects’ belief formation and therefore may produce
greater cognitive load relative to games with lower strategic uncertainty.
Following Bednar et al. (2010), we conjecture that games with lower strategic uncertainty
have a stronger behavioral spillover effect onto other games with greater uncertainty because
learning a strategy or learning about others’ strategies in a game with lower strategic uncertainty
requires less effort or cognitive load. The concept of entropy can be applied to measure the degree
of strategic uncertainty in the median and minimum game. The entropy of a random variable 𝑋
7 Extrapolation occurs when players, faced with new strategic situations, form beliefs by extrapolation from similar
past situations and act on these beliefs (Steiner and Stewart, 2008). Analogical transfer describes the transfer of knowledge from one situation to another through finding correspondences and similarities across situations (Gick and Holyoak, 1983).
with a probability density function, 𝑝(𝑥) = Pr{𝑋 = 𝑥}, is defined by 9
𝐻(𝑋) = − ∑ 𝑝(𝑥) log𝑥 2𝑝(𝑥). (3)
Higher entropy indicates greater strategic uncertainty. Variants of this approach can be used to
characterize many different classes of games, and the strategic uncertainty of a particular game can
be measured after results have been collected.
Conjecture 1: Behavioral spillovers influence behavior more in a higher strategic
uncertainty game than a lower strategic uncertainty game due to a greater cognitive load.
Van Huyck et al. (1991) use path-dependence to explain how decisions in future periods
are influenced by subjects’ shared experience within the same coordination game.
Path-dependence is the extent to which the outcomes of previous periods matter for the current period
(Page, 2006). Many games are path-dependent, of course, in the sense that current choices depend
to some extent on previous choices. But some games may be more path-dependent than others. In
addition, games are often path-dependent because of their incentive structure, so path-dependence
can generally be thought of as a structural, not behavioral, characteristic. It is well documented that
the median game exhibits stronger path-dependence than the minimum game (Van Huyck et al.,
1991).10 One plausible reason for this is that the median order statistic is more robust than the
minimum, as it only takes one player to change the minimum order statistic whenever it exceeds
one, while it may take several players to change the medium order statistic. In addition to
evaluating the structure of the game, evidence of path-dependent behavior can be obtained through
comparing individual behavior in early periods with behavior in later periods. Games with higher
9 Conventionally it is assumed that 0 log 0 = 0, since x log x→ 0 as x→ 0.
10 All reported sessions in Van Huyck et al. (1991), which were based on another variant of the median game, had final
path-dependence should be less susceptible to influence from other games, because behavior in
these games is less volatile and actions depend more on actions of others in previous rounds of the
same game. In addition, games with higher path-dependence may allow for greater learning, which
should make behavior in these games more likely to spill over onto other games.
Conjecture 2: Games that are less path-dependent are more likely to be susceptible to
behavioral spillover than games that are more path-dependent.
When an individual plays two distinct games with different group members, the behavioral
spillovers can be attributed to individual behavior and cognitive processes. For example, subjects
may have experienced successful coordination on the Pareto optimal equilibrium in the previous
game and may seek to reproduce this success in the new game, or they may have acquired a
general understanding of the structure of the game and understand the benefits of everyone
choosing the maximum effort. However, when an individual plays these two games with the same
group members, the behavioral spillovers observed may also be due to social processes, including
common knowledge among group members of a precedent of play. This precedent provides a
coordination device, and hence an equilibrium selection rule that is unavailable when group
composition changes across games. This suggests that behavioral spillover will be stronger in
games played with the same, rather than different, group members.
Conjecture 3: The behavioral spillover in games played with same subjects is stronger
than the behavioral spillover in games played with different subjects.
5. Experiment Results
Table 4 reports the frequency of Pareto optimal coordination of each supergame in period
treatment, where the minimum game was played first, only 1 of 10 groups learned to coordinate on
the efficient equilibrium in the minimum game. This finding is consistent with previous research
(Knez and Camerer, 1994, 2000; Bornstein et al., 2002; Weber et al., 2004; Dufwenberg and
Gneezy, 2005). A common reason cited for the lack of coordination in the minimum game is the
presence of strategic uncertainty (Van Huyck et al., 1990; Blume and Ortmann, 2007). Strategic
uncertainty may cause risk averse subjects to choose lower effort. Based on the initial lottery
choice task, we classify 69% of subjects as risk averse, which may contribute to the lack of
coordination in the minimum game.11
In the Sim treatment, where the two games were played simultaneously, 4 of 15 groups
learned to coordinate on the Pareto optimal equilibrium in the minimum game. In the SeqMed
treatment, where the minimum game was played after the median game, 8 of 10 groups learned to
coordinate on the Pareto optimal equilibrium in the minimum game. These differences in the rate
of efficient coordination for the minimum game between the SeqMed and SeqMin treatments and
between the SeqMed and Sim treatments are significant (in both cases Fisher’s exact test p-value <
0.05). However, no significant difference exists in the minimum game efficient coordination rates
between the SeqMin and Sim treatments (Fisher’s exact test, p-value = 0.61).12 Thus, greater
coordination on the efficient equilibrium in the minimum game occurs through behavioral
spillover from the median game when the games are played sequentially. To summarize:
Result 1. Behavioral spillover exists in the minimum game. When the median game is
played before the minimum game, groups coordinate on the Pareto optimal equilibrium
11 However, this classification of individuals into groups of risk-averse and risk-seeking does not appear to be related
to their initial behavior in the minimum game. We conducted a regression with choice of effort in the minimum game in period one as the independent variable and the risk preference classification as the explanatory variable, and found that the risk-averse dummy variable is not significantly different from zero (p-value > 0.10).
12 It is conceivable that efficiency could improve in the minimum game if the supergame was repeated for a second
significantly more often in the minimum game than when the minimum game is played first or
when the two games are played simultaneously.
Spillovers also occur in the minimum game even when subjects are matched with
completely different group members in each supergame. In the SeqMedDiff treatment, where the
minimum game was played with new subjects after the median game, 6 of 10 groups coordinated
on the Pareto optimal equilibrium in the minimum game. This efficient coordination rate is
significantly higher than in the SeqMin treatment based on a probit regression that uses
coordination on the Pareto optimal equilibrium in the last period as the dependent variable and the
treatment condition as the explanatory variable (p-value=0.02).13 This result suggests that a major
part of behavioral spillover is caused by subjects’ previous experience with efficient coordination,
since significant efficiency improvements occur in the minimum game even when this cooperation
experience occurs through interactions with a set of completely different individuals. Coordination
on the Pareto optimal equilibrium in the minimum game in the SeqMedDiff treatment is not as
high as in the SeqMed treatment; however, the difference is not statistically significant (probit
model p-value=0.41). Therefore, we find only weak support for Conjecture 3.
Result 2. Behavioral spillover on subsequent play of the minimum game is present even
when group composition changes across games, although the effect is not as strong.
Figure 1 provides additional support for Results 1 and 2. This figure displays the time
series of choices in the minimum game, with the average of the choices in each group on the left
and the average of the minimum of group choices on the right. Both a t-test and nonparametric
Wilcoxon Mann-Whitney test fail to reject the hypothesis that the average (or minimum) effort
13 Nonparametric tests are not feasible for the second supergame in the SeqMedDiff treatment because different groups
level in the SeqMin treatment is equal to the average (or minimum) effort level in the Sim
treatment (all p-values are above 0.50).14 On the other hand, the data reject the null hypotheses that
the average (or minimum) effort level in the SeqMed and SeqMedDiff treatments is the same as in
the SeqMin treatment (all p-values are below 0.05).15
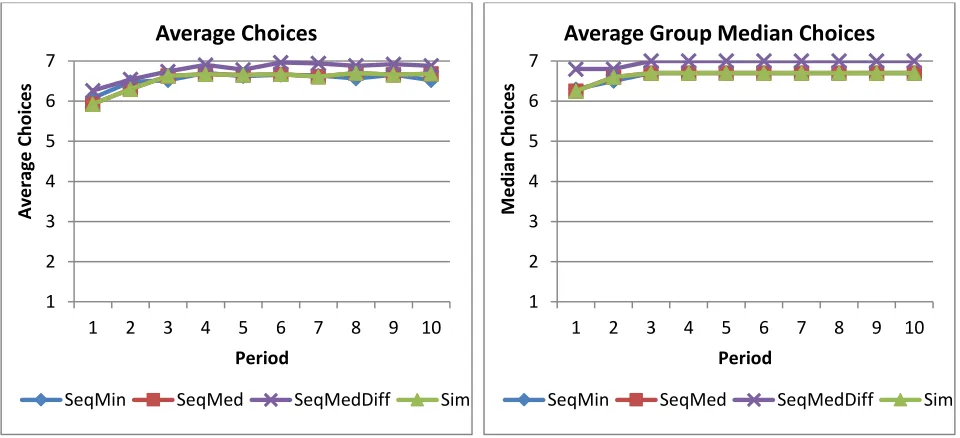
In contrast with the minimum game, almost all groups coordinate on the Pareto optimal
equilibrium in the median game, with choices in the last period at the equilibrium for 7 of 10
groups in SeqMin, 19 of 20 groups in SeqMed and SeqMedDiff and 12 of 15 groups in Sim
treatments. Our finding that coordination on the Pareto optimal equilibrium is more likely in the
median game as compared to the minimum game is in line with related literature. However,
coordination rates in the median game in our experiment are generally greater than the rates of
coordination found previously (Van Huyck et al., 1991; Schotter, 1998; Blume and Ortmann,
2007).16 Rates of coordination on the Pareto optimal equilibrium in median game are not
statistically different across treatments.
Result 3. No significant behavioral spillover occurs in the median game. Groups
coordinate on the Pareto optimal equilibrium equally well in the median game in all treatments.
This result cannot be attributed simply to a bias towards cooperation and coordination
among experimental subjects. Previous research has shown negative spillover from a simple “self
-interest” game that reduces cooperation and coordination on prisoner’s dilemma and intertemporal
14 These tests use the average (or minimum) effort in each group across all the periods for each observation, and
groups in this partner design are statistically independent.
15 The Mann-Whitney test rejects the null hypotheses that the average minimum effort level in SeqMed is the same as
in the SeqMin treatment, or that minimum effort in SeqMed is the same as in the Sim treatment (both p-values < 0.01). Simple regression models (with robust standard errors clustered at the session level) reject the null hypotheses that the average minimum effort level in SeqMedDiff is the same as in the SeqMin treatment (p-value = 0.03), and that minimum effort in SeqMedDiff is the same as in the Sim treatment (p-value = 0.02).
16 For example, Van Huyck et al. (1991), who used a non-linear payoff function and placed subjects into groups of 9,
coordination games (Bednar et al., 2010). It is possible that our results regarding behavioral
spillover are sensitive to the setup of each game, i.e. the payoff function and other factors such as
group size and strategy space. For example, choosing a nonlinear payoff function in the median
game may reduce behavioral spillovers because of a decrease in analogical-based learning (as the
payoff structures for the minimum and medium games would be more different) and a decrease in
convergence to the Pareto optimal equilibrium. The sensitivity of behavioral spillovers to changes
in experimental environment is an interesting question, which we leave for the future research.
To further illustrate how different groups behave in both games, Figure 3 displays the
average choices across all periods for the minimum and median games by groups. The
SeqMedDiff is omitted since in the minimum game the group composition was changed. A
positive and significant relation exists between average group choices in the minimum and median
games for the SeqMed and Sim treatments, with Spearman’s rank correlation coefficients of 0.69
and 0.54. This suggests that more cooperative groups tend to be more cooperative in both games.
In the SeqMin treatment, however, the correlation between minimum and median choices is not
significantly different from zero. This provides further evidence that behavior in the median game
is not influenced by the minimum game. Moreover, these results suggest that the correlation in
cooperativeness in two games played sequentially is mostly due to behavioral spillovers and not
due to inherent inclinations of cooperation for individual subjects.
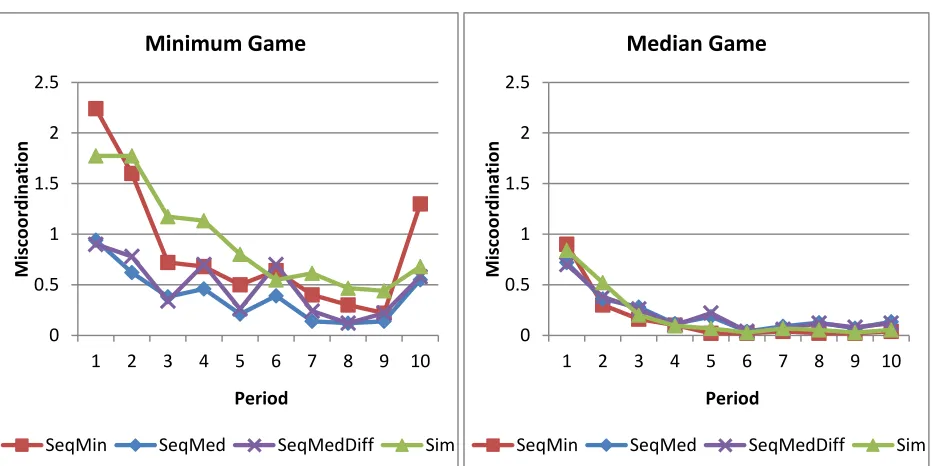
Figure 4 displays the degree of miscoordination (a measure of convergence on any
equilibrium) in the minimum and median games. Miscoordination, calculated as [𝑒𝑖−
Min(𝑒𝑖, 𝑒−𝑖)] for the minimum game and |𝑒𝑖−Med(𝑒𝑖, 𝑒−𝑖)| for the median game, is lower on
average in the median game than in the minimum game. In the minimum game, miscoordination in
0.01 and 0.04). Miscoordination is somewhat lower in the SeqMedDiff treatment than in the
SeqMin and Sim treatments, but this is not statistically significant based on a regression that uses
the average miscoordination over all periods as the dependent variable and the treatment condition
as the explanatory variable (p-values are 0.16 and 0.26).17 In the median game, there are no
statistically significant differences between treatments.
Result 4. Significantly less miscoordination occurs in the minimum game when it is played
after the median game than when it is played first or simultaneously with the median game. This
result is stronger when both games are played with the same group members.
6. Behavioral Explanations and Discussion
The findings of this experiment suggest that behavior in isolated games differs from
behavior in games played in combination, providing evidence of behavioral spillover. In this
section, we provide additional empirical measures of behavior in both games, related to the
concepts introduced in Section 4.
In order to measure the degree of strategic uncertainty in each game, consider each game
when played in isolation and first in the sequence. We model individual stage game strategies as a
discrete random variable, 𝑋. The entropy in both the median and minimum games is in the interval
[0; 3.32] when calculated based on the ten periods that each game is played. The lower bound
indicates certainty, i.e., all players choose the same strategy over all periods of the experiment,
resulting in a stable equilibrium outcome. The upper bound corresponds to a uniform distribution
17 We conducted three two-sample t-tests comparing average (across all periods) miscoordination in the minimum
among all possible outcomes.18 Therefore, higher entropy indicates greater strategic uncertainty.
In the median game (SeqMed and SeqMedDiff), 14 of 20 groups begin at the Pareto
optimal effort level 7, and 19 of 20 groups converge to the Pareto optimal equilibrium by period 4.
The average entropy among all groups is 1.41, indicating only moderate strategic uncertainty. In
the minimum game (SeqMin), average choices begin around effort level 4 and then usually
decline, with 4 of 10 groups coordinating at 1 and some groups coordinating at 4 or 5 by the end of
the ten periods. The average entropy among all groups is 2.82, indicating a considerably higher
level of strategic uncertainty. The difference between entropy in both games is statistically
significant, indicating lower strategic uncertainty in the median game (Wilcoxon Mann-Whitney
test, p-value < 0.05 for both SeqMedDiff and SeqMed comparison with SeqMin). Consistent with
Conjecture 1, we find that greater strategic uncertainty (indentified by higher entropy) results in a
stronger behavioral spillover influencing the minimum game.19
Next, to test Conjecture 2, we measure the extent of path-dependence in each game. Simple
evidence of path-dependence comes from comparison of behavior in period 1 with behavior in
period 10. When the minimum game is played first (SeqMin), for 2 out of 10 groups playing the
minimum game the tenth period minimum choice equals the first period minimum choice. On the
other hand, when the median game is played first (SeqMed and SeqMedDiff), for 16 out of 20
groups playing the median game the tenth period median choice equals the first period median
choice. These differences in path-dependence are significant across games (Fisher’s exact test p
18 Entropy is a better measure of strategic uncertainty than variance because it takes into account each individual’s
variability in choices. Consider a set of observed choices {1, 2, 2, 2, 2} and a set of observed choices in the following period {2, 1, 2, 2, 2}. While the variance in this case is unchanged, the entropy measurement identifies these as different. In a generic normal-form game with 5 players and 7 strategies entropy is in the interval [0; 14]. However, our experiment employed exactly 10 periods for each game, so the random variable X could take only 10 possible outcomes. This constrains the upper bound to only 3.32.
19 The average entropy of the minimum game when it follows the median game (in SeqMed and SeqMedDiff) is 1.00,
value < 0.05), suggesting that as a result of different path-dependence, the median game should be
less susceptible to influence from the minimum game.
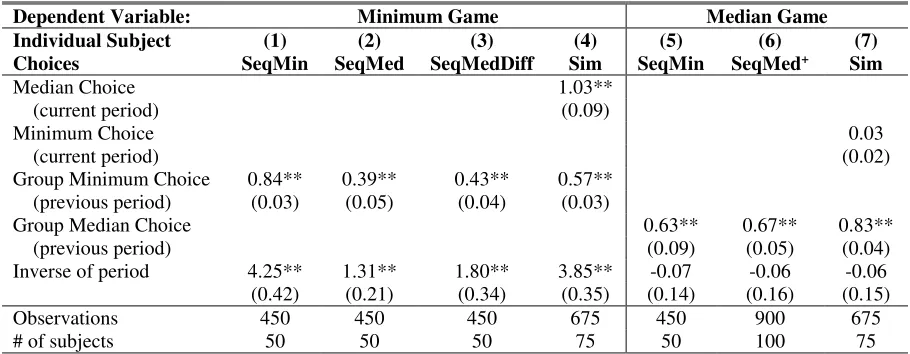
To further test this prediction, Table 5 reports regression results of subjects’ individual
choices, separately for the minimum and median game. A time trend, the median (minimum)
choice, and lagged group minimum (median) choice are the independent variables. The previous
period group choices significantly influence the current choice. In the Sim treatment, we also find
that the median choice in the current period positively affects the minimum choice in the current
period (column 4), while the minimum choice in the current period does not affect the median
choice in the current period (column 7).20 This finding is consistent with Results 1 and 2,
indicating greater behavioral spillover in the minimum game than in the median game.
To summarize, the two major reasons for behavioral spillovers identified in this study are
strategic uncertainty and path-dependence. Consistent with Conjecture 1, behavioral spillovers
influence behavior more in the higher strategic uncertainty (and greater cognitive load) minimum
game than in the median game. We also find that the median game is more path-dependent than
the minimum game, an additional potential source of behavioral spillover. This observation is
consistent with Conjecture 2. Finally, behavioral spillover is present in the minimum game even
when group composition changes, although the effect is not as strong as suggested in Conjecture 3.
The behavioral effects that we have highlighted have clear practical applications. Managers
should be aware of how the properties of organizations and work activities affect the mechanisms
through which spillovers occur. Among other factors, the volatility of expended effort during the
20 We estimated the equations in columns 4 and 7 as a simultaneous equation system since subjects made both game
work assignment and the existence of other assignments can all influence the direction and
magnitude of spillovers.
7. Conclusion
This study investigates behavioral spillovers in the minimum- and median-effort
coordination games, and provides initial evidence for how the timing of play in different types of
coordination games affects behavior. We find that cooperative behavior in the median game
influences behavior in the minimum game when the games are played sequentially. This spillover
occurs (but is weaker) even when group composition changes. Behavior in the minimum game
does not significantly affect play in the median game.
In practical applications, organizations should be aware of the context and timing in which
group tasks are assigned. First, providing work teams with tasks that only require good average
performance for success might improve later performance on more demanding tasks that require
good performance by every team member. Moreover, the results suggest that experience gained in
tasks that an individual performs with one group of co-workers may influence performance on
subsequent disparate tasks performed with a different group of colleagues.
Future work in the area of behavioral spillovers is needed in order to understand how
behavior may be affected by simultaneous and sequential game play. In particular, simultaneous
game-play and related behavioral spillovers is an important area of research that has been
relatively unexplored to date. In addition, the effect of behavioral spillover in other environments,
such as public goods games or contests, could be explored. Moreover, this study points out the
importance of further development of a comprehensive theoretical framework for understanding
spillovers within and across environments. We hope our findings will be useful for future,
descriptively-accurate theories of how agents play combinations of games, building on the work of
References
Adams, F.M., & Osgood, C.E. (1973). A cross-cultural study of the affective meanings of color. Journal of Cross-Cultural Psychology, 4, 135.
Ahn, T.K., Ostrom, E., Schmidt, D., Shupp, R., & Walker, J. (2001). Cooperation in pd games: Fear, greed, and history of play. Public Choice, 106, 137-155.
Albert, M., Güth, W., Kirchler, E., & Maciejovsky, B. (2007). Are we nice (r) to nice (r) people?— an experimental analysis. Experimental Economics, 10, 53-69.
Bednar, J., & Page, S. (2007). Can game (s) theory explain culture? The emergence of cultural behavior within multiple games. Rationality and Society, 19, 65.
Bednar, J., Chen, Y., Liu, T. X., & Page, S. 2010. Behavioral Spillovers and Cognitive Load in Multiple Games: An Experimental Study: Working paper, University of Michigan.
Berninghaus, S.K., & Ehrhart, K.M. (1998). Time horizon and equilibrium selection in tacit coordination games: Experimental results. Journal of Economic Behavior and Organization, 37, 231-248.
Berninghaus, S.K., & Ehrhart, K.M. (2001). Coordination and information: Recent experimental evidence. Economics Letters, 73, 345-351.
Binmore, K., & Samuelson, L. (2006). The evolution of focal points. Games and Economic Behavior, 55, 21–42.
Blume, A., & Ortmann, A. (2007). The effects of costless pre-play communication: Experimental evidence from games with Pareto-ranked equilibria. Journal of Economic Theory, 132, 274-290.
Bornstein, G., Gneezy, U., & Nagel, R. (2002). The effect of intergroup competition on group coordination: An experimental study. Games and Economic Behavior, 41, 1-25.
Brandts, J., & Cooper, D.J. (2006). A change would do you good. An experimental study on how to overcome coordination failure in organizations. American Economic Review, 96, 669-693.
Brandts, J., & Cooper, D.J. (2007). It’s what you say, not what you pay: An experimental study of
manager-employee relationships in overcoming coordination failure. Journal of the European Economic Association, 5, 1223-1268.
Bryant, J. (1983). A simple rational expectations Keynes-type model. Quarterly Journal of Economics, 525-528.
Cason, T.N., Sheremeta, R.M., Zhang, J. (2010). Communication and Efficiency in Competitive Coordination Games, Purdue University, Working Paper.
Cherry, T.L., Crocker, T.D., & Shogren, J.F. (2003). Rationality spillovers. Journal of Environmental Economics and Management, 45, 63-84.
Cherry , T.L., & Shogren, J.F. (2007). Rationality crossovers. Journal of Economic Psychology, 28, 261-277.
Clark, K., & Sefton, M. (2001). Repetition and signalling: Experimental evidence from games with efficient equilibria. Economics Letters, 70, 357–362.
Cooper, D. J., & Kagel, J. H. (2008). Learning and transfer in signaling games. Economic Theory,
34, 415-439.
Cooper, R., & Ross, T.W. (1985). Product warranties and double moral hazard. The RAND Journal of Economics, 103-113.
Deck, C., & Nikiforakis, N. (2011). Perfect and Imperfect Real-Time Monitoring in a Minimum-Effort Game. Experimental Economics, forthcoming.
Devetag, G. (2005). Precedent transfer in coordination games: An experiment. Economics Letters, 89, 227–232.
Diamond, P.A. (1982). Aggregate demand management in search equilibrium. Journal of Political Economy, 881-894.
Duffy, J. & Ochs, J. (2009). Cooperative behavior and the frequency of social interaction. Games and Economic Behavior, 66, 785-812.
Dufwenberg, M., & Gneezy, U. (2005). Gender & coordination. In A. Rapoport, & R. Zwick (Eds.), Experimental business research (Vol. 3, pp. 253–262). Boston: Kluwer Academic. Falk, A., Fischbacher, U., Gächter, S., & Effects, S.I. (2011). Living in two neighborhoods – social
interaction effects in the lab. Economic Inquiry, forthcoming.
Fischbacher, U. (2007). Z-tree: Zurich toolbox for ready-made economic experiments. Experimental Economics, 10, 171-178.
Gersick, C. J. G. (1988). Time and transition in work teams: Toward a new model of group development. Academy of Management Journal, 31, 9-41.
Heller, W. (1986). Coordination failure under complete markets with applications to effective demand. Equilibrium analysis: Essays in honor of Kenneth J. Arrow, 2, 155-175.
Holt, C.A., & Laury, S.K. (2002). Risk aversion and incentive effects. American Economic Review, 1644-1655.
Huck, S., Jehiel, P., & Rutter, T. (2011) Feedback spillover and analogy-based expectations: A multi-game experiment. Games and Economic Behavior, 71(2), 351-365.
Katz, M.L., & Shapiro, C. (1985). Network externalities, competition, and compatibility. American Economic Review, 424-440.
Kiyotaki, N. (1988). Multiple expectational equilibria under monopolistic competition. Quarterly Journal of Economics, 695-713.
Knez, M., & Camerer, C. (1994). Creating expectational assets in the laboratory: Coordination in
‘weakest-link’ games. Strategic Management Journal, 15, 101-119.
Knez, M., & Camerer, C. (2000). Increasing cooperation in prisoner’s dilemmas by establishing a precedent of efficiency in coordination games. Organizational Behavior and Human Decision Processes, 82, 194–216.
Kozlowski, S., & Bell, B. S. (2003). Work groups and teams in organizations. In W. C. Borman, D. R. Ilgen, & R. J. Klimoski (Eds.), Handbook of psychology: Industrial and organizational psychology: Vol. 12. 333–375. London: Wiley.
Mengel, F., & Sciubba, E. (2010), Extrapolation and Structural Learning in Games. Maastricht University, Working Paper.
Myung, N. (2009). Improving coordination and cooperation through competition. Caltech, Working Paper 1305.
Page, S.E. (2006). Path Dependence. Quarterly Journal of Political Science, 1, 87-115,.
Postrel, S. (2001). Multitasking Teams with Variable Complementarity: Challenges for Capability Management. Academy of Management Review, 34, 273-296.
Samuelson, L. (2001). Analogies, adaptation, and anomalies. Journal of Economic Theory, 97, 320-366.
Schotter, A. (1998). Worker trust, system vulnerability, and the performance of work groups. In A. Ben-Ner & L. G. Putterman (Eds.), Economics, values and organization: Cambridge University Press, 364-407.
Sheremeta, R.M. (2011). Perfect-Substitutes, Best-Shot, and Weakest-Link Contests between Groups. Korean Economic Review, 27, 5-32.
Stiener, I. (1966). Models for inferring relationships between group size and potential group productivity. Behavioral Science, 11, 273-283.
Steiner, J., & Stewart, C. (2008). Contagion through learning. Theoretical Economics, 3, 431-458. Valdez, P., & Mehrabian, A. (1994). Effects of color on emotions. Journal of Experimental
Psychology: General, 123, 394-409.
Van Huyck, J.B., Battalio, R.C., & Beil, R.O. (1990). Tacit coordination games, strategic uncertainty, and coordination failure. American Economic Review, 80, 234-248.
Van Huyck, J.B., Battalio, R.C., & Beil, R.O. (1991). Strategic uncertainty, equilibrium selection, and coordination failure in average opinion games. Quarterly Journal of Economics, 106, 885-910.
Weber, R.A., Camerer, C.F., & Knez, M. (2001). The illusion of leadership: Misattribution of cause in coordination games. Organization Science, 12, 582-598
Weber, R.A. (2006). Managing growth to achieve efficient coordination in large groups. The American Economic Review, 96, 114-126.
Weber, R.A., Camerer, C.F., & Knez, M. (2004). Timing and virtual observability in ultimatum
Tables and Figures
Table 1: Payoffs in Minimum-Effort Game (a=0.5, b=0.5, and c=3)
Your
Choice
Minimum Value of X Chosen
7 6 5 4 3 2 1
7 $6.50 $5.50 $4.50 $3.50 $2.50 $1.50 $0.50
6 $6.00 $5.00 $4.00 $3.00 $2.00 $1.00
5 $5.50 $4.50 $3.50 $2.50 $1.50
4 $5.00 $4.00 $3.00 $2.00
3 $4.50 $3.50 $2.50
2 $4.00 $3.00
[image:29.612.102.523.364.496.2]1 $3.50
Table 2: Payoffs in Median-Effort Game (a=0.5, b=0.5, and c=3)
Your
Choice
Median Value of Y Chosen
7 6 5 4 3 2 1
7 $6.50 $5.50 $4.50 $3.50 $2.50 $1.50 $0.50
6 $6.00 $6.00 $5.00 $4.00 $3.00 $2.00 $1.00
5 $5.50 $5.50 $5.50 $4.50 $3.50 $2.50 $1.50
4 $5.00 $5.00 $5.00 $5.00 $4.00 $3.00 $2.00
3 $4.50 $4.50 $4.50 $4.50 $4.50 $3.50 $2.50
2 $4.00 $4.00 $4.00 $4.00 $4.00 $4.00 $3.00
1 $3.50 $3.50 $3.50 $3.50 $3.50 $3.50 $3.50
Table 3: Summary of Treatments
Treatment First Game
Second Game
Same or Different
Groups
Number of Sessions
Number of Subjects SeqMin Minimum Median Same 2 50
SeqMed Median Minimum Same 2 50
SeqMedDiff Median Minimum Different 2 50
Table 4: Frequency of Pareto Optimal Coordination in Period 10 (Number of Groups)
Treatment Minimum Game Median Game SeqMin 1/10 (10%) 8/10 (80%)
SeqMed 8/10 (80%) 9/10 (90%)
SeqMedDiff 6/10 (60%) 10/10 (100%)
Sim 4/15 (27%) 11/15(73%)
Table 5: Regression Models of Individual Subject Choices
Dependent Variable: Minimum Game Median Game Individual Subject
Choices
(1) SeqMin
(2) SeqMed
(3) SeqMedDiff
(4) Sim
(5) SeqMin
(6) SeqMed+
(7) Sim
Median Choice 1.03**
(current period) (0.09)
Minimum Choice 0.03
(current period) (0.02)
Group Minimum Choice 0.84** 0.39** 0.43** 0.57** (previous period) (0.03) (0.05) (0.04) (0.03)
Group Median Choice 0.63** 0.67** 0.83**
(previous period) (0.09) (0.05) (0.04)
Inverse of period 4.25** 1.31** 1.80** 3.85** -0.07 -0.06 -0.06 (0.42) (0.21) (0.34) (0.35) (0.14) (0.16) (0.15)
Observations 450 450 450 675 450 900 675
# of subjects 50 50 50 75 50 100 75
** p<0.01, * p<0.05. Standard errors in parentheses.
Columns (1), (2), (3), (5) and (6) are estimated using random subject effects. Columns (4) and (7) are estimated using a simultaneous system of equations.
+ Column (6) aggregates SeqMed and SeqMedDiff data since the treatments are identical for these first 10
[image:30.612.83.538.285.462.2]Figure 1: Average Minimum Game Choices over 10 Periods
Figure 2: Average Median Game Choices over 10 Periods
1 2 3 4 5 6 7
1 2 3 4 5 6 7 8 9 10
A v e rag e Ch o ic e s Period Average Choices
SeqMin SeqMed SeqMedDiff Sim 1 2 3 4 5 6 7
1 2 3 4 5 6 7 8 9 10
M in im u m C h o ic e s Period
Average Group Minimum Choices
SeqMin SeqMed SeqMedDiff Sim
1 2 3 4 5 6 7
1 2 3 4 5 6 7 8 9 10
A v e rag e Ch o ic e s Period Average Choices
SeqMin SeqMed SeqMedDiff Sim
1 2 3 4 5 6 7
1 2 3 4 5 6 7 8 9 10
M e d ian C h o ic e s Period
Average Group Median Choices
[image:31.612.67.547.425.644.2]Figure 3: Correlation of Minimum and Median Game Choices
Figure 4: Miscoordination over 10 Periods
1 2 3 4 5 6 7
1 2 3 4 5 6 7 8 9 10
Ch o ic e in G ro u p
Group Identifier (Sorted by Med Choices)
SeqMin Treatment Minimum Median 1 2 3 4 5 6 7
1 2 3 4 5 6 7 8 9 10
Ch oice in Gr ou p
Group Identifier (Sorted by Med Choices)
SeqMed Treatment Minimum Median 1 2 3 4 5 6 7
1 3 5 7 9 11 13 15
Ch o ic e in G ro u p
Group Identifier (Sorted by Med Choices) Sim Treatment Minimum Median 0 0.5 1 1.5 2 2.5
1 2 3 4 5 6 7 8 9 10
M isco o rd in ation Period Minimum Game
SeqMin SeqMed SeqMedDiff Sim
0 0.5 1 1.5 2 2.5
1 2 3 4 5 6 7 8 9 10
M isco o rd in ation Period Median Game
[image:32.612.80.547.427.660.2]Appendix I.
–
Instructions for Simultaneous Treatment
(Not Intended for Publication)
GENERAL INSTRUCTIONS
This is an experiment in the economics of decision making. Various research agencies have provided funds for this research. The instructions are simple. If you follow them closely and make appropriate decisions, you can earn an appreciable amount of money which will be paid to you at the end.
It is very important that you remain silent and do not look at other people’s work. If you have any questions,
or need assistance of any kind, please raise your hand and an experimenter will come to you. If you talk, laugh, exclaim out loud, etc., you will be asked to leave and you will not be paid. We expect and appreciate your cooperation.
YOUR DECISION
In this part of the experiment you will be asked to make a series of choices in decision problems. How much you receive will depend partly on chance and partly on the choices you make. The decision problems are not designed to test you. What we want to know is what choices you would make in them. The only right answer is what you really would choose.
For each line in the table in the next page, please state whether you prefer option A or option B. Notice that there are a total of 15 lines in the table but just one line will be randomly selected for payment. You do not know which line will be paid when you make your choices. Hence you should pay attention to the choice you make in every line. After you have completed all your choices a token will be randomly drawn out of a bingo cage containing tokens numbered from 1 to 15. The token number determines which line is going to be paid.
Your earnings for the selected line depend on which option you chose: If you chose option A in that line, you will receive $1. If you chose option B in that line, you will receive either $3 or $0. To determine your earnings in the case you chose option B there will be second random draw. A token will be randomly drawn out of the bingo cage now containing twenty tokens numbered from 1 to 20. The token number is then compared with the numbers in the line selected (see the table). If the token number shows up in the left column you earn $3. If the token number shows up in the right column you earn $0.
Are there any questions?
Deci sion no. Option A Option B Please choose A or B
1 $1 $3 never
$0 if 1,2,3,4,5,6,7,8,9,10,11,12,13,14,15, 16,17,18,19,20
2 $1 $3 if 1 comes out of the bingo cage
$0 if 2,3,4,5,6,7,8,9,10,11,12,13,14,15, 16,17,18,19,20
3 $1 $3 if 1 or 2
$0 if 3,4,5,6,7,8,9,10,11,12,13,14,15, 16,17,18,19,20
4 $1 $3 if 1,2 or 3
$0 if 4,5,6,7,8,9,10,11,12,13,14,15, 16,17,18,19,20
5 $1 $3 if 1,2,3,4
$0 if 5,6,7,8,9,10,11,12,13,14,15, 16,17,18,19,20
INSTRUCTIONS
In this part of the experiment you will participate in a game with four other participants. You will not know the identity of the participants you are grouped with. The experiment will consist of 10 periods. You will participate in both a BLUE GAME and a GREEN GAME at the same time and with the same participants. The BLUE GAME
will appear on the left side of the screen and the GREEN GAME will appear on the right side of the screen at the same time in all 10 periods.
One period will be randomly selected for payment for each game at the end of the experiment. After you have completed all periods a token will be randomly drawn out of a bingo cage containing tokens numbered from 1 to 10. The token number determines which period is going to be paid in the BLUE game. That token will be returned to the bingo cage, and a token will be randomly drawn again out of the bingo cage containing tokens numbered from 1 to 10. The token number determines which period is going to be paid in the GREEN game.
In each period, you will select two numbers denoted by X and Y. The values of X and Y you may choose are
1, 2, 3, 4, 5, 6, or 7. When you are ready to make your decision, click on the “input boxes” below “Enter your choice of X” and “Enter your choice of Y” and the program will allow you to enter in your number choices. When you are finished making your choices, click “Submit”.
BLUE GAME
In the BLUE GAME, the value you pick for X and the minimum value of X chosen by all members in your group (including yourself) will determine your payoff in any one period.
Table 1 tells you how you earn money. Please look at the table now. The entries in the table give each
[image:34.612.74.563.253.567.2]