Munich Personal RePEc Archive
Price Reform and Household Demand for
Electricity
Carter, Adrian and Craigwell, Roland and Moore, Winston
Barbados Light and Power Company Limited, Department of
Economics, University of the West Indies, Cave Hill Campus,
Barbados
2011
Online at
https://mpra.ub.uni-muenchen.de/40934/
1
Price Reform and Household Demand for Electricity
Adrian Carter
Marketing and Communications Department
Barbados Light and Power Company Limited
Garrison, St. Michael
Barbados
and
Roland Craigwell1 and Winston Moore
Department of Economics, University of the West Indies, Cave Hill Campus, Bridgetown,
BB11000, Barbados
1
Corresponding author: R. Craigwell, Department of Economics, University of the West Indies, Cave Hill Campus, Bridgetown, BB11000, Barbados. Tel.: +246-4174474; Fax:+246-4174260; Email:
2 Price Reform and Household Demand for Electricity
Abstract
This paper uses an estimated model of residential electricity demand to examine the impact of
proposed tariff changes on a representative sample of 130 Barbadian households. The estimated
equation results suggest that the price elasticities of demand for particular appliances varied
significantly, with households that utilize solar water heating being more price elastic than
households that utilize air conditioning and electric water heating electric heating. The income
effects were, however, statistically insignificant, as they may have been captured by choices of
appliances rather than utilisation. The estimated model results were then employed to examine
the effect of a proposed change in the tariff structure for electricity in Barbados. The simulated
results seem to indicate that changes in the electricity rate structure are likely to have very little
impact on households demand for electricity. However, changes in consumption patterns could
occur within upper consumption and upper income households.
JEL Classification: Q41; C24; O54
3 1. Introduction
The Barbados Light and Power Company (BL&P), which under current law, is the only
electricity service provider in Barbados, has recently been given permission by the Fair Trading
Commission, to submit its application for a review to its rates and rate structure, which have not
been changed since 1983. This action was required as it was thought that the current rates do not
permit the BL&P to maintain its reliability and efficiency as well as to satisfy lenders and attract
new capital. One aspect of these proposed reforms that are likely to be important to the
deliberations between the Fair Trading Commission (FTC) and the BL&P is the effects of these
price revisions on consumption which will depend on the price elasticity of demand for
electricity. In the case where the price elasticity of demand is low this provides some
justification for the FTC to grant permission to the BL&P to change its rates and rate structure;
in contrast, when the price elasticity is high the FTC has little reason to allow the BL&P to make
these price revisions. This decision obviously would require knowledge of demand for
electricity studies in as much details as possible.
This paper estimates a demand for electricity function for Barbados to assess the impact of the
proposed rate changes on consumers. For the first time, survey data on Barbadian households
are utilised. Past electricity demand studies for Barbados (Cox, 1983; Durant, 1991; Mitchell,
2009) have not addressed policy issues like the one proposed above and have been based on
aggregate time series macro data of the country along the lines of Wolde-Rufael (2005) for
African countries and Liang, Fan and Wei (2007) for China. For instance, aggregate electricity
consumption is usually regressed on an income variable and a price variable over various time
4
have recently shown that the use of micro-level data, which reflects individual and household
behaviour more closely, can add detail to an understanding of the nature of consumer responses
(Tiwari, 2000; Holtedahl & Joutz, 2004; Louw, Conradie, Howells, & Dekenah, 2008).
Microeconomic approaches to energy and electricity demand modelling also enable an analysis
across different heterogeneous household groups and allow for the incorporation of a wide
variety of household characteristics within the estimated equations (Hawdon, 1992).
In order to simulate the effects of the proposed tariff changes discussed above, the electricity
demand function is used to examine the impact of the tariff changes on the Barbadian consumers,
by adjusting the price variables while leaving the other variables unchanged. The results
obtained can not only reveal likely demand-side effects but also distributional changes as well.
The results from the study would therefore be of use to consumer groups, policymakers as well
as officials from the Barbados Light and Power involved in forecasting demand for electricity on
the island.
In the following section, the background to the rate adjustment is discussed. After that, the
empirical approach, which consists of the conceptual set-up, the econometric methodology and
data, is presented. Next the statistical results are discussed and the paper closes with a brief
5 2. Background to Rate Application
The BL&P submitted an application for a review of its rates and rate structure to the FTC on
May 8, 2009. The previous application for a review of rates by the BL&P was in 1983 when the
then Public Utilities Board granted the Company an increase in its basic electricity rates. The
BL&P indicated that the present rate application is being made because the current rates are
inadequate for the Company to continue to meet its operating and maintenance expenses, satisfy
lenders and attract new capital to replace older plant. Some of the main objectives of the rate
application as outlined by the BL&P include: (i) the provision of fair rates and to apportion the
total cost of service among the different classes of customers in a fair manner, sensitive to any
impact on customers; (ii) to encourage customers to use electricity more efficiently by, revising
the existing rates to more closely reflect the unit cost of serving customers, thereby reducing the
inter and intra class subsidies that presently exist; (iii) to shift the 2.64 cents per kWh of fuel cost
from the base energy rate to the Fuel Clause Adjustment (FCA) so that the full fuel cost is
collected through the Fuel Clause Adjustment; (iv) to revise the Service Charges so that they
may more closely reflect the cost of service; and (v) to lessen the rate impact of the overall
revenue increase on customers in the lower income bracket.
The proposed rate application is expected to affect the structure of all of the BL&P’s existing
tariff groups. The Domestic Service group services residential consumers and changes to its
fixed domestic customer charge and the base energy charge are likely. Currently domestic
service consumers are first charged a BDS$3 fixed customer fee, on top of an inclining three-tier
6
per kWh. Those customers utilizing in excess of 100 kWh are charged BDS$0.196 for the next
900 kWh and BDS$0.216 for each additional kWh in excess of 1000 kWh. The BL&P is
therefore seeking permission to adjust the consumer price to an inclining block fee where
customers that consume less than 100 kWh on average over a twelve month period will be asked
to pay a BDS$6 monthly customer charge, while the consumer price will increase to BDS$10 for
those with consumption levels between 101 and 500 kWh and BDS$14 for those customers
consuming a monthly twelve month average above 500 kWh.
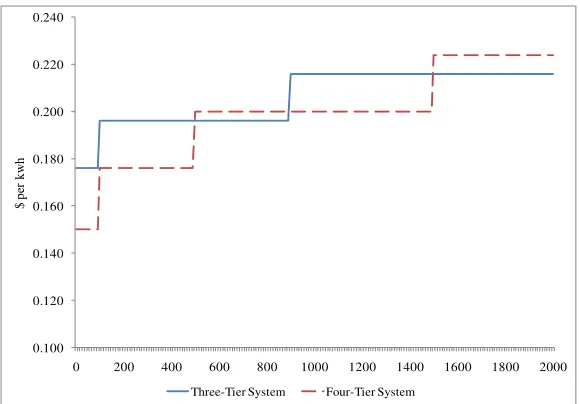
A four-tier inclining block rate is proposed for the base energy charge that will see the exclusion
of 2.64 cents/kWh that presently goes towards the fuel cost being shifted from the base energy
rate to the Fuel Clause Adjustment (FCA). In addition, customers using up to 100 kWh will be
charged BDS$0.150 per kWh, while those consumers utilising in excess of 100 kWh would have
to pay BDS$0.176 per kWh for the next 400 kWh. The price for customers using in excess of
500 kWh will be BDS$0.200 per kWh for the next 1,000 kWh and BDS$0.224 per kWh for any
[image:7.612.72.362.511.713.2]consumption greater than 1,500 kWh (Figure 1).
Figure 1: Current and Proposed Marginal Price Schedule for Residential Electricity
0.100 0.120 0.140 0.160 0.180 0.200 0.220 0.240
0 200 400 600 800 1000 1200 1400 1600 1800 2000
$
p
er
k
w
h
7 3. Empirical Approach
3.1 Conceptual Framework
In electricity demand studies it is customary (Dubin & McFadden, 1984; Filippini & Pachauri,
2004; Holtedahl & Joutz, 2004; Louw, Conradie, Howells, & Dekenah, 2008) to assume that the
household demand for electricity is derived from the demand of the commodity itself (electricity)
and the service that electricity provides (i.e. being able to operate domestic appliances,
televisions, etc.). Therefore, a general household utility function incorporating the household’s
electricity demand would generally take the form:
(1)
where is the energy services consumed by the household, is electricity, are appliances,
are other fuels consumed by the household, are goods and services consumed by the
household, represents the tastes and preferences of the household, is the income of the
household, is the price of energy services and are the prices of the other goods and
services consumed. With maximising household utility being the objective, the Lagrange
8
(2)
The first-order conditions from this Lagrange function allow us to derive the Marshallian
demand function for the household’s demand for energy services as follows:
(3)
The household’s tastes and preferences ( ) are incorporated in the demand function as they form
part of the decision process in determining which fuels are used by the household as well as they
reflect any externalities that may impact on health and productivity. The stochastic term, , is
added to the equation for estimation purposes.
3.2 Econometric Approach
Like most electricity providers around the world, the price schedule of electricity services
supplied in Barbados is non-linear. Given this non-linear pricing schedule, Reiss and White
(2005) note that the stochastic term in Equation (3) conveys information about the
willingness-to-pay of the consumer, i.e. customers self-select the marginal price they are willing to pay. The
demand function for the household under a three-tier pricing schedule therefore takes the
9
(4)
Equation (4) is a censored regression model that can be estimated using the usual censored
regression modelling techniques. The model is estimated utilising the Heckman two-step
approach (Cameron & Trivedi, 2005).
The demand for electricity services is a derived demand where individuals desire to consume
certain energy-using appliances and therefore require electricity to power these durable
goods(Dubin & McFadden, 1984). In this instance, modelling the electricity demand for
individual appliances would be preferred; however, data at this level of disaggregation is not
available. Consequently, electricity demand is modelled as the sum of the electricity used by
appliance categories:
(5)
where are the slope coefficients that depend on the household’s holdings of
particular appliances with being a dummy variable that takes a value of 1 if the household
holds appliance and 0 otherwise. Following (Dubin & McFadden, 1984), the choice of space
10
exogenous. There are two motivations for making this simplifying assumption: (1) this approach
increases the degrees of freedom as a smaller set of interaction terms are employed, and; (2)
space and water heating are primary consumption decisions that require major retrofitting of the
house. In contrast, the other appliances usually do not require such critical investments.
3.3 Data
The empirical electricity demand data employed in this study is taken from the Residential
Customer Survey (RCS) of consumers conducted by the BL&P in 1997 as part of a larger study.
The survey collects information on the electricity consumed by households, their portfolio of
appliance holdings along with demographic data. It provides information on 129 Barbadian
households, which is less than 0.2 percent of households on the island. It is a nationally
representative probability sample of households, with representative sub samples among usage
levels. The survey was conducted by in-home interviews. Interviewers inventory the household’s
appliances, assess physical characteristics of the residence, and collect demographic information.
To minimize measurement error, each household’s metered energy consumption data are sourced
directly from the electric utility. Approximately one hundred and thirty-three interviews were
completed among residential customers, thus representing a response rate of 97 per cent.
The consumption of electricity, , is approximated by the monthly electricity usage. Two price
variables are employed in the study: the average price of electricity and the marginal price of
11
dollars by the amount of electricity (kWh) used, while the marginal price is the highest per kWh
tier price that the consumer presently pays.
Income is approximated by an interval variable ranging from 1, where the household’s monthly
income is less than BDS$1,200 to 5, if the household’s income exceeds BDS $10,000 on a
monthly basis. In terms of other household characteristics, variables representing the number of
persons and bedrooms in the household are employed as well as the type of housing unit. The
appliance portfolio is made up of dummy variables for the existence of televisions, refrigerator,
washing machine, dryer, freezer, electric stove, toaster oven, wall fan, and security lighting. On
the whole, most customers (over 70 percent), tend to consume 100 – 900 kWh on a monthly
basis and therefore fall in tier 2 of the Barbados Light and Power three-tier price schedule. Of
the remainder, just fewer than 20 percent consume more than 900 kWh on a monthly basis while
a relatively small proportion of Barbadian households (less than 10 percent) consume less than
100 kWh of electricity on a monthly basis.
Descriptive statistics for the variables utilised in the study are shown in Table 2. They suggest
that the average Barbadian household uses about 546 kWh per month which translates to about
BDS$105, or about BDS$0.19 per kWh. The average household sampled had a monthly income
of BDS$4,400, lived in three-bedroom house with three individuals in the household.
Table 1: Descriptive Statistics
Mean Max Min Std. Dev. Skewness Kurtosis Jarque-Bera
12 electricity
usage of
households
P Average price
of electricity
(monthly
electricity
bill/monthly
electricity
usage)
0.190 0.210 0.180 0.006 0.703 5.136 35.139*
MP Marginal price
of electricity
0.203 0.220 0.180 0.009 0.484 3.980 10.199*
INCOME Monthly
Income of
household
3.124 6.000 0.000 1.541 0.241 2.370 3.386
NTEL Number of
televisions
1.085 5.000 0.000 1.250 0.681 2.483 11.417*
PERSONS Number of
persons in
household
3.271 6.000 0.000 1.638 0.319 2.224 5.423
BEDROOMS Number of
bedrooms in
residence
3.085 6.000 0.000 1.125 -0.036 4.195 7.707*
FRIGE Household has
a refrigerator
0.977 1.000 0.000 0.151 -6.326 41.024 8631.741*
WASHING Household has
a washing
13 machine
DRYER Household has
a dryer
0.147 1.000 0.000 0.356 1.991 4.962 105.882*
FREEZER Household has
a freezer
0.488 1.000 0.000 0.502 0.047 1.002 21.500*
ELESTOVE Household has
an electric
stove
0.318 1.000 0.000 0.467 0.782 1.612 23.515*
TOASTERO Household has
a toaster oven
0.411 1.000 0.000 0.494 0.362 1.131 21.593*
WALLFAN Household has
a wall fan
0.690 1.000 0.000 0.464 -0.821 1.674 23.945*
MULUNT Household is a
multi-unit
property
0.093 1.000 0.000 0.292 2.802 8.853 352.937*
SELIGHT Household has
security
lighting
0.178 1.000 0.000 0.384 1.681 3.826 64.416*
ELECHEAT Household
uses electric
water heating
0.186 1.000 0.000 0.391 1.614 3.604 57.935*
AC Household has
air
conditioning
0.248 1.000 0.000 0.434 1.167 2.361 31.458*
SOLAR Household has
solar water
heating
14 4. Results
4.1 Electricity Demand Function
Table 2 displays the estimated electricity demand function for Barbados using the Heckman
two-step procedure, where the Mills ratios are omitted because their economic interpretation is
unclear. The second stage of the Heckman estimator was estimated using ordinary least squares
(OLS) as well as full information maximum likelihood techniques. However, the results from
both techniques were quite similar. Consequently, only the findings from the OLS estimation
approach are displayed, with the reported standard errors being White
heteroskedasticity-consistent. The model is able to account for a large proportion of the cross-sectional variation in
electricity consumption, 85 percent. The calculated Jarque-Bera statistic for the model residuals
suggested that the null hypothesis of normality could not be rejected at normal levels of testing.
Given that the model is a reasonably adequate representation of electricity demand in Barbados,
an analysis of the estimated coefficient estimates is now given. The coefficient estimates on the
appliance holdings show the proportional change in electricity consumption based on consumers’
portfolio holdings (washing and elestove). The other appliances were statistically insignificant
and therefore dropped out with the use of stepwise least squares. The coefficient for the
existence of a washing machine was positive and statistically significant, suggesting that the
presence of a washing machine is noteworthy in explaining the demand for electricity in
15
It was somewhat surprising that the number of bedrooms had a significant positive effect on the
demand for electricity while the size of the household effect was insignificant. One would have
expected that household size would have positive coefficients as larger families would consume
more electricity, as well as utilise more electricity to light and cool or heat the rooms in the
house depending on the seasonal requirement. Halvorsen (1975), however, notes that
households with larger numbers may substitute electrical power consumption with the use of
[image:16.612.68.552.317.721.2]natural gas for certain requirements that would be energy intensive.
Table 2: Electricity Demand Model Coefficient Estimates – Heckman Two-Step Approach
Explanatory Variable Baseline Use Interaction Effects
Electric Water
Heating
Solar Water
Heating
Air Conditioning
Constant 1.914
(5.113) -175.589 (33.224)*** 9.007 (4.157)** -9.564 (4.015)**
p -0.183
(0.0366)***
-1.272
(0.237)***
- -
mp 0.061
(0.019)*** -0.473 (0.092)*** 0.055 (0.025)** -0.057 (0.024)**
income 0.029
(0.042)
- -0.105
(0.064)*
0.135
(0.057)**
bedrooms 0.099
(0.034)***
-0.145**
(0.061)
- -
washing 0.259
(0.112)**
- - -
elestove 0.085
(0.076)
16
mulunt -0.243
(0.226)
- - -
persons - - 0.086
(0.046)*
-
R-squared 0.853
s.e. 0.335
Jarque-Bera 0.207
[0.901]
Notes: (1) White heteroskedasticity-consistent standard errors provided in parentheses, while p-values are given in
parentheses.
(2) ***, ** and * indicates significance at the 1, 5 and 10 percent levels of significance.
Due to the existence of non-linear pricing, the coefficients on the marginal and average price as
well as income variables cannot be interpreted as elasticities. As a result, following Reiss and
White (2005) the non-linear price elasticity which accounts for the substitution and income
effects is estimated using the following equation:
(6)
The calculated price and income elasticities are provided for all households as well as those with
electric water heating, air conditioning and solar water heating. The computed price elasticity of
demand for Barbadian households was -0.778, which was somewhat lower than that obtained by
Houthakker (1951), but in line with studies which also use less aggregated data (Parti & Parti,
1980; Dubin & McFadden, 1984; Munley, Taylor, & Formby, 1990; Maddock, Castano, &
17
that these households tend to be less price sensitive relative to the average Barbadian household.
In contrast, households with solar water heaters were more prices sensitive, which might be
explain by the fact that these households substitute the electricity demanding water heaters, for
the heater that had no reliance on electricity. The price elasticity of households with air
[image:18.612.69.497.265.465.2]conditioning was generally consistent with those obtain for the average household.
Table 3: Price and Income Elasticities for Barbadian Households
Explanatory Variable Price Elasticity Income Elasticity
All households -0.778 0.015
Electric water heating
households
-0.756 -
Air conditioning households -0.775 0.031
Solar water heating households -0.783 -0.002
The income elasticity of demands was calculated in a similar fashion as the price elasticities.
The income elasticities estimates were small, suggesting that the demand for electricity is
relatively income inelastic. As noted earlier, electricity demand is a derived demand that is
based on the household’s portfolio of appliances. Therefore fluctuations in demand for
electricity seem to be more a function of appliance holdings rather than income fluctuations.
These results are similar to those obtained by Reiss and White (2002). Note that the income
elasticity for households with solar water heating was negative reflecting the substitution effect
18
4.2 Projected Impact of Rates Adjustment on Households
The paper now turns to investigating the impact of the proposed new rate structure on
households demand for electricity. Table 4 demonstrates that the proposed changes in the
electricity rates would result in a reduction in the mean marginal price of electricity. Graphically,
Figure 1 shows that the proposed new price schedule lies below and above existing price
schedule depending on the consumption level. The proposed four-tier system of prices will see
the marginal price of electricity for households within the sample move from $0.198 per kWh to
$0.184 per kWh, a decrease of 7%. Consumers that have consumption patterns less than 500
kWh per month and between 1000 and 1500 kWh per month would benefit most from the
changes in the marginal prices. Households however, with consumption levels in excess of 1500
[image:19.612.67.548.513.652.2]kWh between 500 and 1000 kWh per month will face a higher marginal price.
Table 4: Marginal and Average Prices Before and After Rate Adjustments
Household Monthly Consumption Existing Average Price Proposed Average Price Percentag e Change Existing Marginal Price Proposed Marginal Price Percentag e Change
Under 500 kWh 0.462 0.495 7.1 0.195 0.174 -10.5
500 to 1000 kWh 0.458 0.486 6.1 0.196 0.2 2
1000 to 1500 kWh
0.46 0.486 5.6 0.216 0.2 -7.4
More than 1500 kWh
0.467 0.492 5.5 0.216 0.224 3.7
Sample 0.461 0.492 6.7 0.198 0.184 -7
Table 4 above further suggest that the proposed changes in the rate structure will result in an
19
will occur due to the proposed increase in the monthly customer charge and the shifting of the
fuel related $0.0264 from the base charge to the fuel clause adjustment.
The results of the simulation exercises to examine the impact of the proposed rates on household
electricity consumption are shown in Table 5. Households will generally alter their electricity
consumption very little in response to the proposed changes to the four-tier structure and the
increase in price. The results indicate that the average monthly electricity consumption within the
sample employed here will be 5 kWh lower due to marginal price changes offsetting much of the
impact of the average price increases. The model predicts that notable reductions in demand will
only occur within upper income households. This is confirmed by the 5.6% decrease in demand
predicted for households consuming over 1500 kWh per month as households with these
consumption levels are normally within the upper income bracket. Households with monthly
consumption patterns between 500 kWh and 1000 kWh per month are expected to make the
greater percentage adjustment in their demand for electricity. These households are likely to
[image:20.612.170.442.540.702.2]contract their monthly consumption by 6.2%.
Table 5: Distributional kWh Monthly Impact of Rate Adjustments
Average
Price Effect
Marginal
Price Effect
Total Effect
Monthly Household Income
Under $1200
-15
(-5.7%)
21
(7.3%)
6
(1.6%)
$1200 - $2399
-19
(-6.3%)
19
(8.1%)
0
20 $2400 - $4399
-22 (-5.5%) 21 (5.9%) -1 (-0.4%)
$4400 - $6399
-26 (-4.6%) 22 (4.8%) -4 (-0.2%)
$6400 - $10000
-36 (-4.1%) 22 (3.5%) -14 (-0.6%)
More than $10000
-40 (-4.0%) 10 (1.1%) -30 (-3.0%)
Monthly Consumption Band
Under 500 kWh
-15 (-5.8%) 24 (8.4%) 9 (2.6%)
500 to 1000 kWh
-33 (-4.6%) -11 (-1.5%) -44 (-6.2%)
1000 to 1500 kWh
-44 (-3.7%) 58 (4.9%) 14 (1.2%)
More than 1500 kWh
-70 (-3.3%) -47 (-2.3%) -117 (-5.6%)
Sample -24
(-5.2%)
19
(5.5%)
-5
(0.0%)
Note: percentage changes given parentheses below values
The BL&P indicated that the proposed rate structure is designed to achieve a number of
objectives. Evaluating how the proposed new pricing structure will achieve those objectives is
not very simple; however some inferences can be made from the results. The structure of the new
pricing system seem likely to achieve its primary objective of raising additional revenue as
demonstrated by the across the board increase in the average price. The achievement of the
21
evident. Low income households within the sample consume less than 500 kWh per month and
therefore will benefit from a significant reduction in their marginal price. The objective of
encouraging households to use electricity more efficiently and thus promote energy conservation
will also likely be accomplished. The increase in marginal prices for higher levels of
consumption will have the effect of lowering significantly the demand for electricity among
households within the high and middle consumption bands.
5. Conclusions
With a review of the rates and rate structure of the Barbados Light and Power Company
forthcoming, this paper estimated, for the first time, an electricity demand function using survey
data of a sample of 130 Barbadian customers. This function is then used to project the impact of
the proposed change in the rates and rate structure on Barbadian households. As the demand for
electricity services is a derived demand and data for the electricity demand for individual
appliances is not available, electricity demand is modelled as the sum of the electricity used by
appliance categories. Following Dubin and McFadden (1984), the choice of space cooling and
water heating are isolated in this paper, while the other appliances are treated as statistically
exogenous. The non-linear pricing structure in Barbados is set up as a censored regression and
estimated utilising the Heckman two-step approach where, due to the existence of non-linear
pricing, Reiss and White (2002) coefficients on the marginal and average price as well as income
22
The reported results suggest that the price elasticities of demand for particular appliances varied
significantly, with households with solar water heating more price elastic than air conditioning
and electric water heating. The income effects were, however, statistically insignificant as these
effects may have been captured by choices of appliances rather than utilisation and agree with
studies by Parti and Parti (1980) and Dubin and McFadden (1984). The income elasticity for
households with solar water heating was found to be negative, probably reflecting the
substitution effect arising from the use of solar power to provide water heating. The database
also allowed the authors to breakdown price and income elasticities by individual households
and these results suggest that middle-income households tend to be more prices sensitive, even
relative to low income households, indicating that the middle-income household may be more
able to reduce their usage of discretionary appliances.
The impact of the introduction of the new tariff structure was also analysed and revealed that
households with consumption patterns under 500 kWh will fear much better than higher
consumption households from changes in the proposed rate structure. In general households will
vary their consumption very little as a result of the introduction of the new rate structure. The
more significant reduction in demand for electricity is expected among upper income and upper
consumption households. In essence, the findings imply that the proposed new rate structure is,
generally, not likely to have a significant influence on households demand for electricity, giving
credence to the Fair Trade Commission’s recent decision to approve the BLP rate changes with
23 References
Cameron, C. A., & Trivedi, P. K. (2005). Microeconometrics: Methods and Applications. New
York: Cambridge University Press.
Cox, W. (1983). Energy Consumption and Economic Growth: A study of the Barbadian
Experience, 1960-1977. Bridgetown: Central Bank of Barbados.
Dubin, J. A., & McFadden, D. L. (1984). An Econometric Analysis of Residential Electric
Appliance Holdings and Consumption. Econometrica, 52 (2), 345-362.
Durant, I. (1991). Residential Demand for Electricity in Barbados, 1966-88. Bridgetown: Central
Bank of Barbados.
Filippini, M., & Pachauri, S. (2004). Elasticities of Electricity Demand in Urban Indian
Households. Energy Policy, 32 (3), 429–436.
Halvorsen, R. (1975). Residential Demand for Electric Energy. Review of Economics and
Statistics, 57 (1), 12-18.
Hawdon, D. (1992). Energy Demand : Evidence and Expectations. London: Surrey University
Press.
Holtedahl, P., & Joutz, F. (2004). Residential Electricity Demand in Taiwan. Energy Economics,
26 (2), 201–224.
Houthakker, H. S. (1951). Some Calculations of Electricity Consumption in Great Britain.
Journal of the Royal Statistical Society (A), 114 (3), 351-371.
Liang, Q., Fan, Y., & Wei, Y. (2007). Carbon Taxation Policy in China: How to Protect Energy-
24
Louw, K., Conradie, B., Howells, M., & Dekenah, M. (2008). Determinants of Electricity
Demand for Newly Electrified Low-Income African Households. Energy Policy, 36 (8),
2814-2820.
Maddock, R., Castano, E., & Vella, F. (1992). Estimating Electricity Demand: The Cost of
Linearising the Budget Constraint. Review of Economics and Statistics, 74 (2), 350-354.
Mitchell, T. (2009). A Co-Integration Analysis of the Price and Income Elasticity of Energy
Demand. Bridgetown: Central Bank of Barbados.
Munley, V. G., Taylor, L. W., & Formby, J. P. (1990). Electricity Demand in Multi-Family,
Renter-Occupied Residences. Southern Economic Journal, 57 (1), 178-194.
Parti, M., & Parti, C. (1980). The Total and Appliance-Specific Conditional Demand for
Electricity in the Household Sector. Bell Journal of Economics, 11 (1), 309-321.
Reiss, P. C., & White, M. W. (2005). Household Electricity Demand, Revisited. Review of
Economic Studies, 72 (3), 853-883.
Tiwari, P. (2000). Architectural, Demographic, and Economic Causes of Electricity
Consumption in Bombay. Journal of Policy Modeling, 22 (1), 81-98.
Wolde-Rufael, Y. (2005). Energy Demand and Economic Growth: The African Experience.