On the New Methodology of Cost-Benefit
Analysis of ALMP – The Case of Serbia
Zubović, Jovan and Simeunović, Ivana
15 March 2012
Online at
https://mpra.ub.uni-muenchen.de/42532/
C H A P T E R 6
ON
THE
NEW
METHODOLOGY
OF
COST
‐
BENEFIT
ANALYSIS
OF
ALMP
–
THE
CASE
OF
SERBIA
1Jovan
Zubovi
ć
2,
Ivana
Simeunovi
ć
3Abstract: Active labourmarket policies are commonly used toolto fight unem‐ ployment.In thelate1970sinmostdevelopedcountriesofOECDgovernmentex‐ penditures on those policies reachedup to 1.5% ofGDP. Thiscreated a need to evaluate theimpactofsuchmeasuresand performcost‐benefitanalyses.Evalua‐ tions have in the previous 30years been undertaken by using several methods: experimentalandquasi‐experimental,measurementsandevaluationsofprocesses performance,microandmacroanalyses.Inthispaperwehavepresentedandtest‐ ed amodifiedapproachofcost‐benefit analysisofALMPviewedasaninvestment made byagovernment. Thegoalwasto determinewhetherbyusing suchanap‐ proach itis possible to providenewinformation topolicy makers andto deepen researchandfurtherdevelopamethodologywhichwillberobustenoughtoserve asaproofofALMPeffectiveness.InitialresultsoftheempiricalresearchinSerbia show very positive results, indicating thatespecially in the periodof recessions, active measures cansignificantly improve labour marketconditions, thus create highlevelsofreturntoinvestments(takingALMPasaninvestment).Usingaggre‐ gatedataonallpersonsbeingregisteredasunemployedatthebeginningof2008 and 2009, we havetested howthe ALMPimpact thepotential growthoftax re‐ turns.Ourfindingssaythatin2008therehasbeenanetgainof€269millionand in2009€166millionintaxreturnscollected.
Keywords:Activepolicies,evaluation,unemployment
1 An earlier version of this paper was presented on an IJAS International Conference for Aca‐
demic Disciplines at the American University in Rome, October 31 – November 3, 2011.
2 Dr Jovan Zubović, Research Associate, Economics Institute Belgrade; Assistant Professor,
University Alfa, Belgrade
Introduction
One of the most discussed topics in the field of labour economics is and eval‐ uation of the effects of the active labour market policies (ALMP). Although active policies are a set of policies formulated by the political representatives and implemented under the political consensus, the two basic functions of ALMPs are related to growth of economic and social welfare. In this paper we are analysing their impact on the economic welfare of the society.
As one of the definitions states that economics is a science on how to allocate scarce resources among alternative uses, in this paper we observe expendi‐ ture on active labour market policies as a government investment, and con‐ sider financial funds available to the government to be scarce. We are analys‐ ing whether those „investments“, from the economic point of view, are bene‐ ficial to the Governments (and tax returns), while at the same time taking into account opportunity costs of such „investments“. Just like the firm max‐ imizes its profits by selecting the level of output, alternative technologies and deciding on how much input to introduce; like the government seeks to max‐ imize its returns to investments in ALMPs along with minimizing the levels of unemployment. The returns in this paper are considered to be any type of tax (or similar) returns to the budget, created as a result of new employment created by the interventions in different types of ALMPs. In order to assess the returns from public expenditures, economists and other scientists have long relied on social cost‐benefit analysis.
There is the process of creating Active labour market policies (ALMP) pre‐ sented and based on the analysis of different approaches to evaluation of these policies conducted cost‐benefit analysis on the case of Serbia. The pa‐ per consists of four parts: The first part will describe a brief history of active policies in the world and review the literature on evaluation methodology. The second part presents the methodology used in the research in Serbia. The third section presents aggregate data on trends in the allocation of active measures. In the fourth part, based on the presented methodology we evalu‐ ate the effects of active measures in Serbia. Finally, we provide conclusions and recommendations for further research.
History
of
ALMP
and
review
of
evaluations
quence of World War I and great depression caused by the collapse of the New York stock exchange these measures were applied in two cycles of the
so called “NewDeal” in the U.S. Economic theorists of that time, led by Keynes
were engaged in development of the (un)employment theory and the ways on how to cope with labour market trends. By using the theory of multipliers, firstly introduced by Kahn (1931), Keynes (1936) had managed to oppose the claim that public works and government spending cannot solve the prob‐ lems in the labour market but that only cause inflation.
The active policies which are today called ALMPs were introduced for the first time after the Second World War and until today have gone through (at least) three development stages. The first stage begins after World War II, primarily in the Scandinavian countries, as an integral part of the model of economic and social change. At that time there was a need to set up systems that would reduce short‐term inflationary impact of higher employment lev‐ els, and at the same time help solve problems fast‐growing demand for la‐ bour (OECD, 1964, Barkin, 1967). Nickel et al (2001) showed that in the pe‐ riod from 1960 to 1980 there has been a significant shift to the right on the Beverage curve as a result of the initial measures, which resulted in better matching of vacancies with skills of unemployed persons. Similar analyses are presented in other papers (OECD 1993, Katz 1994, Calmfors 1994, etc.).
The second phase was initialized in France, Germany and the United States during the oil shock crisis in 1973‐1975 by introduction of new programs targeting labour supply, specifically vulnerable groups. Estevao (2003) and Betcherman (2004) pointed out that the constant increase in the unemploy‐ ment rate in the 1970s and 1980s assessed inter alia as a consequence of a mismatch in labour supply and demand. Unemployment level in OECD coun‐ tries grew from 3% in 1973 to 7% in 1988 (Martin, 2000). At the same time there was a significant growth on the supply‐side as a result of the emancipa‐ tion of women and young people who have entered the labour market. New active policies were generated to increase labour demand by creating jobs; alongside passive measures such as early retirement. The effects of these measures were short‐term and proved to be insufficient to curb rising un‐ employment in the long‐run.
strategies in transition countries in the form of public works or training pro‐ grams (OECD, 1990). Framework for the labour markets (OECD, 1990) claimed that structural defects were primarily on the supply side and that it was necessary to create medium and long term strategies to facilitate ad‐ justment. It was also recommended to redirect spending from passive to ac‐ tive measures. During the transition period, these measures have advanced from state to market‐oriented measures, but have not become part of a last‐ ing solution to risk management in the labour market, especially in countries in transition.
According to Harrell et al (1996), there are four basic types of evaluation performancemonitoring,impactevaluation,cost‐benefitanalysis and the pro‐ cessevaluation. Similarly Fay’s defines evaluation as consisting of three steps (Fay 1996) ‐ micro‐evaluation, macro‐evaluation and analysis on what is the best outcome that could be accomplished with available resources. Many other papers define methodological framework for the evaluation of the im‐ pact of ALMP (Dar and Tzannatos 1999, Daguerre, Etherington 2009, OECD 1993). For example, de Koning and Peers (2007) focus on assessing the net impact by using experiments or non‐experimental models (matching and econometric methods).
Martin (2000) divides the evaluation of individual programs into two basic groups. The first group measures the impact program participation on em‐ ployment and earnings after exit the program, by comparing participants’ results with the results of the control group. The second measure the net effect on the aggregate employment, taking into account externalities such as deadweight, substitution and displacement effects. Martin and Grubb (2001) make addition to this division so that the first group use micro data to meas‐ ure the impact of the program on employment and earnings of an individual, while the second use aggregate data to measure the net effects of programs on aggregate employment and unemployment.
Somewhat different division of the evaluations is offered by Spevacek (2009) and Fields (2007, p. 32). They identify six types of data analysis aimed at measuring and evaluations of the interventions in the labour market:
• Aggregate cross‐sectional quantitative data analysis • Cross‐sectional study of micro data analysis
• Panel data analysis
• Cross‐country time series analysis • Experimental studies
The first scientific papers on the evaluations, like Calmfors (1994) brought very confusing results. Development of information systems facilitated data analysis, and Lehman and Klueve (2010) claim that by improved research methodology, recent studies show that ALMPs do have the positive effect both on individual likelihood of exiting unemployment and on aggregate em‐ ployment growth, especially in developed countries.
While the first papers on the development of evaluation methodology were written in the United States, over the past fifteen years significantly in‐ creased the number of papers among researchers in Europe. In the transition countries of Central and Eastern Europe during last ten years also emerged several high‐quality studies on the impact of ALMPs. These studies have helped to better understanding of labour markets in the new economic envi‐ ronment (Lehmann, Klueve 2010). In transition countries, the available budgets for ALMP are very limited, and for that reason it is important that the effects are properly assessed in order to make the right distribution among different types of measures. Evaluations in transition countries in‐ clude several papers (Lehman, Klueve 2010, Ognjenovic (2007), Bonin, Rinne (2006); Betcherman, Olivas, Dar (2004); Spevacek (2009) and many others).
Methodology
in
cost
‐
benefit
analysis
As presented in the literature review, cost‐benefit analysis is one of the eval‐ uation approaches used to estimate effects of implemented policies on the labour market. Most evaluations using cost‐benefit analysis compare the cost of interventions on the labour market with the net gains of increased income
of newly employed persons. Cost-benefit analysis estimates and aggregates the
monetary equivalent of the present and future social costs and benefits, from the citizens’ point of view, for the public investment projects, in order to decide if
these are in the public interest (Monsteanu, Iacob 2008).
With the public investment in ALMP as a project, a government doesn’t aim to maximize the profit, as is the case of private sector’s investments, but to maximize the social welfare. According to Fields (2007, pg 41) the social rate of return to ALMP is found by subtracting the marginal social costs of ALMP from the marginal social benefits:
ts benefits
return PV PV
PV cos
(1)
or ....) ) 1 ( ) 1 ( ( ....) ) 1 ( ) 1 (
( 1 2 2
0 2
2 1
0
r C r C C r B r B B
PVreturn (2)
where Bt and Ct are the social benefits and social costs in year t, and r inter‐
nal rate of return.
However such investment projects need to have an efficient appraisal. Cost – benefit analysis allows allocating resources for a project entirely when we observe marginal social benefit as increased tax returns and the marginal social cost as the expenditure on ALMP increased for the opportunity cost.
In our model we equal the social opportunity costs as the value of the output that is not produced because it has been spent for ALMP. We also estimate this value as equal to returns on government bonds, which in the case of Ser‐ bia 2008 and 2009 was 9.61% and 10.34% respectively.
Hence, the equation 2 can be interpreted as:
)
*
(
expenditure GBtaxes
return
PT
PT
RR
PT
(3)where PTreturn are marginal tax returns, PTtaxes are tax returns gained from
increased national income by persons employed through ALMP, PTexpenditure
are cost of ALMP and RRGB is the rate of return on government bonds.
We assume that all persons, employed as a result of participation in any type of active labour market policy, are producing goods or services in the same amount as an average employee in the country. For that purpose we are us‐ ing statistical data on Gross Value Added and number of employed persons.
PE GVA
GVAApp Ag / (4)
where app stands for average per persons, ag for aggregate and PE for em‐
ployed persons
Gross value added per person needs to be discounted for the amount of aver‐
age rate of tax returns in national GVA (Tart) to obtain average tax returns per
ployed as a result of participation in ALMP (PEalmp) we obtain the amount of
tax returns received from the employed persons that participated in ALMP. Therefore our equation 3 may be expressed as:
)
*
(
)
*
*
(
app art almp expenditure GBreturn
GVA
T
PE
PT
RR
PT
(5)Since the value of GVA is significantly different in an economy depending on the business sector, we should divide our sample according to NACE rev. 2 classification. Therefore equation 5 becomes:
) * ( ) * * ( exp 21 1 GB enditure almp i art app i i
return GVA T PE PT RR
PT
(6)
where i is the business sector ranged from 1 to 21, in accordance to NACE
rev.2 classification (European Commission, 2008, p. 59)
There is also a difference in achieved results in number of employed persons depending on the type of ALMP used. For that reason there is a need to adapt our formula to:
) * ( ) * * ( exp 21 1 7 2 GB enditure almp ij art app ij i j
return GVA T PE PT RR
PT
(7)
in which j stands for type of LMP according to the official classification of the
EC (European Commission 2009).
Data
on
ALMP
Table1:ExpenditureonALMPinOECDcountries(%ofGDP)
1985 1990 1995 2000 2005 2008
Unweighted average 0.66 0.66 0.80 0.71 0.64 0.57
Source:adaptedonOECD(2011)
Economic reforms in countries with a centrally planned economy (transition economies) since the beginning of the nineties had significantly increased the level of open unemployment, and raised aggregate unemployment to above the EU‐15 average. For that reason, funds allocated for labour market poli‐ cies began to increase until the mid of the first decade of XXI century and slowly followed the diminishing trend of EU15 as of 2006, and then in aver‐ age rapidly increased in 2009.
Table2:ExpenditureonLMP(1‐7)inEUtransitioncountries(%ofGDP)
GEO/TIME 2005 2006 2007 2008 2009
EU 15 0.76 0.73 0.76 0.73 0.68
EU 10 transition countries* 0.27 0.27 0.24 0.23 0.37
Bulgaria 0.15 0.43 0.47 0.43 0.34
Czech Republic 0.30 0.26 0.25 0.26 0.25
Estonia 0.23 0.07 0.07 0.07 0.05
Latvia 0.07 0.26 0.22 0.26 0.17
Lithuania 0.13 0.27 0.22 0.27 0.32
Hungary 0.22 0.28 0.30 0.28 0.27
Poland 0.27 0.45 0.43 0.45 0.50
Romania 0.56 0.14 0.15 0.14 0.11
Slovenia 0.09 0.27 0.29 0.27 0.20
Slovakia 0.18 0.32 0.34 0.32 0.22
* unweighted average
Source:Eurostat(2011)
Table3:ExpenditureonALMPinSerbia
2005 2006 2007 2008 2009 2010 2011
million€ 8.9 15.5 29.4 34.6 36.8 36.6 55.6
%ofGDP 0.04% 0.07% 0.10% 0.11% 0.12% 0.12% 0.17%
Source:OwncalculationsbasedonMERR(2011)
In Serbia the active employment policy is regulated by the Law on Employ‐
ment and Insurance against Unemployment that refers to a system of plans, programs and measures aimed at increasing employment and reducing un‐ employment. Active labour market policy is financed by the State budget, the budget of the territorial autonomy and local self‐governments, donations, legacy, loans, as well as from the unemployment tax contributions and other sources. Budgetary funds are distributed to different types of measures, which are shown in Table 4.
Table4:DistributionofallocatedfundsforALMPbytypeofactivityinSerbia (000€)
Activity 2008 2009 2010 2011
Active job search 68.4 52.6 49.5 100.0
Training and education 92.0 15,736.8 20,742.6 18,900.0
Employment subsidies 17,643.7 7,368.4 8,910.9 13,000.0
Public works 8,160.9 13,684.2 6,930.7 7,000.0
Total 34,643.7 36,842.1 36,633.7 39,000.0
Source:MERR(2011)
Discussion
on
Empirical
Findings
in
Serbia
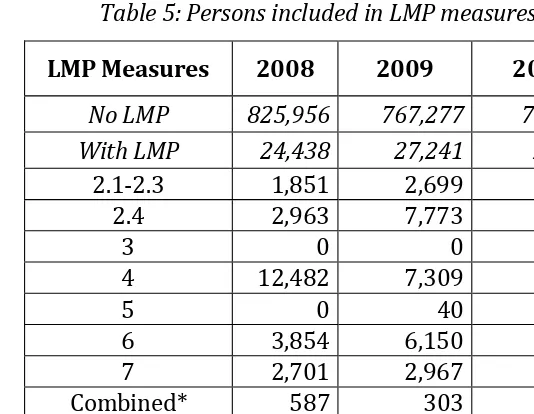
The data on the number of persons included in different types of LM measures according to the EC Methodology for the period 2008‐2010 are listed in table 5.
Table5:PersonsincludedinLMPmeasures
LMPMeasures 2008 2009 2010
NoLMP 825,956 767,277 794,016 WithLMP 24,438 27,241 23,262
2.1‐2.3 1,851 2,699 4,312
2.4 2,963 7,773 5,706
3 0 0 0
4 12,482 7,309 6,486
5 0 40 858
6 3,854 6,150 3,471
7 2,701 2,967 2,236
Combined* 587 303 193
Total 850,394 794,518 817,278
* Persons participating in over 1 measure
Further on we have summed expenditures for the groups of persons listed in table 6, by types of LM policies which are shown in table 6.
Table6:LMPexpenditures(in€)
LMPMeasures 2008 2009 2010
NoLMP 0 0 0
WithLMP 15,555,102 25,685,579 23,958,642
2.1‐2.3 297,558 495,211 2,459,720
2.4 655,615 9,944,044 7,663,284
3 0 0 0
4 8,224,734 4,859,086 4,900,848
5 0 42,015 723,827
6 3,525,069 7,940,810 4,922,759
7 2,286,840 2,008,454 2,960,905
Combined 565,285 395,959 327,300
[image:11.595.101.368.126.333.2] [image:11.595.79.388.383.574.2]Using methodology from the methodological section of this paper, we wanted to analyse the effectiveness of the funds spent for the LM measures. For that reason we have at first collected information on employment of people from our sample in two fold manner. For those who have not used any LM meas‐ ure we searched for number of people who have been employed during re‐ spective year and the number of days that they worked. For persons who have participated in LMP, we have collected information on the number of people and days working over the period of 12 months after entrance into the measure. Results are presented in table 7.
Table7:Employmentbynumberofpersonsandworkingdays
2008 2009
Persons
employed Daysworking
Persons
employed Daysworking
NoLMP 110,063 19,694,841 72,591 12,460,764 WithLMP 18,064 5,162,352 22,005 6,123,127
2.1‐2.3 663 131,108 611 98,488
2.4 1,944 561,328 7,592 2,363,666
3 0 0 0 0
4 10,841 3,561,978 6,895 2,287,067
5 0 0 15 2,076
6 3,651 606,593 6,051 1,087,727
7 509 150,542 559 196,223
Combined 456 150,803 282 87,880
Total 128,127 24,857,193 94,596 18,583,891
Table8:GrossvalueaddedandemployedpersonsinSerbia
GVA(€mil) Personsemployed
DailyGVAperper‐
son(€)
NACErev2.
classification 2008 2009 2008 2009 2008 2009
А 2729.6 2156.2 705981 622735 10.6 9.5
В 378.3 359.4 32387 26814 32.0 36.7
C 4294.8 3647.9 471836 442504 24.9 22.6
D 796.4 850.8 33980 33726 64.2 69.1
E 307.5 285.4 43541 42173 19.4 18.5
F 1444.7 1102.4 177454 136779 22.3 22.1
G 3193.0 2532.8 407541 361560 21.5 19.2
H 1408.1 1249.3 134587 128187 28.7 26.7
I 294.4 273.8 83867 73173 9.6 10.3
J 1219.9 1129.9 54716 52221 61.1 59.3
K 895.6 842.3 56577 54804 43.4 42.1
L 29.7 29.5 5494 3470 14.8 23.3
M 1297.3 958.6 55431 55254 64.1 47.5
N 485.3 389.5 28872 29109 46.1 36.7
O 1053.3 895.6 135724 128792 21.3 19.1
P 1319.0 1182.2 122528 153162 29.5 21.1
Q 1659.1 1485.3 170102 169961 26.7 23.9
R 269.7 346.6 34856 34801 21.2 27.3
S 278.8 373.9 58450 59323 13.1 17.3
T 29.9 24.4 6646 6792 12.3 9.9
U 0.0 0.0 1153 1098 0.0 0.0
Total 26320.5 23034.8 2821724 2616437 25.6 24.1
Source:OwncalculationsonofficialStatisticaldata
Using the data on GVA from table 8 and on days working from table 8 we have calculated the gross value added for persons from our initial sample who have been employed in the observed period, as mentioned above, which is shown in table 9.
and certain causalities and correlations have been calculated which will be presented in a final report.
Table9:GVAcreatedbypersonsemployedandLMPexpendituresfrominitial sample(in€)
2008 2009
GVA PT (Costs) GVA PT (Costs)
NoLMP 516,857,812 0 293,799,727 0
WithLMP 135,360,733 15,555,102 148,782,574 25,685,579
2.1‐2.3 3,842,014 297,558 2,339,061 495,211
2.4 20,315,424 655,615 82,728,073 9,944,044
3 0 0 0 0
4 105,054,996 8,224,734 67,549,250 4,859,086
5 0 0 47,868 42,015
6 16,223,994 3,525,069 28,321,547 7,940,810
7 5,604,580 2,286,840 4,183,297 2,008,454
Combined 4,843,740 565,285 2,428,750 395,959
Total 730,131,315 15,555,102 547,681,261 25,685,579
Finally by using the formula (7) we have obtained the following results, as shown in table 10.
Table10:Estimatedmarginalchangeintaxreturns(in€)
2008
GVA*T*PE PTexp*RR PTreturn
No LMP 227,417,437 0 227,417,437
With LMP 59,558,723 17,049,947 42,508,775
Total 286,976,160 17,049,947 269,926,212
2009
GVA*T*PE PTexp*RR PTreturn
No LMP 129,271,880 0 129,271,880
With LMP 65,464,333 28,153,963 37,310,369
In table 10 we may see that estimate growth of marginal tax returns in years 2008 and 2009, which was derived as a result of employment of people from our initial sample, is in total around €270 million and €166 million. For those figure to be more representative and to enable comparison of the estimates between those treated vs. others, we give the figure per person in table 11.
Table11:Estimatedmarginalchangeintaxreturnsperperson(in€)
2008 2009
NoLMP 275.3 168.5
WithLMP 2437.1 1369.6
Figures from table 11 prove that persons being treated by all types of ALMP provide very high net gains in tax returns on the yearly basis, which are 7‐8 times higher compared to those being registered unemployed, but not treat‐ ed by any type of ALMP.
Conclusion
and
recommendations
Active labour market policies are commonly used tool to fight unemploy‐ ment, especially in the periods of economic crises. They alone cannot solve the problem of high unemployment – they need to be part of a comprehen‐ sive strategy to tackle unemployment. However it is necessary to evaluate their effectiveness both in terms of social and economic gains. In this paper we have presented a modified approach to cost‐benefit analysis of ALMP as the investments made by a government.
Preliminary results of empirical research in Serbia show very positive re‐ sults, indicating that especially in the period of crisis when there is very low number of job vacancies, active measures can significantly improve labour market conditions, thus create high levels of return to investments (taking ALMP as an investment). Directing more funds towards active measures would help mitigate the negative effects of the economic crisis.
[image:15.595.78.391.145.206.2]level of deadweight, substitution effects and displacement effects to make results more robust.
References
1. Baily, M., and J. Tobin (1977) Macroeconomic Effects of Selective Public Employment and
Wage Subsidies, BrookingPapersonEconomicActivityVol. 1977, No. 2, pp. 511‐544
2. Barkin S (1967) Meeting the demands of an active manpower policy with the assistance of the academic disciplines, De Economist, Vol 115, Issue 6, Springer Netherlands 3. Betcherman, G., Olivas, K., Dar, A. (2004), Impact of Active Labour Market Programs: New
Evidence from Evaluations with Particular Attention to Developing and Transition Coun‐ tries, SocialProtectionDisscusionPaperSeries0402, the World Bank, januar 2004.
4. Boeri, T., Ours, J. (2008), “Active Labour Market Policies”, in TheEconomicsofImperfect LabourMarkets, Princenton Univeristy Press,
http://press.princeton.edu/chapters/s12_8771.pdf
5. Bonin, H., Rinne, U. (2006), Evaluation of the Active Labour Market Program Beautiful Serbia, IZADiscussionPaper2533
6. Bonoli, G. (2010), The Political Economy of Active Labour Market Policy, WorkingPapers ontheReconciliationofWorkandWelfareinEurope01, RECWOWE Publication, Dissemi‐
nation and Dialogue Centre, Edinburgh.
7. Calmfors, L. (1994), Active Labour Market Policy and Unemployment: a Framework for the Analysis of Crucial Design Features, OECD Economic Studies 22, summer 1994. 8. Calmfors, L, Forslund A, Hemstrom M (2002) Doesactivelabourmarketpolicywork?Les‐
sonsfromSweedishexperiences, Sweedish Economic Policy Review 8 (2), pp. 61‐124
9. Dar A, Tzannatos Z (1999) Active labour market programs: A review of the evidence from Evaluations, Working paper, World Bank, (accessed 12.02.2011)
http://rru.worldbank.org/documents/toolkits/labour/toolkit/pdf/reference/Dar_Tzann atos_1999_854C0.pdf
10. Daguerre, A., Etherington, D. (2009), Active Labour Market Policies in International Con‐ text: What Works Best? Lessons for the UK, Department for Work and Pensions, Working Paper59.
11. Estevão M (2003) DoActiveLabourMarketPoliciesIncreaseEmployment?,International Monetary Fund (IMF) Working Paper 03/234. Washington, DC: IMF. available at: http://www.imf.org/external/pubs/ft/wp/2003/wp03234.pdf (accessed 12.05.2011.) 12. European Commission (2010), Europe2020:Europeanstrategyforsmart,sustainableand
inclusivegrowth ‐
http://eunec.vlor.be/detail_bestanden/doc014%20Europe%202020.pdf (accessed 14.01.2011)
13. European Commission (2009), Addendumtothe2006LMPMethodology, March 2009, Office for Official Publications of the European Communities, Luxembourg.
http://epp.eurostat.ec.europa.eu/portal/page/portal/labour_market/documents/Adden dum_2006_LMP_EN.pdf (accessed 16.04.2011)
14. European Commission (2008) StatisticalclassificationofeconomicactivitiesintheEuro‐ peanCommunity, available at: http://epp.eurostat.ec.europa.eu/cache/ITY_OFFPUB/KS‐ RA‐07‐015/EN/KS‐RA‐07‐015‐EN.PDF
16. European Commission (1993), Growth,Competitiveness,andEmployment:TheChallenges andWaysForwardintothe21stCentury, White Paper, Office of Official Publications of the
European Commission, Luxembourg.
http://www.ena.lu/commission_white_paper_growth_competitiveness_employment_199 3‐2‐10799 (accessed 14.05.2011)
17. Eurostat on‐line database:
http://epp.eurostat.ec.europa.eu/portal/page/portal/statistics/search_database (ac‐ cessed 11.05.2011)
18. Eurostat (2011) On‐line database on labour market policies, available at:
http://epp.eurostat.ec.europa.eu/portal/page/portal/labour_market/labour_market_poli cy/database (accessed 12.05.2011)
19. Fay, R. (1996): Enhancing the Effectiveness of Active Labour Market Policies: Evidence from Programme Evaluations in OECD Countries, Labour Market and Social Policy Occa‐ sional Papers, OECD.
20. Fields G.S. (2007) Labour Market Policy in Developing Countries: A Selective Review of the Literature and Needs for the Future, Policy Research Working Paper Series, No. 4362. Washington, DC: World Bank.
21. Greenberg DH, Michalopoulos C, Robins PK (2003) AMeta‐AnalysisofGovernment‐ SponzoredTrainingPrograms, Industrial and Labour Relations Review 57 (1), pp. 31‐53 22. Harrell, A., Burt, M., Hatry, H., Rossman, S., Roth, J., Sabol, W. (1996). Evaluationstrategies
forhumanservicesprograms:Aguideforpolicymakersandproviders. Washington, DC: The Urban Institute.
23. Hujer R, Caliendo M, Zeiss Ch, Blien U (2002) Macroeconometricevaluationofactivela‐ bourmarketpoliciesinGermany ‐ adynamicpanelapproachusingregionaldata, ERSA conference papers ersa02p225, European Regional Science Association
24. de Koning J, Peers Y (2007) EvaluatingALMPevaluations, SEOR Working Paper No.
2007/2, Rotterdam
25. Kahn R.F. (1931) The Relation of Home Investment to Unemployment, EconomicJournal,
June 1931
26. Keynes J.M. (1936) TheGeneralTheoryofEmployment,InterestandMoney Macmillan Cambridge University Press, for Royal Economic Society in 1936; available at: http://www.marxists.org/reference/subject/economics/keynes/general‐ theory/index.htm (accessed 12.05.2011.)
27. Kluve J (2010) TheeffectivenessofEruopeanALMP, Labour Economics, doi: 10.1016/j.labeco.2010.02.004
28. Kuddo, A. (2009), Employment Services and Active Labour Market Programs in Eastern European and Central Asian Countries, SocialProtectionDisscusionPaper0918, the World
Bank, oktobar 2009.
29. Lehmann, H., Kluve, J. (2010), Assessing Active Labour Market Policies in Transitional Economies in TheLabourMarketImpactoftheEUEnlargement, Caroleo, F.E., Pastore, F. (eds.), Springer‐Verlag Berlin Heidelberg, pp. 275‐307
30. Martin, J.P i Grubb D (2001) What works and for whom: a review of OECD countries’ experience with active labour policies, Swedish Economic Policy Review 8 (2001) 9‐56 31. Martin, J.P. (2000), What Works Among Active Labour Market Policies: Evidence from
OECD Countries’ Experiences, OECDEconomicStudies3, OECD Publishing.
32. MERR (2011) Nationalactionplanofemploymentfor2011, Ministry of economy and regional development of Serbia
33. Mosteanu T, Iacob M (2008) TheoriesAndApproachesRegardingTheCost‐BenefitAnalysis RoleAndPrinciples, Theoretical and Applied Economics, Asociatia Generala a Economisti‐
34. Nickell S, Nunziata L, Ochel W., Quintini G. (2001) TheBeveridgecurve,unemploymentand wagesintheOECDfromthe1960stothe1990s ‐ preliminaryversion. CEPDP, 502. Centre
for Economic Performance, London School of Economics and Political Science, London, UK.
35. OECD (2011) on‐line data base on public expenditure for active labour market policies, available at: http://stats.oecd.org/Index.aspx?DatasetCode=LMPEXP
http://stats.oecd.org/Index.aspx?DatasetCode=LMPEXP (accessed 22.02.2011) 36. OECD on‐line database on Labour market policies.
http://stats.oecd.org/Index.aspx?DatasetCode=LMPEXP
37. OECD (2010), OECD Employment Outlook 2010: Moving Beyond the Jobs Crisis, OECD: Pariz.
38. OECD (2008) Serbia: A Labour Market in Transition, OECD: Paris
39. OECD (1993) ActiveLabourMarketPolicies: AssessingMacroeconomicandMicroeconomic Effects,chapter 2, pp. 39‐79,inEmployment Outlook, OECD: Paris.
40. OECD (1990) Labour Market Policies for the 1990s, OECD, Paris.
41. OECD (1964),“Recommendation of the Council on Manpower Policy as a Means for the Promotion of Economic Growth”, OECD,Paris.
42. Ognjenović, K. (2007), The Use of Propensity Score‐Matching Methods in Evaluation of Active Labour Market Programs in Serbia, EconomicAnnals52(172), pp. 21‐53, Faculty of Economics, Belgrade.
43. Robinson, P. (2000), Active Labour‐Market Policies: a Case of Evidence‐Based Policy‐ Making?, OxfordReviewofEconomicPolicy16(1), pp. 13‐26.
44. Schömann, K. (1995), Active Labour Market Policy, Wissenschaftszentrum, Discussion PaperFSI95‐201, Berlin. http://bibliothek.wz‐berlin.de/pdf/1995/i95‐201.pdf. 45. Spevacek AM (2009) Effectiveness of Active Labour Market Programs: A review of Pro‐
grams in CEE and CIS, USAID knowledge service centre
46. Tobin, J., Baily, M.N. (1977) Macroeconomic effects of selective public employment and wage subsidies. BrookingsPapersonEconomicActivity, No. . 2
47. World Bank (2006), Republic of Serbia: Assessment of Labour Market, Report No. 36576‐ YU, Washington D.C.
48. Zubović J (2010) Razvoj privrede zasnovan na ulaganjima u ljudske resurse i stranim investicijama, Institut ekonomskih nauka, Belgrade, pp. 39‐57
49. Zubović J, Hanić A (2009) Recruitment practices in Serbian Financial Sector ‐ Employee Referrals and Cooperation with Educational Institutions, Internationall Tempus confer‐ ence BusinessOpportunitiesinSerbia:theCaseofItalianBusiness, BBA and IEN, Belgrade, June 2009.