PfâSfl
ñ
REPRINT
:"ìFÌih
¿''-lì
¡mss«
WW
$Äi
il
EUROPEAN ATOMIC ENERGY COMMUNITY EURATOM
•«it
Γ»ΗΗ
w
m
m
iipl
Í ^ N
Il 19»!
.JS ΙΙΕΒΕΛΙΕ
CARBON TRANSPORT
' KHft
!3ft
Í|K*5¡SÍ;
Kiitti * l i
Aí*
røSl
u*>
MWbBT
m
tni
ϋβΤΗΒ
íjrrfe
ïiV:
U*
tf
"jut
i
Wíl
WH
im
m
'.'.•-If M
¡b#!'¡
i%3HK!ä
Wil
■
is
m«
¡Wla'l
w-':i
SA*fi!»¡
íi"^«i»»i!Í!®
J'í «rt
¡■ae
1964
H
5^.1
N<W
S A W I Ëm
m
'ÊM
EU
¡foçai?y
liÛîhi:
¡^:&i
Iffl
■"< »a
nui
iï*»
S
«rift
1AGON PROJECT
Reprinted from
DE INGENIEUR
«IIP
3 "il
îl
iMl»!
Vol. 75, No. 11 - 1963
I
o- - Make a n y w a r r a n t y or representation, express or implied, with respect t o t h e accuracy,
■SPI
This document was prepared under t h e sponsorship of t h e Commission of t h e European
Atomic E n e r g y Community (EURATOM).
Neither t h e E U R A T O M Commission, its contractors nor a n y person acting on their behalf :
■*Ci
completeness, or usefulness of t h e information contained in this document, or t h a t t h e use
of a n y information, a p p a r a t u s , m e t h o d , or process disclosed in this document m a y not
infringe privately owned rights; or
2° — Assume a n y liability with respect t o t h e use of, or for damages resulting from t h e use of
a n y information, a p p a r a t u s , m e t h o d or process disclosed in this document.
:
ΜΙΐΚ'ΤΠϋί^¡■Ρβ
ΐΊ
Wvmm,
This reprint is intended for restricted distribution only. It reproduces,
by kind permission of the publisher, an article from "DE
INGENIEUR", Vol. 75, No. 11 - 1963 - 39-49. For further copies
please apply to Koninklijk Instituut van Ingenieurs - 23,
Princesse-[UI
gracht - s' Gravenhage (The Netherlands).
Dieser Sonderdruck ist
für eine beschränkte Verteilung bestimmt. Die
Wiedergabe des vorliegenden in „DE INGENIEUR", Vol. 75, Nr. 11
-1963 - 39-49 erschienenen Aufsatzes erfolgt mit freundlicher
Genehmi-gung des Herausgebers. Bestellungen weiterer Exemplare sind an
Koninklijk Instituut van Ingenieurs - 23, Princesse gracht - s'
Graven-hage (The Netherlands), zu richten.
Ce tiré-à-part est exclusivement destiné à une diffusion restreinte. Il
reprend, avec l'aimable autorisation de l'éditeur, tin article publié dans
«DE INGENIEUR», Vol. 75,
2V°
11 - 1963 - 39-49. Tout autre
exemplaire de cet article doit être demandé à Koninklijk Instituut van
Ingenieurs - 23, Princessegracht
-
s' Gravenhage (The Netherlands).
Questo estratto è destinato esclusivamente ad tina diffusione limitata.
Esso è stato riprodotto, per gentile concessione dell'Editore, da «DE
INGENIEUR», Vol. 75, N° 11 - 1963
-
39-49. Ulteriori copie
del-l'articolo debbono essere richieste a Koninklijk Instituut van
Ingenieurs-23, Princessegracht - s' Gravenhage (The Netherlands).
EUR 516.e
REPRINT
CARBON TRANSPORT by LJ. VALETTE.
European Atomic Energy Community - EURATOM. DRAGON P R O J E C T .
Reprinted from " D E I N G E N I E U R " - Vol. 75, No. 11 - 1963 - pp. 39-49.
The problem of Carbon Transport is defined as the combined removal of graphite from the hot core of the reactor and the back deposition of carbon on metallic components at lower temperature. This Carbon Transport is the result of temperature reversible reactions which occur between reactor materials and the impurities present in the coolant helium.
A brief survey is made of the important variables affecting the Carbon Transport process; which are oxidation, carbon deposition, purification, in-leakage, and outgassing of gaseous impurities.
Based on the information available in literature it is shown that the extend of oxidation of graphite is governed by three single processes, the chemical reaction rate, the diffusion of the impurities in the graphite pores, and diffusion
EUR 516.e
R E P R I N T
CARBON TRANSPORT by L.J. VALETTE.
European Atomic Energy Community - EURATOM. DRAGON PROJECT.
Reprinted from " D E I N G E N I E U R " - Vol. 75, No. 11 - 1963 - pp. 39-49. The problem of Carbon Transport is defined as the combined removal of graphite from the hot core of the reactor and the back deposition of carbon on metallic components at lower temperature. This Carbon Transport is the result of temperature reversible reactions which occur between reactor materials and the impurities present in the coolant helium.
A brief survey is made of the important variables affecting the Carbon Transport process; which are oxidation, carbon deposition, purification, in-leakage, and outgassing of gaseous impurities.
Based on the information available in literature it is shown t h a t the extend of oxidation of graphite is governed by three single processes, the chemical reaction rate, the diffusion of the impurities in the graphite pores, and diffusion
EUR 516.e
R E P R I N T
CARBON TRANSPORT by L.J. VALETTE.
European Atomic Energy Community - EURATOM. DRAGON PROJECT.
Reprinted from " D E I N G E N I E U R " - Vol. 75, No. Π - 1963 - pp. 39-49.
The problem of Carbon Transport is defined as the combined removal of graphite from the hot core of the reactor and the back deposition of carbon on metallic components at lower temperature. This Carbon Transport is the result of temperature reversible reactions which occur between reactor materials and the impurities present in the coolant helium.
A brief survey is made of the important variables affecting the Carbon Transport process; which are oxidation, carbon deposition, purification, in-leakage, and outgassing of gaseous impurities.
of the impurities from the main coolant to the graphite surface. Each of these processes becomes preponderant in different temperature ranges.
In the second part of the paper "some· aspects of the corrosion of Dragon fuel element components are discussed. Due to the temperature dependence of the reaction it is shown t h a t corrosion along the fuel rod will be unevenly distributed and due to the high coolant flow, the depletion of impurities along these rods is negligible. On the other hand, in the purge channel the rate of depletion of impurities is very much more pronounced, due to the small flow and the high graphite temperature. The calculations show that the top fuel boxes will be very severely damaged on a short distance.
Finally, in order to prevent this last danger it is proposed to insert a get er for the impurities in the inlet purge flow.
of the impurities from the main coolant to the graphite surface. Each of these processes becomes preponderant in different temperature ranges.
In the second part of the paper some aspects of the corrosion of Dragon fuel element components are discussed. Due to the temperature dependence of the reaction it is shown t h a t corrosion along the fuel rod will be unevenly distributed and due to the high coolant flow, the depletion of impurities along these rods is negligible. On the other hand, in the purge channel the rate of depletion of impurities is very much more pronounced, due to the small flow and the high graphite temperature. The calculations show t h a t the top fuel boxes will be very severely damaged on a short distance.
Finally, in order to prevent this last danger it is proposed to insert a getter for the impurities in the inlet purge flow.
of the impurities from the main coolant to the graphite surface. Each of these processes becomes preponderant in different temperature ranges.
In the second part of the paper some aspects of the corrosion of Dragon fuel clement components are discussed. Due to the temperature dependence of the reaction it is shown that corrosion along the fuel rod will be unevenly distributed and due to the high coolant flow, the depletion of impurities along these rods is negligible. On the other hand, in the purge channel the rate of depletion of impurities is very much more pronounced, due to the small flow and the high graphite temperature. The calculations show that the top fuel boxes will be very severely damaged on a short distance.
T h e Dragon Project
1
)
V I . Carbon Transport
by L. J. V a l e t t e , (Belgium). Research & Development Division, Dragon Project. Chemistry Branch. Group Leader of the section Mass Transfer Studies
621.039.524.2
Summary: The problem of Carbon Transport is defined as the combined removal of graphite from the hot core of the reactor and the back deposition of carbon on metallic components at lower temperature. This Carbon Transport is the result of tempe rature reversible reactions which occur between reactor materials and the impurities present in the coolant helium.
A brief survey is made of the important variables affecting the Carbon Transport process ; which are oxidation, carbon deposition, purification, inleakage, and outgassing of gaseous impurities.
Based on the information available in literature it is shown that the extend of oxidation of graphite is governed by three single processes, the chemical reaction rate, the diffusion of the impurities in the graphite pores, and diffusion of the impurities from the main coolant to the graphite surface. Each of these processes becomes preponderant in different temperature ranges.
In the second part of the paper some aspects of the corrosion of Dragon fuel element components are discussed. Due to the temperature dependence of the reaction it is shown that corrosion along the fuel rod will be unevenly distributed and due to the high coolant flow, the depletion of impurities along these rods is negligible. On the other hand, in the purge channel the rate of depletion of impurities is very much more pronounced, due to the small flow and the high graphite temperature. The calculations show that the top fuel boxes will be very severely damaged on a short distance.
Finally, in order to prevent this last danger it is proposed to insert a getter for the impurities in the inlet purge flow.
1. Introduction
In the D r a g o n Reactor, Carbon Transport may result from the combined effect of corrosion of high temperature gra phite in the core and back deposition of the carbon on me tallic surfaces at a lower temperature. Transport of carbon may thus occur by reversible temperature dependent reac
') Voordrachten gehouden voor de Afdeling voor Kerntechniek van het K. I. v. I., in samenwerking met het Reactor Centrum Nederland en het Ned. Atoomforum, op 6 april 1962 te 's Graven hage. Zie De Ingenieur 1962 Nr. 12 biz. A 180.
tions with gaseous impurities such as O,, H2, C03 and CO
present in the circuit at the vpm levels.
The thermodynamically possible reactions at D r a g o n operating temperatures are listed below: [1]
c +
o
22C + O,
C
+CO.,
C + Η,Ο
C + 2H
22C + 2Η.,0
2C + Ν, + Η.,
CO + 3Η,
CO + Η,Ο
->
co
2> ICO
(D
(2)
ICO (3)
CO + Η., (4)
CH4 (5)
CH4 + CO, (6)
2HCN (7)
CHá Η,Ο (8)
CO, -f Η, (9) We consider here mainly the kinetic region of the reactions, because, although thermodynamically possible, the reactions must start at a sufficiently high rate for the carbon transport process to be significant.
The final objective of the research programme is to specify the impurity level admissible.
2. Variables affecting Carbon Transport in a Reactor System
To be of any importance in an H.T.G.C.R. the chemical reac tions must as already stated, start at a significant speed. The
speed of reaction is dependent on the level of impurity and the nature of impurity in the system.
The level of impurities will depend on their rates of puri fication and in-leakage. The equilibrium ratio between the graphite oxidising impurities and their by-products will depend on the rate οι combustion of graphite and the rate of regenera tion of the oxidant by carbon deposition, respectively.
2.1 Oxidation of Graphite
Extensive work has been so far done on the oxidation of graphite and carbon. Although the results are not directly applicable to a reactor system, is has been clearly established that the heterogeneous reaction with a porous graphite may be controlled by three main processes: fig. 1.
The chemical reaction rate
In-pore Diffusion in the pores giving access to the internal reacting surfaces.
Diffusion in the gaseous boundary layer surrounding the
graphite.
« %
lc,
i/t : c?
I'ig, 1. The three zones of the reaction rate in a porous graphite v.s. temperature.
< Ί
e
li 3 ;
C2
3 ι—
. _
-" Q fe
j
1
1
■+■-/ ■+■-/
0 200 300
- j - y / ζ
/
___-^
¿90 5. 11
..../
10 1 ATMS
IÍC
f / Ked UTHS Rs 2000 ; / / K'L
,
'/ /
1
_.__
0 60
1 "
/ i / ...
/
/
/ J/
'
so 5,
0 ?i
r
60 'S
~ - ^ ! ir,
-~ί—ι
Sc ¡¿OATHS K ed I 20 ATMS Re 15000
20
¡/ , > ?o ATMS R. ?nnn
\ "CU , - ■ - " S
Ό SOO 900 mo
fig. 2. Mass transfer coefficient K,.r!. Schmidt No. Sc and
diffusivity of CO, in He against lemperature.
Figure 1 represents the three zones of the porous carbon reaction rate versus temperature [2].
In a reactor system, in addition to these three processes, it is necessary to consider the enhancement of the reactions
by:-The in-pile radiation effect on graphite
2.1.1 Chemical reaction rate
At the lower temperature, when the whole internal surface of the graphite is accessible to the concentration Cg the combustion rate is purely dependent on the chemical me chanism of the reaction. The rate of combustion per unit external surface can be expressed
by:-k C"" S
reaction rate constant per unit B.E.T. surface γ = concentration of oxidants in the gas
= B.E.T. surface of the sample = order of reaction
= external surface of the sample
xp = rate per unit external surface
The chemical rate constant is related to the temperature by the Arrhenius equation
:-E/RT Q S n s A'„
k k\-„e
The object of kinetic measurements is to study the order of the reaction (exponent /;), and to determine the fre quency factor kso and the activation energy E. These values
depend on the gaseous reactant, and the quality of the graphite (purity and structure).
2.1.2 In-pore Diffusion
At higher temperatures there is aconccntration gradient in the porous material.
In this zone the reaction rate per unit area of external surface proceeds with an apparent activation energy of half the true value. A mathematical model of a porous material indicates that, in the in-pore diffusion controlled zone, the reaction rate is given, for a first order chemical reaction by:-[3]
k.
1 A.· M
Deff. 0. 2 (10)0 = porosity of the sample
Deff = effective diffusivity of the impurities in the pores r — the mean pore radius
-EI2RT It can be seen from this equation that kcrp -f- e
which gives an activation energy of half that of the chemical rate.
It can also be seen that in this zone the rate is dependent on the texture of the graphite (0, 7% Deff etc).
2.1.3 Diffusion in the Gas Phase
At higher temperature when the chemical reaction rate is very high, the rate determining step becomes the diffusion of oxidising impurities in the boundary layer.
In this zone the reaction rate is expected to be indepen dent of the temperature, but in general a small activation energy is measured.
Ultimately, at very high temperatures the rate of reaction can be expressed as the rate of mass transfer of reactants through the boundary layer.
This can be expressed as follows for a first order reaction :
ks s. Cw = kc (Cg-Cw). s (1)
ks = chemical reaction rate constant cm/s
s = geometrical surface area cm2
Cg = concentration of impurities in the main gas
stream mole/cm3
kc = rate of mass transfer cm/sec
Cw = concentration of impurities on the wall of the reacting graphite mole/cm3
x = 0
dS dx
<*(%M
Fig. 3. Cylindrical channel with an axial flow.
£ _ _
c+($)«
The concentration at the surface can be calculated from equation (1)
Ar,
C„ C„
ks + k0
The speed of reaction is then
r a t e = k«. C„
(*. +
k
c)
It can easily be seen that if kc > > ks then
the rate = ks Crj s, as for a normal chemical reaction, if ks > > Arc
rate = kc Cg s, the reaction rate is only dependent on the rate of mass transfer.
Calculation ofkc
for a laminer flow one can write : rate = Ca. Dlô. s kc = D/ò D is the Diffusion Coëfficiënt
Ô - is the thickness of the boundary layer.
F o r a turbulant flow the following equation based on R e analogy gives the kc
kc d
D
0.83 0.44
0.023 Re Sc (4)
Re Sc
Reynolds Number Schmidt N u m b e r
μ Kinetic Viscosity
ρ D Diffusion coef.
Fig. 2 summarises some calculations of
(D for 1 and 20 atm Í 2,000
of CO, in He (kc for 1 and 20 atm and Re
(Sc ( 15,000
The chemical reaction rate corresponding to the specified material for Dragon is also known (See fig. 6 line (2) of D.P.R. 102).
Using this data it can be seen that with the surface tempe rature of 1,300°C, Re = 15,000, Ρ = 20 atm and Heat 750° C :
C, 25.4
25.4 + 8.1 C C 0.758 C,,
pig. 4. Annular channel.
Thus the concentration gradient in the boundary layer is detectable but négligeable under these conditions.
At higher temperatures and with more reactive graphite and lower Re this would not be the case.
For instance, it can be seen that with a gas flow at 600°C 20 atmosphere and Re = 2000 with the specified graphite at 1300° C, C! C= 0 . 2 C3. If the graphite used is ten times more
reactive then C„, = 0.024 C„. This calculation indicates that mass transfer process is not négligeable in the H.T.G.R.
2.1.4 In-pile Radiation Effect on Graphite Oxidation
The intense radiation present in a nuclear reactor may lead to chemical reaction which would not otherwise occur. The types radiation which can effect the reactivity of graphite with gaseous reactants are principally gamma rays and fast neutrons.
Mass transport can be affected by inpile radiation either by changing the rate of gasification of graphite or changing the rate of deposition of carbon.
[image:7.595.284.553.43.461.2] [image:7.595.12.216.475.741.2]2.1.4.1 Activation of the reaction rate by creating active sites on the graphite surface. The radiation of graphite with fast neutrons will give rise to localised defects:
Atomic Displacement: The radiation of graphite by high ener gy fast neutrons results in displacement of atoms in the lattice. The imperfections created in the lattice such as interstitial, lattice vacancies, or cluster of both and dislocation which act as active sites for the gasification reactions [5].
Thermal Spikes: A fast neutron will dissipate its energy in
a very small volume of graphite. This region includes 5000 to 10,000 atoms and the localised Τ may rise by (700° C to 1200°C) for a period of l O-^ sec. The very rapid cooling resulting
[image:8.595.30.298.212.754.2]from the dissipation of heat in the surrounding material
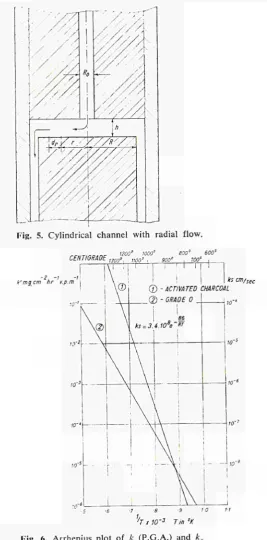
Fig. 5. Cylindrical channel with radial flow.
1200° woo' eoo' eoo' CENTIGRADE ,J t w»i ,,00« , 900° , ?QQ' -2, -! -I
k'mgcm hr v.p.m ks cm/sec
Τ χ 10'3 Tin °K
Fig. 6. Arrhenius plot of k (P.G.A.) and k^ (activated charcoal).
results in freezing of the disturbed lattice, since there is not sufficient time for all the atoms to be relocated in their equilibrium position. This disturbed lattice can act as an active site for the gasification reactions [6].
Catalytic Impurities: The basis of another explanation of in crease in carbon gasification under radiation could be the transmutation of impurities present in the graphite into highly catalytic impurities. This explanation although pos sible has not been confirmed.
2.1.4.2 Creation of Active Gaseous Particles in the Coolant It is generally accepted 'in the British Reactor School' that the enhanced increase in the reaction rate of (C02, H2,
02) with graphite is principally due to the creation of active
gaseous species. This was an unexpected result because it was known that the major radiation energy absorption would occur in the graphite and not in the gas, but the experiments performed have shown that the accelerating effect of the reaction is mainly caused by the fraction of energy absorbed in the gaseous phase. Radiation produces new reactants by passing through intermediate species like atomic particles, ionised or excited molecules.
The rate of formation of new particles is a function of the energy absorbed in the gas. The degree of energy absorption depends on
The Reactor flux: its intensity in gamma and fast neu
tron distribution
G value: which is known approximately for pure gases like
C02, and CO, but this may be affected by the presence of a
carrier gas.
The mass of gas: submitted to radiation is also influencing the formation of new compounds. The effect of pressure is directly connected to the influence on the mass radiation. The life time of the activated species is variable, conse quently the steady state concentration of these species will be dependent on
-- Decay time of species - Velocity of the gas - Geometry of the system
An extrapolation from an in-pile test to a reactor system with different
-- Gas to graphite ratio - Geometrical arrangement - Velocity distribution - Mass transfer rates, etc. is difficult.
Temperature has no marked effect on the radiation induced reactions.
2.2 Carbon Deposition
As indicated in the definition of carbon transport the over all carbon transport process is due to reversible reactions. The most important reaction to be considered is the reverse of reactions (1) and (4) for C deposition.
Carbon deposition is catalysed by metallic surfaces such as Fe and Ni. The catalysis is enhanced by trace amounts of H2. The reaction is strongly temperature dependent and
reaches its maximum around 500° C to 600° C.
It is obvious that if back deposition'was to be inhibited the balance of concentration of the impurities in a leak tight system would be displaced and the graphite corrosion would stop by lack of oxidising impurities.
PRESSURE ROD
FUEL ROD ~
FUEL BOX
SECTION 'A A'
Fig. 7. Dragon purge flow inlet.
In the literature it is also reported that gaseous inhibitants such as H, S and S02 can be used.
2.3 Clean-up Rate and Inleakage
The balance of impurities present in the reactor will depend on the sources and sink of impurities.
The sources of impurities are:
The degassing of the components :
This sources, although not insignificant, due to the large amount of graphite and steel, is only temporary. It has to be considered at the startup of the reactor.
The in-leakage rate :
Introduces impurities continuously from outside and there fore is more significant in time. In the Dragon reactor this source of impurity is unlikely because the steam in the heat exchangers is at a lower pressure than the primary circuit.
However, for a power reactor, the problem will be com pletely different and a figure of 5lb/day steam inleakage is estimated for a 1000 M W reactor.
The Sink for Impurities is the Purification Plant
The gas purification rate of the primary circuit helium will also effect the level of impurity present in the system.
This factor cannot be enlarged at will, for economical reasons.
3. The Corrosion of Graphite in Dragon and the Depletion of Reactants
In a helium stream containing CO,, flowing over a graphite surface at high temperature, there is a depletion of the oxidant concomitant to the corrosion of the graphite surfaces. The depletion depends on corrosion rates, the geometry of the system, and the flow rate.
Equations for various geometrical arrangements of the reacting graphite are established and calculations made for depletion rates in the purge and in the main flow assuming that the graphite has a reactivity similar to that of G r a d e
O. The depletion rate calculation takes its full significance in the purge flow. It can be seen that a 5 vpm impurity level in the purge flow corresponds to ~ 15 g graphite removed from each fuel rod for a three years of reactor operation. Unfortunately it is incorrect to assume that the corrosion would be uniformly spread over the ten fuel boxes contained in a fuel rod. In actual fact, the reaction may be confined to the first centimeter of the first fuel box, causing very deep corrosion and possibly penetration. Apart from in this region, the corrosion will be negligible due to the depletion of the oxidants.
The distribution of corrosion and the rate of depletion of oxidants, based on the available temperature distribution curves [9] are considered below.
3.1 Establishment of the Equations
3.1.1
Consider the channel represented in Figure 3, in which we have:
C the CO, concentration at the distance κ
mole/cm:ì
Table 1. D a t a for k / Q applicable
1 2 3
to the purge flow.
4 5 10
k'
■^g ctn . A . vpm
3-2 χ 10~3
2-0 χ 10~3
1-3 χ 10'3
6-6x 10~4
3-4 χ 10'4
1-6 χ 10~4
10 χ 10'4
1-8 χ 10~5
25x 10~6
k*
mg cm h' vpm
ai 20 arm.
5-42 χ IO'2
3-39 χ 10'2
2-20 χ 10'2
112 χ 10'2
5-76 χ 10'3
2-71 χ 10~3
1-70 χ 10'J
306 χ 10~4
4-25 χ 10'5
(ï) χ 16-95 k cm./s
810 4-60 2 62
1-52 ■752 ■339 ■206 0363 -0043 k/Q ■166 ■104 0673 0343 ■0176 ■ 00830 ■00521 ■000937 ■00013
( D χ 3 062
TT D k/Q
2-317 1-451 ■939 ■479 ■2456 ■1158 0727 0131 ■0018
ø r 13-955
TtD/Qlkl+kl
3-256 1930 1-185 ■5948 ■3183 ■0858 0149
® * @
XQ.C 1 cm. 1 ■2128 ■3591 ■5848 1-1651 2-1772 8-0770 46-5
• 693 ~ ©
'001lcm'
1-416 2 383 3 890 7-751 14-483
53-613 310-00
4-61 -r ( ?
ï ; c
f i
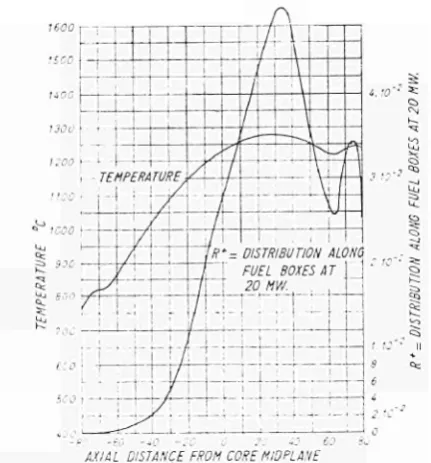
AXIAL DISTANCE FROM COREHIDPLANE
Fig. 8. Axial temperature k* distribution fuel boxes at 20 MW.
along
C ÖC
v V k
mole/cm:!
the CO, concentration at the distance κ = o
mole/cm3
the velocity of the gas cm/s the volume of the reactor" cm3
the reaction rate per unit external area of gra phite
Q the volumetric flow of carrier gas s cross section perpendicular to the flow
dS reacting surface along the άκ distance
Pe perimeter
If the mass balance of reactant between section κ and section κ -f άκ is considered; we equate the rate of variation of concentration to the rate of reaction with the graphite.
The number of mole CO, reacting between κ and κ ~ άκ for a gas circulating at a velocity ν is:
A- . dS .dt.C with dt = άκ/ν
The resultant concentration change is given by: k . dS .dt.C
cm/s
cm3/s cm2
cm2
cm
dV. v
k . Pe .άκ ~Q~~
If the temperature is constant along the channel then k and Q are constant and:
k Pe κ
Ì0Se
C = C0 e Q
If the temperature varies along the channel, k and Q varies as a function of κ
The equation to consider is then:
C * ¡άκ) Pe άκ
3.1.2
For a cylindrical graphite tube with a constant axial temperature and with internal flow, the following equation can be written:
k .nD . κ
C = Ce~ ~Q~ (10)
άκ the C02 concentration at the distance κ -f άκ 3.1.3
For a flow in an annulus between a cylindrical rod and a cylindrical tube, as shown in Figure 4, also with axial con stant temperature, it can be easily seen that if the walls are reacting with the same k as the central rod.
k π (D + Z>,) ~Q
C = Coe
If y is small, or D ■.
( Π )
Ik π D
(12)
C = C0 e Q
If the reaction rate kx of the vessel surface is different from the k of the central rod, we can write:
C = Cr
5.1.4
k-¡ π Dì
O
k οτ D
c
n(k
1D
1+ kD)
¡¡(131
For the flow in the cylindrical space above a reacting top cover at constant temperature (Figure 5) assuming a central feeding of the reactant, we know that:
C/Co
I DISTANCE! CM.
[image:10.595.311.582.49.414.2] [image:10.595.31.247.50.282.2]sc
i r
ds = dV
at
=3C ï r Ï>C C
är =
= 2 71
A: .
rar
= 2 τι r ar h
aV
= —
= — 2 π r
dS . åt dV
dr h
Q k 2 π r
Q k 2 π r
Q
Assuming Λβ
C =
= c„
k m
Q C
dr
= O ar
■2
C
d i ntegrating:
(14) Equation 14 gives the concentration of impurities at the distance r from the centre.
3.1.5
In the case of flow in a cylindrical space above a top cover, as suming that the cylindrical space is filled with a porous material reacting with the reactant centrally fed, we must use
ks rate per unit area B.E.T. for the internal surface. U p to now we have used a k value which refers to the external surface of the reacting body.
The volume of porous material between r and r + dr is
2nr dr It, consequently:
dS = 2 nr dr h o Sg
Sg = the B.E.T. surface per gramme porous material cm2/g
ρ = the density g/cm3
oSg = the surface B.E.T. per unit volume cm2/cm3
Vg o 2 Tir dr h 02 Tir dr h
* = — β — — β
-Κ^· = the pore volume per gramme of the porous material
0 = the porosity of the material. f/K = 2 π/' í/r Λ 0 = free volume.
Consequently:
ÖC
δ 7 <//· =
/c, 2πτ dr h ρ Sg C
■ROD
If R0 is assumed very small compared to R
ks π r2 ha Sg
C = Cge~ Q
k„ π r2 h
(15)
(16)
Fig. 10. Typical fuel box corrosion (5 VPM CO, 20 atmosphere) in 3 years.
C = C„ e Q
where kv = ks ρ Sg the reaction rate per unit volume is expressed in 1/s.
3.2 Experimental corrosion rates
As already established the k value is an important factor in the depletion rate calculation. This value depends on the graphite quality and temperature. We use in our calculation the k value obtained experimentally with Pile G r a d e A in re action with C02.
Figure 6 line (2) shows the corrosion rates of P.G.A. in an Arrhenius plot log W versus \\T' (\fK). k is expressed in mg. c m 2 h r_ 1 vpnr1. This k' value is related to the geometri
cal surface area of the reacting body with the C02. _£IRT
The corrosion rate fits in with the equation k' = Ae
where the activation energy E is approximately 45 kcaljmole.
It must be noted that this corrosion rate is obtained with 200 vpm CO-2 in helium in presence of a high concentration of CO, CO/C02 ratio being 10/1.
Figure 4 line (1) shows rate constant ks in cm/s for an activated charcoal, the characteristics of which are as follows : Ash content 0.140.17
Density ρ 0.51 Porosity 8 5 %
Specific Surface Area 700 rcr/g = 7.106 c m % .
The rate constant has been obtained experimentally in tests where the diffusion controlling steps are eliminated [1]. Thus, the activation energy of 86 kcaljmole is obtained.
86
ks = 3.4 108 e~ RT
In the case of a porous pellet with a forced high flow through it, the use of this reaction rate constant is justified.
3.3 Depletion rate along the slots of the pressure rod
With the present fuel design element the purge gas reaches the top of the first fuel box through a central hole in a pressure rod resting on the lid of the top fuel box. The gas flows towards the periphery of the fuel box along four channels forming a cross channel (Figure 7).
The purge flow in the reactor is 5.103 cm3/s at 20 atm
and 350cC.This purge flow in the reactor is divided between
the 259 fuel rods. Table 1 gives the relevant data k/Q for the purge flow as calculated in Annex 1.
As indicated in Figure 8 the top cover of the fuel boxes range from 1000° C to 1150?C depending on the radial
location of the fuel element in the reactor. A typical /^distri bution along the boxes is also given in Figure 8.
The depletion of the reactant along the length of the four channels has been calculated assuming that only the face in contact with the lid of the box reacts. It is also assumed that the top cover is at constant temperature, and typical exam ples are calculated for 1000rC and 1100CC.
3.3.1 Top Boxat 1000e C.
kl
C
-~.7
W^
.0052. , 4
C„ Q
C — 0.02084 1 R — ~ e
[image:11.595.17.276.39.219.2] [image:11.595.282.552.40.135.2]/ = 0.125" = 0.317 cm. 1.749"
R = = 2.221 cm. 2
The term β / 4 comes from the fact that the purge flow is divided into four legs.
C = C0 0.985
3.3.2 Top Boxat 1100° C. C — 0.0495
cr
e
C = C0 χ 0.95
It can then be seen that the depletion along the top cover is not very important. Moreover, by this arrangement if 5 vpm C02 is admitted in the purge flow four grooves of 4.4 mm maximum depth will be burned into the top lid at 1100° C after a 3 year operation.
3.4 Depletion rate along fuel boxes
As shown the depletion rate along the top cover is negligible. It may then be assumed that in the annulus between the fuel rod and the fuel boxes, a concentration reactant of C0 is established.
By inserting in equation (4) the dimension of the fuel box and characteristics of the purge flow, and moreover assuming a uniform reaction rate along a short length of the box, the distance is'calculated at which the concentration is decreased by a factor 2 and by a factor 100. The results are tabu lated in Table 1.
It is assumed that the inner wall of the fuel tube has a temperature, 100° C lower than the temperature of the
■t ty soo
M i i ι ! !
- ! ! 1
[image:12.595.34.574.406.783.2]^±_
| | | i ! i
¡ ;
i i
-XLLJ
—rd
- !"
..
L
-- 1
. !
4-i
1!
I-■ i
■ f Γ τ
I l '
!
i 1 _L¡
-J ¡ ;
4 J
! 1i
ΐ—
1
■
1
[ ι
■
■ " - ■
1 i
—
~ *---'
. ——
--1 !
1
—
-*,,.
,
w ¿^*
rff-'
T¡ ■ -S'i -',
71 oí1
/
1
1/
/
— ' S
> í i * = + 7 1 ! .-1 =
*
Ç
.
ai '/τ«(* '71y,
Ï
=01
—
^ i/Ts'iiJ+m
— i —
11-011'¿
,.
|
77/
í,
| |
_
r - r
-77 ι 1 'Ι 1240 12! 1 1008 Ι
7 9 3
■ 5S4
L
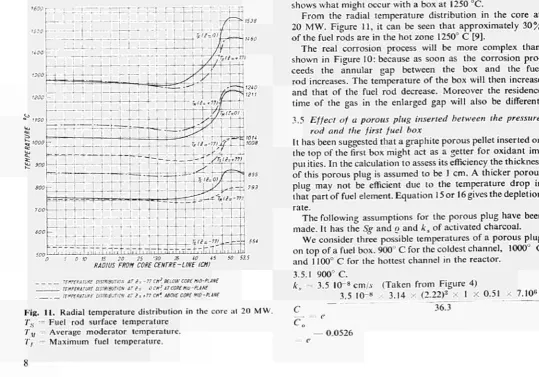
5 0 10 ¡5 20 25 '30 35 40 45 50 53.5
RADIUS FROM CORE CENTRE-UNE ICMI
TEMPERATURE DISTRIBUTION AT ¿ = - 7 7 CM2, BELOW CODE HlD-PLÂNE TEMPERATURE DISTRIBUTION AT 2= OCH3, AT COPE MIO-PLANE TEMPERATURE DISTRIBJT/OH AT / = f 77 CM*. ABOVE CORE MID-PLANE
adjacent fuel box. Let us take as an example the case of a top box at 1250° C and the adjacent inner fuel rod at 1150° C.
7^(k1
+k)
=1.930
— 1.930 κ C = C0 e
.35 cm 0.5
0.01 2.3 cm
Consequently the C02 level will be reduced to 50 % of its initial value after .35 cm and to 1 % of its value after 2.3 cm if the gas is in contact with a fuel box at 1250° C and a fuel rod surface at 1150° C. This can also be seen by considering Figure 9.
The analysis given above is inaccurate due to the fact that it assumes a constant temperature along the fuel box. A more accurate calculation can be obtained by taking into account the fluctuation of (k1 + k) over the length of the fuel boxes. Then the formula giving C can be written as follows:
log C
C,
—
πϋ
J
.80 (ÄTj + k) άκ
80 Q
The integral value may be obtained by graphical integration along the length. Figure 8 shows a typical temperature dis tribution [9] and the corresponding k* value along the box. Because the depletion occurs along a very short length with an approximately uniform temperature gradient the expres sion is not integrated.
Figure 10 shows schematically the corrosion to be expected along a fuel box. It has been assumed that C0 was
5 vpm. The right hand side of the figure shows what might be expected with a fuel box at 1150° C and the left hand side shows what might occur with a box at 1250 °C.
From the radial temperature distribution in the core at 20 MW. Figure 11, it can be seen that approximately 30 % of the fuel rods are in the hot zone 1250° C [9].
The real corrosion process will be more complex than shown in Figure 10: because as soon as the corrosion pro ceeds the annular gap between the box and the fuel rod increases. The temperature of the box will then increase and that of the fuel rod decrease. Moreover the residence time of the gas in the enlarged gap will also be different.
3.5 Effect of a porous plug insertea between the pressure
rod and the first fuel box
It has been suggested that a graphite porous pellet inserted on the top of the first box might act as a getter for oxidant im-puiities. In the calculation to assess its efficiency the thickness of this porous plug is assumed to be 1 cm. A thicker porous plug may not be efficient due to the temperature drop in that part of fuel element. Equation 15 or 16 gives the depletion rate.
The following assumptions for the porous plug have been made. It has the Sg and ρ and ks of activated charcoal.
We consider three possible temperatures of a porous plug on top of a fuel box. 900° C for the coldest channel, 1000° C and 1100° C for the hottest channel in the reactor.
3.5.1 900° C.
Är, = 3.5 1 08 cm/s (Taken from Figure 4)
3.5 ΙΟ« χ 3.14 χ (2.22)2 x 1 x 0.51 Χ 7.106
Fig. 11. Radial temperature distribution in the core at 20 MW. Cf Ts = Fuel rod surface temperature C 0 T'y = Average moderator temperature.
TF == Maximum fuel temperature.
36.3
Which gives a very low porous pellet efficiency.
13.5.2 1000° C. — 0.995 = e
3.5.3 1100° C.
Jcs = 7.10-6 (Taken from Figure 4).
C — 8 . 9 6
Vo~
e,i It is apparent then that the efficiency of a porous plug as a getter is very temperature dependent. Its efficiency is com plete for a 1100° C porous plug but negligible at 900° C and not sufficient at 1000° C.
; It is problematic to maintain a porous material at a tem perature of 1100° C over a thickness of 1 cm on the lid of the top box. The use of a more reactive material can probably decrease the required operating temperature.
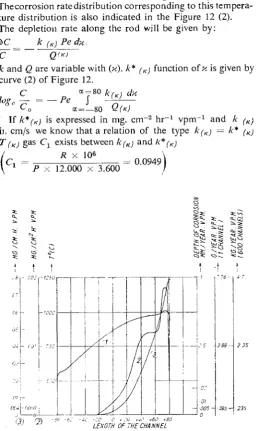
3..6 Corrosion along the fuel channel
The temperature distribution along the fuel channel at radius R = 50 cm of the reactor core, is given in Figure 12(1). Thecorrosion rate distribution corresponding to this tempera ture distribution is also indicated in the Figure 12 (2). The depletion rate along the rod will be given by: c>C_ k (K) Pe άκ.
κ!
rKj function of κ is given by
C
k
and
Q
QtKl
are variable with
(κ), k*
curve (2) of Figure 12
He γτ
*- 0
α =
α = —
so
k
(K)άκ
80 Q (Κ)
If k*(Κ) is expressed in mg. c m- 2 hr_ 1 v p m -1 and k
ii, cm/s we know that a relation of the type k(K) = k*
T (K) gas Cx exists between krK) and k* rK)
[image:13.595.13.270.297.729.2]I J? χ ΙΟ« „ „ „ „ Λ
| C, = = 0.0949
\ x PA 12.000 χ 3.600 /
IS ^
^ Serf
£ï: SP
SS
2δ
4 08 α "ί 03 ΟΙ 004 \ - co: -- ΟΟΊΙt
- 12S0- f000 j
/
' Ί \
S-"'
y
2 / / / /
Ζ'
ll\
1/
'1
1oj Q) -00 0 * 00 tiO +60 *8(
LENGTH OF THE CHANNEL
Fig. 12. Temperature and corrosion distribution along a fuel rod.
Moreover Q(K) = —- TM gas
Consequently : k(K)
Q(*)
k*(K) Τ (K) gas Ca
Qo
k* (K) C,
T (κ) gas
Qo
80
I
, Μ-άκ=^ J80 k*(K)CxdK80 ii (et) tio—80
'°gc
T 80
- Ü A ƒ k*(K)Cidx
Ho —80 Then:
C
cl
The integral is obtained by a graphical integration. Curve (3) Figure 12 gives:
80
J" k*fK) άκ mg. hr'1 c m- 2 v p m- 1
-80 80
Pe l k*(Κ) άκ mg. hr~x vpm x
—80
is obtained per channel, taking into account that Pe the perimeter of the trefoil channel is 11.06 cm.
The Q0 value per coolant passage can be obtained ap
proximately by multiplying the cross sectional area of the passage 2.27 cm2 by the mean value of the gas velocity at
T0 = 350° C.
Q0 = 2.27 x 5012 = 1.163 χ 104 cm3/s.
At the end of the hottest channel :
623 χ 0.079 x 11.06 X 0.0949
C e 1.163 x IO4
—0.00433
C = C0e
C — 0.9956 C0
It can thus be seen that the depletion rate along the channel is negligible. After consideration of Figure 12, it may be seen that curve (2) also represents the depth of cor rosion mm/year vpm.
Curve (3) also gives the total amount of graphite removed from the core per vpm.
4. Conclusions
From the previous calculations, an approximate picture can be obtained of the corrosion distribution in the reactor along the hot graphite surfaces which come into contact with flowing gas.
To the calculations have been performed with the following assumptions and simplifications with made:
4.1
The reactivity k used for the graphite is an experimental re activity obtained on P.G.A. graphite. The graphite to be used in the reactor will probably have a different reactivity.
4.1.2
The k quoted has been obtained at atmospheric pressure. and extrapolated to 20 atm.
4.1.3
4.1.4
The effect of radiation on the k has not been taken into account. Moreover in our discussion we neglect the possible
C0 — C radiation induced reaction. 4.1.5
Mechanical erosion has also been neglected. 4.1.6
The calculations assumed a steady temperature distribution along one rod. However, the temperature distribution in the reactor varies from rod to rod, and for a given rod it varies with time.
Reactor operation at lower temperature may also affect the temperature level and distribution. Moreover recent calculations tend to indicate that the temperature of the fuel will be higher than those used in the calculations. The temperatures used in the calculations were obtained as suming 18.25 M W generated in the fuel rod and 1.75 M W in the reflector. The latest figures are 19.4 M W in the core and 0.6 M W in the reflector. [9].
4.1.7
It was assumed that the graphite attack would be uniform, although some experimental evidence indicates that above 1100° C pitting occurs.
4.1.8
Reactions have been assumed to be of the first order. Bearing in mind these restrictions, we may conclude:
4.2.1 For the Fuel Boxes
4.2.1.1 The fuel element in its actual design might suffer from a cruciform corrosion on the lid of the first box. The depth of this corrosion will depend on the temperature of each fuel element and on the concentration of impurities in the purge flow.
As an example, a t o p cover at 1100° C would be corroded to a depth of 4.4 m m after 3 years in a stream containing 5 vpm C02.
4.2.1.2 The depletion rate of impurities along the lid of the top fuel box is not sufficient to avoid a further corrosion along the side of the first fuel box.
For the hottest boxes at approximately 1300° C the depth of denetration, a function of the C02 concentration, decreases exponentially from the t o p and after 1.416 cm the rate of reaction is decreased by a factor of 100.
Using the reactivity of P.G.A. and assuming a C02
content of 5 vpm it can be seen that where the corrosion starts 4 cm would be removed from the thickness of the box per three years, and 1.65 cm from the thickness of the adjacent fuel rod which is supposedly at 1200° C. This means that the useful life of the fuel element might be very much shorter than 3 years because the thickness of the fuel rod is less than 4 mm.
For a box at 1100° C the damage is spread over a longer distance approximately 15 cm, but the deepest attack will be approximately 4 5 mm per 3 years.
Consequently favoured by the steep temperature gradient existing at che top of the core, the top fuel box and the ad jacent fuel r o d can be attacked locally.
The real corrosion process will be more complex, as already stated, because during the process of corrosion the fuel box temperature will increase, while the fuel rod tem perature decreases, and the residence time of impurities is also longer in an enlarged annular gap.
4.2.1.3 The installation of an active charcoal pellet will only be effective in removing the oxidising elements if it can be maintained at a high temperature (above 1000° C).
The use of a more reactive material can decrease the required operating temperature.
4.2.1.4 Another method of removing the impurities would be the use of a hot metal getter which can operate at lower temperature (600° C ) . The advantage of a hot metal getter [10] would be to remove the CO as well, and so avoid any radiation induced between CO an C.
4.2.2 For the Fuel Rod
Due to the temperature distribution the maximum depth of corrosion will be localised at the top of the fuel rod. When this depth reaches the maximum admissible value of 0.5 mm the core will have lost 25 kg of graphite (41.5 g per channel).
There is only a negligible depletion of the reactant at each passage over the fuel rod. (0.5 %).
5. Acknowledgements
The numerical and graphical computations performed by M r . P. de Windt and Mr. M . I. Hawker.
6. References.
[1] D.P.Report 75
[2] P. WALKER et Al; Advance in catalysis Vol
[3] AHLBORN WHEELER; Advance in catalysis Vol III
[4] Chemical Engineering Series TREY BAL Mass Transfer Operations
[5] G. R. HENNIG et Al ; Radiation effects on the oxidation rate of graphite P/l 778.
[6] S. GLADSTONE; Principle of Nuclear Reaction Engineering [7] P. S. BOURKE, W. H. DENTON; Carbon transport Problems in
a High Temperature Gas Cooled Graphite Reactor A.E.R.E. R3916
[8] E. WICKE and H. H. KOPPER; Röntgenstruktur und chemische
reaktionsfähigkeit verschiedener Kohlenstoffproben. Journal de Chimie Physique. Tomme 50 No. 1.
[9] D. A. HAWKES; Dragon Data Sheets and Private Communi cation.
[10] D. KINSEY; Private Communication.
Annex
Calculation of the purge flow data
The experimental reaction rate column k' measured at 1.8 atm expressed in mg/cm2 hr vpm is converted into the
k* column 2 expressed in mg/cm2 hr vpm at 20 atm.
The k value expressed in cm/s column 3 is obtained b y :
R χ Τ χ 106
k = χ k* cm/s
Ρ x 12.000 χ 3.600
k = Τ χ 0.0949 χ k*
The flow Q„ at 350° C and'20 atm is per fuel r o d : 5.103
ß0 = 2 5 9 = 1 93 c m / s
TB = 350° C = 623° K
k
The — column 3 value is obtained:
e
k
Q k
Q
T X 0.0949 x k' 623
Qo*T
= 3.062 /c*
The diameter of the fuel box is:
D ■-- 1.749" = 4.442 cm. Column 4 is then calculated:
^ « 1 3 . 9 5 5 *
Q Q
The column 6 is obtained by adding thenDk/Q of column 5 to the nDkJQ of the same column (5) taken at tempera ture 100° C and lower.
Column 7: 0.639
0.5 .TÖ Q'
Column 8:
• cm
(k
x+
k)
' 0 . 0 1 TiD ~~Q
4.61
(λj "i" «
Discussion
7. P. W. Houtman: Can one expect the radiation damage of graphite to have a big influence on the reaction rate with oxygen.
Answer b :
L. Valette: The only experimental evidence on the enhan cement of the oxidation of graphite by neutron irradiation has been given by G.R. Hennig who has observed out of pile
a higher reaction rate with a preirradiated graphite specimen. At temperatures above 600° C the increase in reaction rate disappears because of thermal annealing of the radiation damage.