doi:10.4236/ojg.2013.32B002 Published Online April 2013 (http://www.scirp.org/journal/ojg)
Integration of Seismic Refraction and 2D Electrical
Resistivity in Locating Geological Contact
Nisa’ Ali, Rosli Saad, M. M. Nordiana
Geophysics Section, School of Physics, Universiti Sains Malaysia, Penang, Malaysia Email: nisa_ali_89@yahoo.com
Received 2013
ABSTRACT
The aim of this research is to locate the geological contact for engineering purpose applying seismic refraction and 2D electrical resistivity method. Resistivity and seismic refraction method was conducted on four survey lines with 3 lines running from NW to SE which about parallel to each other and 40 m apart while the fourth line was running from SW to NE. The 2D resistivity survey used minimum electrode spacing of 5 m and the survey used pole-dipole array with minimum current was 2 mA and maximum was 20 mA. The seismic refraction survey used 5 m geophone spacing with offset shot was + 30 m and - 30 m. Resistivity results generally show the area was divided into two main zones, allu-vium with resistivity value of 10 - 800 ohm-m, and granite bedrock with resistivity value of > 2500 ohm-m. There is a geological contact between granite and alluvium. The seismic results show the area consists of two layers. The first layer (top layer) with velocity of 460 - 900 m/s which was alluvium mixed with boulders. The second layer with veloc-ity of 2060 - 3140 m/s with depth 71 - 90 MSL. The thickness of the overburden is 5 - 15 m.
Keywords: Geological Contact; 2D Electrical Resistivity; Seismic Refraction
1. Introduction
A geological contact is a boundary between two units that is identified on the basis of a compositional, textural, structural, or temporal difference between units [1]. The ways in which rock bodies fit together are deduced from geologic mapping, supplemented wherever possible by drilling and geophysical data [2].
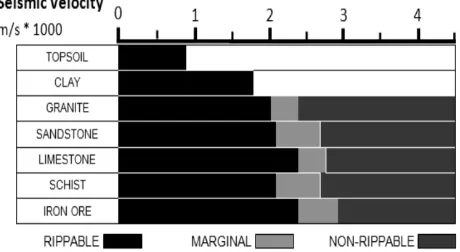
The 2D electrical resistivity method is most suitable for interpreting geological structures in subsurface while seismic method is valuable for mapping depth of bedrock and fracture zones but fail to indicate the depth or dip direction of the zone as 2D resistivity method could [3]. Thus, integration of seismic refraction and 2D electrical resistivity method will give useful and better information on delineating contact and faults for engineering purpose. The refraction seismic method depends on seismic ray paths being bent at velocity discontinuities. A compres-sional wave that impinges on a boundary separating two media with different acoustic impedances is partially reflected and partially refracted into the lower medium [4]. Measurements of travel-time as a function of range can be transformed into a graph of velocity as a function of depth. Velocity boundaries usually coincide with geo-logical boundaries and a cross-section on which velocity interfaces are plotted may therefore resemble the geo-logical cross-section, although the two are not necessari-ly the same [5]. Figure 1 shows seismic wave velocities
in earth materials.
[image:1.595.310.540.592.718.2]Resistivity methods are used in engineering geological investigations of sites prior to construction [6]. The resis-tivity measurements are normally made by injecting cur-rent into the ground through two curcur-rent electrodes and measuring the resulting voltage difference at two poten-tial electrodes [7]. Resistivity surveys give a picture of the subsurface resistivity distribution. The spatial contact between rocks will be identified based on the variation of resistivity values. The distribution of the resistivity of the earth material will be used to interpret the geology of the subsurface based on the resistivity value for common geologic materials (Table 1).
2. Survey Area
The study area is located at PT 8088, Mukim Batu, Gombak, Selangor, Malaysia with the coordinate of 3° 15’ 37.2” N and 101° 38’ 48.22” E. The area was cut and filled with undulating surface and some bushes [9] with fine grained granite comprising granite porphyry and microgranite as the main rock material [10].
3. Methodology
In this survey, two geophysical survey has been carried out which are 2D resistivity method and seismic refrac-tion survey.
Four resistivity lines were set with three lines (SELA1- SELA3) were about 40 m apart and parallel to each other while the other one (SELA4) was set up crossing the three lines (Figure 2). Included in Figure 2 are the loca-tions of the boreholes (BH3 & BH5). BH3 situated 14.5 m from SELA2 and 37.5 m from SELA4. BH5 located 8.0 m from SELA2 and 17.0 m from SELA4. This re-search was carried out by plant in the electrodes into the ground in a straight line with a constant spacing of 5 m. A multi electrode selector will be used to select the ac-tive electrodes for each measurement. The value was collected by the resistivity meter, which is ABEM SAS4000 system using pole-dipole array with minimum current of 2 mA and maximum was 20 mA. The values of resistivity obtained from each measurement are plotted on a pseudo-section and contoured.
[image:2.595.308.538.112.183.2]Four seismic spread was set up in line with resistivity method, SELA1 – SELA4 (Table 2). The length of each seismic spread is 115 m with offset shot +30m and -30m.
Table 1. Resistivity of common geologic materials [8].
Material Resistivity (Ωm)
Granite 300 - 1000 000
Sandstones 1 - (7.4 × 10⁸)
Alluvium and sand 10 - 800
[image:2.595.59.288.495.698.2]Clays 1 - 100
Figure 2. The survey area with survey lines and boreholes.
Table 2. Distance and position of resistivity and seismic survey lines.
Resistivity Seismic spread (refer to resistivity line)
SELA1 0 - 200 m 55 - 170 m
SELA2 0 - 180 m 55 - 170 m
SELA3 0 - 190 m 55 - 170 m
SELA4 0 - 200 m 45 - 160 m
The study was conducted by utilizing a 16 lb sledge-hammer as source of wave, 24 units of 24 Hz geophones and ABEM MK6 seismograph. The survey line uses 5 m geophones spacing and 7 shot points for each spread.
4. Results and Discussion
The results obtain from seismic refraction and 2D resis-tivity is supported by borehole records. Seismic cross sections have provided the depth profile of the survey area while the resistivity pseudosections gave the resis-tivity value of the subsurface.
4.1. Seismic Refraction
The results from the seismic cross sections (Figures 3-6), show that the survey area consists of two layers. The seismic velocities for the first layer range from 460 m/s to 900 m/s and consist of alluvium mix with boulders. The second layer velocities range from 2060 m/s to 3140 m/s with depth 71 - 90 MSL. The thickness of the first layer is 5 - 15 m. Based on these results, the second layer abrupt velocity change has outlined the geological con-tact between the top layer and the bedrock.
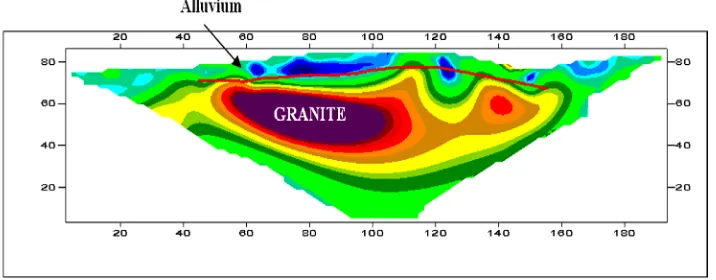
4.2. 2D Resistivity
Resistivity results (Figures 7-10) are pseudo-sections showing the resistivity value of the subsurface with the red line is the second layer of the seismic refraction re-sult. Generally, the area was divided into two main zones, alluvium with resistivity value of 10 - 800 Ωm, and gran-ite bedrock with resistivity value of > 2500 Ωm. There is a contact zone between granite and alluvium which pro-duces faults.
[image:2.595.308.540.602.712.2]Figure 4. Seismic cross-section of SELA2.
Figure 5. Seismic cross-section of SELA3.
Figure 6. Seismic cross-section of SELA4.
Legend
Sand
Silt
Granite 1.50m
4.50m
9.00m
12.00m
17.00m BH5
1.50m
7.50m
18.00m
25.50m
30.50m BH3
Figure 7. Cross section of borehole data BH3 and BH5.
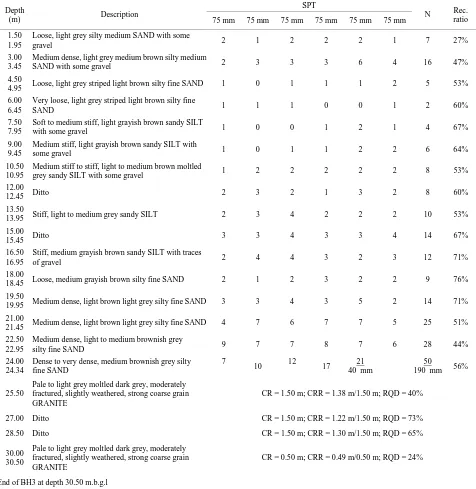
4.3. Borehole Records
Borehole data, BH5 (Table 3) and BH3 (Table 4) show that the study area is covered by alluvium, mostly sand. Granite is found at depth of 12.0 m and this fit with the resistivity value pseudo-section of SELA2 (Figure 8) which indicates granite near BH5 area.
Table 4 providing bore log for BH3. Similar to the previous borehole, the subsurface materials for this borehole are alluvium and granite. BH3 has granite as bedrock at depth of 25.5 m.
Figure 11 shows the cross section of borehole data. From the cross section, the bore log has the same lithol-ogy though the thicknesses are vary.
Table 3. Borehole data, BH5.
Depth (m) Description SPT
a
N Rec.
b
ratio 75 mm 75 mm 75 mm 75 mm 75 mm 75 mm
1.50 1.95
Medium dense, medium brown moltled grey silty fine SAND with
little gravel 2 4 3 3 3 3 12 53%
3.00
3.45 Ditto 3 4 4 9 6 5 24 61%
4.50
4.95 Stiff, medium brownish grey sandy SILT with a little gravel 2 4 3 2 2 2 9 44%
6.00
6.45 Ditto 2 2 3 4 2 3 12 51%
7.50
7.95 Ditto 4 3 4 3 2 2 11 55%
9.00
9.45 Medium dense, light to medium brownish grey silty SAND 5 9 9 7 7 6 29 38%
10.50
10.95 Dense to very dense, light to medium brownish grey silty SAND 5 7 9 8 8 9 34 36%
12.00 Pale to light grey moltled dark grey, moderately fractured, moderately weathered , medium to strong coarse grain GRANITE CRc = 1.50 m; CRRd = 0.92 m/1.50 m; RQDe = 35%
13.50 Ditto CR = 1.50 m; CRR = 0.82 m/1.50 m; RQD = 37%
15.00 Pale to light grey mottled dark grey, highly fractured, moderately
weathered medium to strong coarse grain GRANITE CR = 1.50 m; CRR = 0.80 m/1.50 m; RQD = 8% 16.50
17.00 Ditto CR = 0.50 m; CRR = 0.20 m/0.50 m; RQD = NIL
End of BH5 at depth 17.00 m.b.g.lf
Table 4. Borehole data, BH3.
Depth
(m) Description
SPT
N Rec.
ratio 75 mm 75 mm 75 mm 75 mm 75 mm 75 mm
1.50 1.95
Loose, light grey silty medium SAND with some
gravel 2 1 2 2 2 1 7 27%
3.00 3.45
Medium dense, light grey medium brown silty medium
SAND with some gravel 2 3 3 3 6 4 16 47%
4.50
4.95 Loose, light grey striped light brown silty fine SAND 1 0 1 1 1 2 5 53%
6.00 6.45
Very loose, light grey striped light brown silty fine
SAND 1 1 1 0 0 1 2 60%
7.50 7.95
Soft to medium stiff, light grayish brown sandy SILT
with some gravel 1 0 0 1 2 1 4 67%
9.00 9.45
Medium stiff, light grayish brown sandy SILT with
some gravel 1 0 1 1 2 2 6 64%
10.50 10.95
Medium stiff to stiff, light to medium brown moltled
grey sandy SILT with some gravel 1 2 2 2 2 2 8 53%
12.00
12.45 Ditto 2 3 2 1 3 2 8 60%
13.50
13.95 Stiff, light to medium grey sandy SILT 2 3 4 2 2 2 10 53%
15.00
15.45 Ditto 3 3 4 3 3 4 14 67%
16.50 16.95
Stiff, medium grayish brown sandy SILT with traces
of gravel 2 4 4 3 2 3 12 71%
18.00
18.45 Loose, medium grayish brown silty fine SAND 2 1 2 3 2 2 9 76%
19.50
19.95 Medium dense, light brown light grey silty fine SAND 3 3 4 3 5 2 14 71%
21.00
21.45 Medium dense, light brown light grey silty fine SAND 4 7 6 7 7 5 25 51%
22.50 22.95
Medium dense, light to medium brownish grey
silty fine SAND 9 7 7 8 7 6 28 44%
24.00 24.34
Dense to very dense, medium brownish grey silty fine SAND
7
10 12 17 21
40 mm 56%
50 190 mm
25.50
Pale to light grey moltled dark grey, moderately fractured, slightly weathered, strong coarse grain GRANITE
CR = 1.50 m; CRR = 1.38 m/1.50 m; RQD = 40%
27.00 Ditto CR = 1.50 m; CRR = 1.22 m/1.50 m; RQD = 73%
28.50 Ditto CR = 1.50 m; CRR = 1.30 m/1.50 m; RQD = 65%
30.00 30.50
Pale to light grey moltled dark grey, moderately fractured, slightly weathered, strong coarse grain GRANITE
CR = 0.50 m; CRR = 0.49 m/0.50 m; RQD = 24%
End of BH3 at depth 30.50 m.b.g.l
[image:4.595.128.472.602.721.2]Figure 9. Resistivity pseudo-section of survey line SELA2.
Figure 10. Resistivity pseudo-section of survey line SELA3.
Figure 11. Resistivity pseudo-section of survey line SELA4.
5. Conclusions
2D resistivity method and seismic refraction results sug-gest that the study area consist of granite bedrock and alluvium mix with boulders. Hence, the geological con-tact outline is between granite and alluvium. There were faults along N-S at distance 100 m of SELA1-3.
6. Acknowledgements
The authors would like to extend sincere gratitude to all Geophysics Department Staff and Postgraduate students of School of Physics, Universiti Sains Malaysia for their assistance in acquiring the geophysical data and making the research a success.
REFERENCES
[1] R. C. Howe, “Geologic Contacts,” Journal of Geoscience Education, Vol. 45, 1997, pp. 133-136.
[2] G. H. Davis, “Structural Geology of Rocks and Regions,” John Wiley & Sons, Inc., 1984, p. 492.
[3] R. Saad, M. M. Nordiana and Edy Tonnizam Mohamad, “The 2D Electrical Resistivity Tomography (ERT) Study for Civil and Geotechnical Engineering Purposes,” Elec-tronic Journal of Geotechnical Engineering, Bund, Vol. 16, 2011.
[image:5.595.120.478.400.540.2]Depart-ment Federation of Malaya, 1953.
[5] R. Saad, “Novel Protocol of Engineering Geophysics In Urban Environments,” Ph.D. Thesis, University Sains Malaysia, 2009.
[6] R. L. Sengbush, “Seismic Exploration Methods,” IHRDC Publishers, 1983.
[7] D. H. Griffiths and R. F. King, “Applied Geophysics for Geologists and Engineers: The Elements of Geophysical J Prospecting,” Pergamon Press, 1981.
[8] J. M. Reynolds, “An Introduction to Applied and Envi-ronmental Geophysics,” John Wiley & Sons, Ltd., 1997, p. 796.
[9] R. Barker, “Electrical Imaging and its Application in Engineering Investigations,” Engineering Geology Spe-cial Publications, Geological Society, London, Vol. 12, No. 1, 1997, pp. 37- 43.
![Table 1. Resistivity of common geologic materials [8].](https://thumb-us.123doks.com/thumbv2/123dok_us/7888412.741631/2.595.59.288.495.698/table-resistivity-common-geologic-materials.webp)