Munich Personal RePEc Archive
The role of foreign firms in domestic
exporting
Sun, Sizhong
James Cook University
November 2009
The Role of Foreign Firms in Domestic
Exporting
Sizhong SUN School of Business James Cook University Townsville, QLD, 4811
Australia
E-mail: sizhong.sun@jcu.edu.au
Telephone: 61-7 4781 4710
Fax: 61-7 4781 4019
Mailing Address:
Sizhong Sun School of Business
Faculty of Law Business and Creative Arts James Cook University
Townsville, QLD, 4811 Australia
[ABSTRACT]
This paper investigates the impact of foreign firms on exports of domestic exporting
firms. We show that domestic firms respond to an increase in the presence of foreign
firms by increasing their exports, despite the increase in foreign presence can drive up
the production cost and make domestic market more profitable. This hypothesis is
then tested in China, where we find a 1 per cent increase in foreign presence causes
domestic firms to increase their exports by 0.74 per cent. This finding sheds light on
understanding China’s massive exports and fast inflow of foreign investment
observed in the past three decades.
[KEY WORDS]
Export, Foreign Firm, FDI, Spillovers, China
[JEL CLASSIFICATION]
1. Introduction
Researchers have long been searching for driving forces of firm exporting behavior,
for example theoretically from the classical absolute and comparative advantage
theory and Heckscher-Ohlin model to the ‘new trade theory’ associated with
Krugman (1979). More recently, pioneered by Melitz (2003), the firm heterogeneity
has been incorporated to explain why some firms export while others not, even though
they are in the same industry (see David Greenaway and Richard Kneller, 2007 for a
survey). There also exist a number of empirical studies that focus on different
countries, to name a few, Aitken, Hanson, and Harrison (1997) on Mexico, Roberts
and Tybout (1997) on Colombia, Clerides, Lach, and Tybout (1998) on Colombia,
Mexico, and Morocco, Bernard and Jenson (1999, 2004) on the US, Greenaway,
Sousa, and Wakelin (2004) and Kneller and Pisu (2007)on the UK, Gorg, Henry, and
Strobl (2008) on Ireland, and Sun (2009) on China.
Different from these studies, this paper intends to investigate the impact of an increase
in the presence of foreign firms on domestic exporting firms’ export quantity in China.
It has been widely recognized that foreign firms can positively affect domestic firms,
either through the forward and backward linkage, the labor mobility, or the imitation
and competition effect (see Magnus Blomstrom and Ari Kokko, 1998 for a survey).
The positive spillovers from foreign firms will affect domestic firms’ export behavior.
As will be shown later, an increase in the presence of foreign firms can generate an
increase in domestic exports, even if the increase in foreign presence also brings in
such negative impact as driving up the production cost and making domestic market
more lucrative. This paper focuses on China, which on the one hand is one of the
foreign investment. Understanding the impact of foreign firms on domestic export
quantity will enable a better understanding, from a microeconomic perspective, of
China’s exports and subsequently its massive trade surplus.
The remainder of the paper is organized as follows. Section 2 establishes a simple
partial equilibrium model to examine the impact of foreign firms, and lays down the
hypothesis for later empirical exercise. We then set up the econometric specification,
describe the data, and construct variables in section 3. Section 4 discusses the
empirical results and section 5 concludes.
2. Export Quantity in the Presence of Spillovers
In an industry where firms sit in an interval [0,1], firms located in
[ ]
0,γ are foreignfirms and firms located in (γ,1] are domestic firms. Thus the γ denotes the presence
of foreign firms in the industry. All firms are homogenous and can sell their products
at both the domestic and foreign markets. At the domestic market, firms play Cournot
game, and have an inverse demand function as follows:
( )
Q pp= , pQ <0
where Q is the aggregate domestic sales and
∫
∫
∫
− = − + −= 1
0 1
0( ) ( ) γ( )
γ
dj e q di e q di
e q
Q i i i i j j , q denotes the firm output, e denotes
the exports, and pQ represents the derivative of p with respect to Q. The world
market is a competitive market, and firms are faced with world price P.
In the course of production and exporting, costs are incurred respectively. For the
production process, firm i's cost function is ⎟
⎠ ⎞ ⎜
⎝ ⎛
∫
γ0
, q dj
q
0
22 <
C , and C12 <0, where the subscripts 1 and 2 denote the derivatives with respect
to the first and second arguments of the production cost function respectively. The
foreign firms’ activities drive up the production cost (C2 >0), for example increasing
the average wage in the industry. Meanwhile the presence of foreign firms also
creates productivity spillovers to other firms, which has been confirmed by a number
of empirical studies, particularly in China for example Liu (2008), Buckley, Clegg
and Wang (2007), Chuang and Hsu (2004), Liu (2002 ), and Li (2001). The C12 <0
captures productivity spillovers. An increase in foreign firm activities reduces the
marginal production cost.
Firm i's export cost function is ⎟
⎠ ⎞ ⎜
⎝ ⎛ =
∫
γ0
, q dj
e E
E i j with E1 >0, E11 >0, E2 <0,
0
22 <
E , and E12 <0. E1 >0 and E11 >0 show that firms’ export cost is increasing
in its export quantity at an increasing speed. E2 <0 and E22 <0 show that for a
given export quantity, the export cost is decreasing in foreign firms’ activities in the
industry, subject to a decreasing speed. Similar to the production cost, the presence of
foreign firms also reduces the marginal export cost (E12 <0). Foreign firms will have
better knowledge on foreign markets regarding the customer preference, packaging
requirements, and technical standards. Such knowledge can spill over to other firms
and thus reduce the fixed cost of exporting. The higher the foreign presence in the
industry, the easier and more effective one firm can mimic the exporting behavior of
foreign firms. Hence, the presence of foreign firms in the industry reduces not only
Firm i's problem is to choose its output and export quantities to maximize its profit,
given all the other firms’ output and export decisions, as follows:
{ }Π =
(
−)
⎛⎝⎜∫
− ⎞⎠⎟+ − ⎛⎝⎜∫
⎠⎞⎟− ⎛⎝⎜∫
⎞⎠⎟ γ γ0 0
1 0
, ( ) , ,
max i qi ei p qi ei di eiP C qi qjdj E ei qjdj
e qi i
Then domestic firms’ first order conditions (FOCs) are:
(
−)
− 1 =0+ q e p C p i i Q
(
−)
+ − 1 =0−
−p qi ei pQ P E
Foreign firms’ FOCs are:
(
−)
− 1− 2 − 2 =0+ q e p C C E p j j Q
(
−)
+ − 1 =0−
− p qj ej pQ P E
By symmetry, all domestic firms choose the same output and export quantities, and all
foreign firms choose the same output and export quantities. Let domestic firms’
choice be
(
qd,ed)
and foreign firms’ choice be(
qf,ef)
. The FOCs become:(
−)
− 1, =0+ qd ed pQ C d
p (1)
(
−)
+ − 1, =0−
−p qd ed pQ P E d (2)
(
−)
− 1, − 2, − 2, =0+ qf ef pQ C f C f E f
p (3)
(
−)
+ − 1, =0−
−p qf ef pQ P E f (4)
where C1,d and E1,d are the first derivative of the production and export cost
functions with respect to its first argument respectively, evaluated at domestic firms’
output and export quantities, and C1,f, C2,f , E1,f and E2,f are those evaluated at
Add equation (1) to equation (2) and equation (3) to equation (4), we obtain:
0
, 1 ,
1 − =
−C d E d
P (5) 0 , 2 , 1 , 2 ,
1 − − − =
−C f C f E f E f
P (6)
The first observation about equations (5) and (6) is that
(
qd,ed)
≠(
qf,ef)
, namelydomestic firms and foreign firms have different equilibrium choices of output and
export quantities, which occurs due to the asymmetric impact of foreign presence on
the production and export costs. Furthermore, if foreign firms have same output as
domestic firms, namely qf =qd, then foreign firms will always export more than
their domestic counterparts. This point can be shown by plugging qd =qf into
equations (5) and (6):
0 , 2 , 2 , 1 ,
1d −E f −E f −C f = E
which implies E1,d <E1,f as E2,f <0 and C2,f <0. Since 0
'' 11>
E , ed <ef.
Total differentiate equations (5) and (6) with respect to e and γ , holding qd and qf
constant, we can obtain:
0 , 11 , 12 ,
12 + >
− = f d d d d q E E C d de γ f f f f f f f f q E E E E C C d de , 12 , 11 , 22 , 12 , 22 , 12 + + + + − = γ
which shows that for an increase in the foreign presence γ , domestic firms will
increase their exports, while in contrast foreign firms’ decision is undetermined and
An increase in the foreign presence, γ , will affect firms through three channels: first
it reduces the exporting cost and thus makes exporting more profitable; second, it
drives up the production cost, reducing the overall profit; third, since the equilibrium
choices of domestic and foreign firms are different from each other, a change in the
foreign presence will create a demand side shock as =
(
qf −qd) (
+ ed −ef)
≠0d dQ
γ .
If qd =qf , an increase in γ will reduce the aggregate domestic sales and thus
increase the domestic price, making the domestic market more profitable. For
domestic firms, the first channel dominates the second and third channels.
In the model, we assume both domestic firms and foreign firms share the same
production and export cost functions. However if we allow for the possibility that they
are different, namely the production and export cost functions for domestic firms
being ⎟
⎠ ⎞ ⎜
⎝ ⎛
∫
γ0
, q dj
q
Cd i j and ⎟
⎠ ⎞ ⎜
⎝ ⎛
∫
γ0
, q dj
e
Ed i j respectively and those for foreign firms
being Cf
( )
qi and Ef( )
ei respectively with similar assumptions on the first, secondand cross derivatives, then the results of the model remain unchanged.
3. Econometric Specification and the Data
It is shown in section two that domestic firms respond to an increase in the presence
of foreign firms by increasing their export quantity due to the presence of positive
spillovers. To test this hypothesis, we set up the following econometric specification:
where the subscripts i and t denotes domestic firm and year respectively; EXPORTS is
domestic firms’ exports; firmsize, lp, age, k, averagewage, ownership, herfindale, oic,
lec, sei, and fp denote the firm size, labor productivity, firm age, capital intensity,
average wage, ownership structure, Herfindahl index, overall industry concentration,
local export concentration, relative total domestic exports, and foreign presence
respectively; dindustry and dyear are two sets of two-digit industry and year dummies
that control for the industry fixed effect and time varying effect respectively; αi is the
firm fixed effect, and ε denotes the i.i.d. normal error term.
The foreign presence (fp) is the variable of interest and is constructed as the share of
foreign firms’ output in the four-digit industries,
∑
∑
∈ ∈
=
J j
j I
i i
y y
fp , where y denotes
firm output, I denotes the set of foreign firms in the industry, J denotes the set of all
firms in the industry, and I ⊂J . A significant and positive estimate of its coefficient
indicates that an increase in the foreign presence leads to an increase in the export
quantity, thus confirming the hypothesis.
While we intend to examine the impact of foreign firms on domestic firms’ export
quantity, we meanwhile control for other factors that affect firm export quantity.
Selected according to previous studies, for example Aitken et al. (1997), Greenaway
et al. (2004), and Sun (2009), the control variables include firm characteristics (the
firm size, productivity, age, capital intensity, average wage, and ownership structure)
and industry variables (the Herfindahl index, overall industry concentration, local
Recent empirical and theoretical literature has shown that more productive and
efficient firms export more successfully as they are more capable of meeting the fixed
entry cost of exporting and overcoming other export barriers (Andrew B. Bernard and
J. Bradford Jensen, 1999, Sofronis K. Clerides, Saul Lach and James R. Tybout, 1998,
Gorg et al. 2008, Marc J. Melitz, 2003). Hence we expect the firm size, productivity,
capital intensity, and average wage to positively affect the export quantity. The firm
size is measured by the number of employees. The labor productivity is equal to value
added per worker. The capital intensity and average wage are equal to the fixed assets
and total salary divided by the number of employees respectively. We also include the
firm age as a control variable to account for the impact of both experience and
late-comer advantage. In China on the one hand, older firms may have more exporting
experience and thus tend to export more, while on the other hand younger firms may
just been established to serve foreign markets. Since these two channels exert
contrasting impact, we do not have prior expectation on the coefficient of the firm age.
The ownership structure (ownership) is a dummy variable that takes a value of 1 if the
firm is non-state and collectively owned, which controls for the different export
behavior between these two types of firms. In China, on the one hand it is easier for
the state and collectively owned firms to finance their export activities and thus easier
for them to overcome the fixed entry cost; on the other hand privately owned firms
are usually more competitive in the market.
In addition to the firm characteristics that affect export quantity, firms belonging to
different industries may have different export quantities, even when they are same as
The Herfindahl index, which is the sum of squared firm domestic market share,
captures the impact of market structure. In a more concentrated market, on the one
hand firms that enjoy domestic market power and have less incentive to explore the
world market, and on the other hand these firms tend to be big and are more capable
of exporting. The overall industry concentration (oic) is equal to the province-industry
(four digit) share of national industry employment divided by the province share of
national manufacturing employment, while the local export concentration (lec) is
equal to the province-industry (four digit) share of national industry exports divided
by the province share of national manufacturing exports. These two variables are
included to control for the possibility that firms located in an industry with
concentrated manufacturing and exporting activities are more likely to export (B.
Aitken, H. G. Hanson and A. E. Harrison, 1997) and tend to export more. It is also
likely that foreign firms tend to locate themselves into industries with high exports,
which if not controlled will lead to the endogeneity problem. Hence, as in Greenaway
et al. (2004), we include the relative total domestic exports, which is equal to the total
domestic exports in a four-digit industry divided by the total national domestic
exports, to control for the potential endogeneity.
We then employ a firm level balanced panel data set, which covers 3,300 domestic
firms from 2000 to 20071, to estimate the impact of foreign firms on domestic exports.
The panel data are constructed from a comprehensive micro data set that covers
China’s ‘above designated size’ firms and accounts for over 85 per cent of China’s
industrial output. China National Bureau of Statistics annually collects these data to
compile the ‘Industry’ section of the China Statistical Yearbook. Similar data from
1
the same source have been used to study other aspects of Chinese industrial economy,
for example, Hu, Jefferson, and Qian (2005) in the R&D and technology transfer,
Jefferson, Thomas, and Zhang (2008) in the productivity growth, and Sun (2009) in
the export spillovers of foreign direct investment.
Following Jefferson et al. (2008), we clean the data set by excluding firms (1) that
employ less than eight workers as they may not have reliable accounting systems, (2)
that report negative net values of fixed assets, non-positive outputs, value added, and
wages, and (3) that are located in the upper and lower tails (more than four standard
deviations from the mean) of the productivity distribution. Then we deflate all
monetary variables, such as the value added, to 2000 price using the producer price
index for manufactured goods obtained from China Statistical Yearbook 2008. The
industry variables, such as the foreign presence and Herfindahl index, are constructed
over the cleaned and deflated data set. After constructing all variables in equation (7),
we then extract a balanced panel data set where all firms have export records.
Creating a balanced panel data set allows us to avoid the complication of the impact
of firm entry and exit. All firms in the sample having export records allows us to
avoid the firm’s decision on whether to export and focus on the decision on how
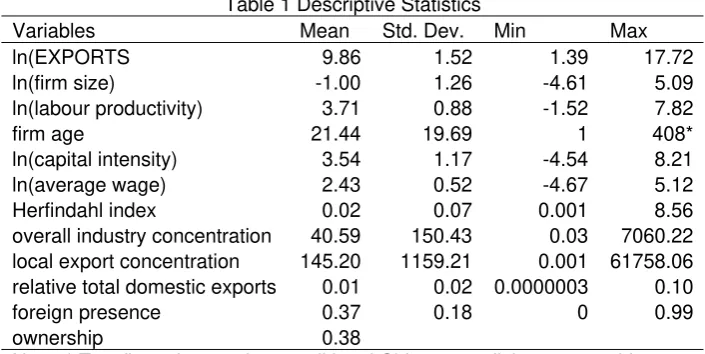
much to export. Table 1 presents the descriptive statistics of variables used in
estimation.
<insert Table 1 here>
4. Empirical Results
There exists potential endogeneity in estimating equation (7). First, while the more
productive firms tend to export more, the exporting experience will at the same time
improve their productivity level. Second, even though we include the relative total
domestic exports (sei) to control for the possibility that foreign firms tend to locate
themselves into industries with high exports, we may still fail to fully control for this
effect. Both of these lead to the endogeneity problem that needs to be addressed in the
estimation. In consideration of this, we adopt the following estimation strategy: (a)
first assume both the labour productivity and foreign presence are exogenous and
apply a fixed effect estimator to estimate equation (7); (b) then account for the
potential endogeneity problem by applying an instrumental variable (IV) estimator.
An endogeneity test is then carried out to determine which estimation is more
appropriate.
In step (a), it is possible that the idiosyncratic error term in equation (7) is serially
correlated and heteroskedastic. We thus conduct the Wooldridge (2002) test and a
modified Wald test to check for the AR(1) autocorrelation and groupwise
heteroskedasticity respectively. The Wooldridge test regresses the residuals,
calculated from the regression of the first-differenced variables, against their
one-period lags, and under the null hypothesis of no AR(1) autocorrelation the coefficient
estimated is -0.5, which can be tested using the usual t statistic. The Wooldridge test
is shown by Drukker (2003) to have good size and power properties with a reasonable
sample size, and is therefore applicable to our context since we have nearly 20
thousands observations. The test statistic obtained is 71.94 with a p-value of 0. For the
modified Wald test, the test statistic obtained is 4.6×10⁶ with a p-value of 0. Thus the
respectively at the 5 per cent level. Due to the existence of the autocorrelation and
heteroskedasticity, we calculate the heteroskedaticity and autocorrelation robust
standard errors in the estimation, using a procedure provided bySchaffer (2007).
In step (b), we carry out the IV estimation using the Schaffer (2007) procedure, where
we use the one-year lagged labour productivity, foreign presence, and number of
firms in the four digit industry as the instruments, and calculate the heteroskedasticity
and autocorrelation robust standard errors since there is evidence of heteroskedasticity
and autocorrelation in the step (a). We conduct a feasible efficient two-step
generalized method of moments (GMM) IV estimation. The GMM IV estimation is
more efficient than the two-step least square IV estimation if there exist
heteroskedasticity and autocorrelation (C. F. Baum et al., 2007). Since the instruments
need to be relevant (correlated with the endogenous variables), we check the
relevance of the instruments by examining the fit of the first stage regression. In the
first stage regression, the Bound, Jaeger, and Baker (1988) partial R-square and the
Shea (1997) partial R-square are both 0.24 for the foreign presence and 0.09 for the
labour productivity, and the F statistic for the joint significance of the instruments is
179.82 with a p-value of 0 for the foreign presence and 83.05 with a p-value of 0 for
the labour productivity. Therefore the instruments are relevant. The instruments also
need to be valid (uncorrelated with the error terms). As the number of instruments
exceeds the number of endogenous variables, we are able to test the validity of
instruments as an overidentification test, using the Hansen (1982) J statistic, which is
2
χ distributed with degrees of freedom equal to the number of overidentifying
cent significance level, we fail to reject the null hypothesis of orthogonality between
the instruments and the error terms.
Finally we need to determine whether the step (a) or step (b) is more appropriate. This
is done by an endogeneity test, namely using the C statistic (Martin S. Eichenbaum,
Lars Peter Hansen and Kenneth J. Singleton, 1988, F. Hayashi, 2000) to test the
orthogonality of the endogenous variables. We obtain a C statistic of 24.01 with a
p-value of 0, which rejects the null hypothesis of orthogonality of the endogenous
variable at the 5 per cent level. Thus we conclude that the GMM IV estimator is more
appropriate to estimate equation (7).
4.2 The impact of foreign firms on domestic exports
Table 2 reports the estimation results, with the first column presenting the estimation
at the step (a) and the second column presenting the estimation at the step (b). Since
we have determined the step (b) is more appropriate, the following interpretations will
be based on the step (b), while the step (a) is presented for the sake of comparison.
The estimated coefficient of foreign presence is 0.74 with a t statistic of 2.79, which is
significant at the 5 per cent level. Hence a 1 per cent increase of the foreign presence
will encourage domestic exporting firms to increase their export quantity by 0.74 per
cent. In the past three decades, China’s rapid growth in exports has been coupled with
a fast inflow of foreign direct investment. From 1991 to 2007, the average
actually-utilized foreign direct investment is as high as 43.5 billion US dollars, with an average
per annum on average, and the average exports are 356 billion US dollars. The
correlation between the exports and inflow of foreign direct investment is as high as
0.8. The positive and significant estimate of the coefficient of foreign presence
confirms that one contribution to this close relationship is foreign firms’ positive
impact on exports of domestic firms. Despite the inflow of foreign direct investment
can drive up the production cost, benefitting from the positive productivity spillovers
and export market information dissemination, domestic exporting firms respond by
increasing their exports.
<insert Table 2 here>
The estimated coefficients for the control variables are largely consistent with our
expectation. The firm size, productivity, and average wage are found to significantly
and positively affect export quantity, indicating that more efficient and productive
firms export more. The capital intensity has no significant impact on the exports. The
firm age turns out not to significantly affect the export quantity, as the estimated
coefficient is insignificant at the 5 per cent level, indicating that the late-comer
advantages of younger firms cancel out with the importance of experience of older
firms. The coefficient of ownership structure is negative and significant at the 10 per
cent level, implying that the state and collectively owned firms export more than their
privately owned counterparts. This is more or less surprising as we would expect
private firms are more competitive in the market, but nevertheless can occur if for the
firms in our sample, financing in the process of export is important. The state and
collectively owned firms in China have better financing capacity than their privately
The impact of overall industry concentration is found to be positive and significant at
the 5 per cent level. A firm that is located in an industry with more concentrated
manufacturing activities exports more than a firm that is not. In contrast, the local
export concentration appears not to have the same impact as its estimated coefficient
is insignificant. The market structure, captured by the Herfindahl index, also appears
not to significantly affect the export quantity. Belonging to a more export-oriented
industry boosts their export quantity, which is confirmed by the positive and
significant estimate of the coefficient of the relative total domestic exports.
5. Concluding Remarks
We explore the impact of foreign firms on the export quantity of domestic exporting
firms. Due to positive spillovers from foreign firms, domestic firms respond to an
increase in the presence of foreign firms by increasing their exports, despite the
increase in foreign presence can drive up the production cost and make domestic
market more profitable. This hypothesis is then tested using a rich firm level balanced
panel data set in China. Our results suggest that a 1 per cent increase in foreign
presence brings in 0.74 per cent increase in domestic exports, which, from a micro
perspective, sheds light on understanding China’s massive exports and fast inflow of
Table 1 Descriptive Statistics
Variables Mean Std. Dev. Min Max
ln(EXPORTS 9.86 1.52 1.39 17.72
ln(firm size) -1.00 1.26 -4.61 5.09
ln(labour productivity) 3.71 0.88 -1.52 7.82
firm age 21.44 19.69 1 408*
ln(capital intensity) 3.54 1.17 -4.54 8.21
ln(average wage) 2.43 0.52 -4.67 5.12
Herfindahl index 0.02 0.07 0.001 8.56
overall industry concentration 40.59 150.43 0.03 7060.22
local export concentration 145.20 1159.21 0.001 61758.06
relative total domestic exports 0.01 0.02 0.0000003 0.10
foreign presence 0.37 0.18 0 0.99
ownership 0.38
Table 2 Estimation Results
(a) (b)
Variables Coefficient Std. Err. t Coefficient Std. Err. t
ln(firm size) 0.80* 0.02 44.16 0.88* 0.04 24.29
ln(labour productivity) 0.400* 0.0100 29.98 0.69* 0.07 9.78
age -0.0005 0.0008 -0.62 -0.001 0.001 -1.06
ln(capital intensity) 0.05* 0.01 4.28 0.01 0.02 0.48
ln(average wage) 0.17* 0.020 9.27 0.07** 0.04 1.66
ownership -0.06* 0.02 -2.93 -0.06** 0.06 -1.74
Herfindahl index -0.01 0.04 -0.28 0.05 0.05 0.93
oic 0.00008 0.00007 1.11 0.0003* 0.0001 2.17
lec -0.000003 0.00001 -0.31 0.000004 0.00002 0.21
sei 8.20* 0.65 12.63 9.41* 1.25 7.53
foreign presence 0.38* 0.08 4.96 0.74* 0.26 2.79
industry dummies yes yes
year dummies yes yes
Centered R-square 0.30 0.25
F statistic 111.27 27.78
No. of Obs 19793 9900
References:
Aitken, B.; Hanson, H. G. and Harrison, A. E. . "Spillovers, Foreign Investment,
and Export Behavior." Journal of International Economics, 1997, 43(1), pp. 103-32.
Baum, C. F.; Schaffer, M. E. and Stillman, S. "Enhanced Routines for Instrumental
Variables/Generalized Method of Moments Estimation and Testing." The Stata
Journal, 2007, 7(4), pp. 465-506
Bernard, Andrew B. and Jensen, J. Bradford. "Exceptional Exporter Performance:
Cause, Effect, or Both?" Journal of International Economics, 1999, 47 1, pp. 1-25.
____. "Why Some Firms Export." Review of Economics and Statistics, 2004, 86 2, pp.
561-69.
Blomstrom, Magnus and Kokko, Ari. "Multinational Corporations and Spillovers."
Journal of Economic Surveys, 1998, 12 3, pp. 247-77.
Buckley, P. J.; Clegg, J. and Wang, C. "Is the Relationship between Inward Fdi and
Spillover Effects Linear? An Empirical Examination of the Case of China." Journal of
International Business Studies, 2007, 38(3), pp. 447-59.
Chuang, Y. and Hsu, P. . "Fdi, Trade, and Spillover Efficiency: Evidence from
China's Manufacturing Sector." Applied Economics, 2004, 36, pp. 1103-15.
Clerides, Sofronis K.; Lach, Saul and Tybout, James R. "Is Learning by Exporting
Important? Micro-Dynamic Evidence from Colombia, Mexico, and Morocco."
Quarterly Journal of Economics, 1998, 113 3, pp. 903-47.
Drukker, D. M. . "Testing for Serial Correlation in Linear Panel-Data Models." Stata
Journal, 2003, 3, pp. 168-77.
Eichenbaum, Martin S.; Hansen, Lars Peter and Singleton, Kenneth J. "A Time
Series Analysis of Representative Agent Models of Consumption and Leisure Choice
Gorg, Holger; Henry, Michael and Strobl, Eric. "Grant Support and Exporting
Activity." Review of Economics and Statistics, 2008, 90 1, pp. 168-74.
Greenaway, D.; Sousa, N. and Wakelin, K. "Do Domestic Firms Learn to Export
from Multinationals?" European Journal of Political Economy, 2004, 20(4), pp.
1027-43.
Greenaway, David and Kneller, Richard. "Firm Heterogeneity, Exporting and
Foreign Direct Investment." Economic Journal, 2007, 117 517, pp. F134-61.
Hansen, Lars Peter. "Large Sample Properties of Generalized Method of Moments
Estimators." Econometrica, 1982, 50 4, pp. 1029-54.
Hayashi, F. .Econometrics, 1st Ed. Princeton, NJ: Princeton University Press, 2000.
Hu, A. G. Z.; Jefferson, G. H. and Qian, J. . "R&D and Technology Transfer:
Firm-Level Evidence from Chinese Industry." Review of Economics and Statistics, 2005,
87(4), pp. 780-86.
Jefferson, G. H.; Thomas, G. R. and Zhang, Y. . "Productivity Growth and
Convergence across China's Industrial Economy." Journal of Chinese Economic and
Business Studies, 2008, 6(2), pp. 121-40.
Kneller, Richard and Pisu, Mauro. "Industrial Linkages and Export Spillovers from
Fdi." World Economy, 2007, 30 1, pp. 105-34.
Krugman, Paul R. "Increasing Returns, Monopolistic Competition, and International
Trade." Journal of International Economics, 1979, 9 4, pp. 469-79.
Li, X.; Liu, X. and Parker, D. . "Foreign Direct Investment and Productivity
Spillovers in the Chinese Manufacturing Sector." Economic System, 2001, 25, pp.
305-21.
Liu, Z. "Foreign Direct Investment and Technology Spillover: Evidence from China."
Liu, Z. . "Foreign Direct Investment and Technology Spillovers: Theory and
Evidence." Journal of Development Economics, 2008, 85(1-2), pp. 176-93.
Melitz, Marc J. "The Impact of Trade on Intra-Industry Reallocations and Aggregate
Industry Productivity." Econometrica, 2003, 71 6, pp. 1695-725.
Roberts, Mark J. and Tybout, James R. "The Decision to Export in Colombia: An
Empirical Model of Entry with Sunk Costs." American Economic Review, 1997, 87 4,
pp. 545-64.
Schaffer, M.E. . "Xtivreg2: Stata Module to Perform Extended Iv/2sls, Gmm and
Ac/Hac, Liml and K-Class Regression for Panel Data Models. ," 2007.
Shea, J. . "Instrument Relevance in Multivariate Linear Models: A Simple Measure."
Review of Economics and Statistics, 1997, 79(2), pp. 348-52.
Sun, S. "How Does Fdi Affect Domestic Firms' Exports? Industrial Evidence." World
Economy, 2009, 32(8), pp. 1203-22.
Wooldridge, J. M. .Econometric Analysis of Cross Section and Panel Data.