Munich Personal RePEc Archive
Measuring the Cost of International
Trade in Services
Miroudot, Sébastien and Sauvage, Jehan and Shepherd, Ben
22 December 2010
Measuring the Cost of International Trade in Services
Sébastien Miroudot, Jehan Sauvage, and Ben Shepherd
∗October 4, 2010
Abstract
We present a new dataset of international trade costs in services sectors. Using a theory-based methodology combined with data on domestic shipments and cross-border trade, we find that trade costs in services are much higher than in goods sectors: a multiple of two to three times in many cases. Trade costs in services have remained relatively steady over the last ten years, whereas trade costs in goods have fallen overall at an impressive rate. We also present two examples of the ways in which our dataset could be used in future work. First, we examine the impact of regional trade agreements on trade costs in services. Although we find that intra-bloc trade costs are lower than those facing outside countries, the differential is usually quite small for services, and in some cases has even been narrowing over time. This finding accords with the observation that because service sector reform is about re-regulation, “preferential” agreements tend to involve less discrimination than in goods markets. Second, we show for the first time that services sectors with lower trade costs tend to be more productive, and experience faster productivity growth. This result lines up well with the evidence from goods markets.
JEL Codes: F13; F15.
Keywords: Trade policy; Trade in services; Regional integration; Productivity.
1
Introduction
Nearly two-thirds of all economic activity in the G-20—and over three-quarters in France, the
USA, and the UK—is made up of services. So it is striking that while goods exports account for
nearly 20% of the G-20’s combined GDP, the corresponding figure for services is less than 5%.
Although services trade was growing rapidly prior to the full onset of the Global Financial Crisis
crisis—by 19% in 2007, according to the WTO—it still represents a surprisingly modest share of
the international economy (WTO, 2009).
The question, of course, is: why? It is tempting to argue that a large part of the services sector is
non-tradable. This is becoming less true over time, however. The traditional example of a haircut is
instructive. In today’s economy, a haircut is tradable in a number of ways. When a Paris stylist flies
to Los Angeles to work on an American movie set, there is trade in services under GATS Mode
IV. When an American salon chain opens a store in Europe or Japan, sales by its foreign affiliate
are considered to be trade in services under GATS Mode III. So although some services are traded
in only small quantities relative to domestic production, it is not because they are strictly speaking
non-tradable. Rather, it is only under special circumstances that they can beprofitablytraded.
More generally, this analysis suggests that a large part of the explanation for why services trade is
so much smaller in value than goods trade must lie in trade costs, i.e. the full range of costs a firm
confronts when it decides to sell its services overseas. In goods markets, these costs include tariffs,
non-tariff measures, transport charges, costs imposed by “behind-the-border” regulatory measures,
and costs related to geographical, cultural, and institutional differences. In services sectors, trade
costs are largely related to regulatory measures that either create entry barriers or increase the cost
burdens facing firms, in addition to geographical, cultural, and institutional differences.
Some sources of trade costs are relatively easy to quantify. Ad valorem tariffs are an example.
However, many trade costs in both goods and services stem from regulatory measures, and thus
are much more difficult to quantify. Previous attempts at quantification of the barriers to trade
constructed inventories of regulatory measures and summarized them in index form (see Dee, 2003
for a review). Although both approaches have made it possible to obtain a basic idea of the nature
and extent of trade costs in services, the academic and policy communities are still far from an
understanding of international services markets comparable to that of goods markets.
This paper provides some of the first systematic evidence on the level of trade costs in international
services markets. We find that they are very high compared with goods, perhaps twice or three
times as high in ad valorem terms. This difference goes part of the way towards explaining why
goods trade still dominates services trade so strongly in the global economy.
We also find that trade costs in goods and services change very differently over time. During the last
decade, overall trade costs in goods markets have fallen by nearly 15% on a worldwide basis. But
in services, they have remained essentially stable. In some sectors, such as construction, they have
even increased markedly. Among major trading economies, the only exception to this rule is China:
partly as a result of signing a WTO Accession Agreement with real “bite” in services, trade costs
in services between China and the rest of the world have fallen noticeably. Unilateral liberalization
and the efforts of the private sector have also contributed to this outcome. This finding suggests
an important role for external commitment mechanisms in supporting trade facilitation in services.
The contrast with the currently lackluster progress of the WTO’s services negotiations–which could
clearly provide a major impetus for reform–is striking.
This paper builds on and extends previous work by applying a theory-consistent, and
comprehen-sive measure of trade costs. Our measure is “top down” in the sense that it infers trade costs from
observed patterns of trade and production. This approach contrasts with the “bottom up” approach
of most previous work on trade costs in services, which has started by coding qualitative data on
regulatory measures and then estimating their economic impact based on summary measures of
restrictiveness.
In concrete terms, our methodology has three important advantages. First, our “top down”
captures the costs related to certain types of regulatory measures, but cannot be said to have
pro-duced comprehensive estimates of trade costs in services.
Second, our methodology is theory-based, and relies on an identity relationship rather than
econo-metric estimation. Previous work that infers trade costs from gravity model estimates tends to
confound true trade costs with noise in the data, which results in estimates that are difficult to
interpret. Of course, the cost of relying heavily on theory is that if it is incorrect, then the
decom-position might also be erroneous. However, Novy (2009) shows that the approach we use here
can be applied successfully to a variety of theoretical models of trade; it obviously captures a deep
regularity in the relationship between trade costs, production, and trade flows. He also shows that it
is highly robust to the possibility of measurement error. As a result, we are confident that our
mea-sures represent the best data currently available on the level of trade costs in international services
markets.
Third, our approach has very limited data requirements. Using easily obtainable data from national
accounts and trade databases, we can calculate trade costs for a wide variety of countries over a
relatively long time period–a first in the services trade literature. The main limitation of our data
is that they focus on GATS Modes 1-2, namely pure cross-border services trade, and transactions
involving movement of the consumer (as reflected in balance of payments data). Comparable
infor-mation on GATS Modes 3-4 is not yet available across a wide enough variety of countries, sectors,
and years to make a similar analysis feasible.1 Nonetheless, the availability of our trade cost
mea-sures opens up a variety of paths for research on trade in services, which to date has been heavily
constrained by the relative lack of availability of panel data.
As examples of the kinds of research questions that can be addressed using these data, we
con-duct two econometric analyses of issues that have thus far received scant attention in the services
literature due to lack of data. The first examines the impact of regional trade agreements (RTAs)
on trade costs in services–and we find that although they have to some extent reduced within-bloc
1An interesting avenue for further research would be to apply our approach to data on FDI. In services sectors, FDI
trade costs, the differential is not as large as might be expected. The second question we consider
is the relationship between trade costs and productivity in services sectors. As in goods sectors, we
find that lower trade costs are associated with higher productivity, and faster productivity growth.
The next section provides some descriptive results on trade costs in services using our new data.
Section 3 examines the links between RTAs and trade costs in services. Section 4 looks at trade
costs and productivity in services sectors. Section 5 concludes, and discusses possible directions
for future research in this area.
2
Trade costs in services, 1995-2007
2.1
Methodology
Starting from the standard, theory-consistent gravity model of Anderson and Van Wincoop (2003),
Novy (2009) develops a comprehensive measure of bilateral trade costs.2 Equation 1 presents that
measure in ad valorem equivalent terms. It is the geometric average of bilateral trade costs for
exports from countryito countryjand from countryjto countryi, expressed relative to domestic
trade costs in each country (ti j
tii and
tji
tj j respectively). To calculate it, all that is required is data on
domestic production relative to exports in both countries (xii
xi j and
xj j
xji respectively). The parameter
σ is the elasticity of substitution among varieties in a sector, assuming the Anderson and Van
Wincoop-based derivation of Novy’s measure of trade costs. The parameter γ is a measure of
firm-level heterogeneity if the model is instead derived from Chaney (2008).
τi jkt =
ti jkt.tjikt
tiikt.tj jkt
12
−1=
xiikt.xj jkt
xi jkt.xjikt
2(σ1
−1)
−1=
xiikt.xj jkt
xi jkt.xjikt
21γ
−1 (1)
Intuitively, Novy’s measure captures the fact that if a country’s trade costs vis-à-vis the rest of the
2In fact, Novy (2009) shows that basically the same measure can be derived from a wide variety of theoretical
world fall, then a part of its production that was previously consumed domestically will instead be
shipped overseas. Trade costs are thus closely related to the extent to which a country trades with
itself rather than other countries, and data on this kind of relative openness can be used to make
inferences about the level of trade costs and their variation over time.
This approach has three main advantages over the readily available alternatives. First, it represents
a comprehensive measure of the full range of trade costs, namely the costs of providing goods or
services across borders relative to the costs of providing them within countries. In goods markets, it
captures international shipping—as in work using CIF/FOB ratios—but also a much wider variety
of cost factors (see Anderson and van Wincoop, 2004 for a full review). In services, it takes
account of factors such as: geographical, cultural, and linguistic distance; regulatory barriers to
trade; regulatory heterogeneity; access to finance for accessing new markets; differences in business
and investment climates; and other behind-the-border measures that have asymmetric impacts on
domestic and foreign suppliers. Even the effects of regulatory measures that are discriminatory in
fact but not in law are included in this measure of trade costs.
The second advantage of Novy’s measure is that its data requirements are minimal. As a result,
it is feasible to obtain measures of trade costs in services sectors, where data availability is much
more limited than for goods. We are thus able to obtain data on production, exports, and trade costs
across a wide variety of countries, sectors, and time periods.
Third, Novy’s measure relies on a theory-based rearrangement of data, rather than econometric
estimation. It thus does not suffer from the possibility of omitted variables bias, which potentially
affects traditional gravity models of services markets.3 Another potential problem with gravity
model-based estimates of trade costs such as Walsh (2006) is that they tend to confound trade
restrictions and noise in the data, both of which are associated with trade flows that diverge from
expected values based on model estimates.
Using the methodology described in the Appendix, we construct Novy (2009) measures of trade
3Novy (2009) shows that even allowing for measurement error does not introduce substantial uncertainty into
costs in services covering up to 61 countries and 12 services sectors. As a point of comparison, we
also compile data on 17 goods sectors. Data at this level of detail are only available for a subset of
countries, however, and so we also use an aggregate version of the data. This approach allows us
to expand the analysis to other countries for which disaggregated output data are unreliable and/or
relatively unavailable.
The next subsection briefly describes the outcome of that exercise, focusing on the major trading
economies. In each case, we are careful to use a consistent sample, in the sense of
country-partner-sector combinations that are observed consistently over the full time period for which the analysis
is presented. This limitation is important in order to avoid entry and exit of countries or sectors
from the sample, with corresponding changes to measured trade costs that reflect that dynamic
rather than the underlying situation.
In all calculations, the elasticity of substitutionσ is set equal to 8, which is the same rule of thumb
used by Novy (2009). It is very close to the typical country’s average elasticity of substitution
reported by Broda et al. (2006) of 6.8. Settingσ =8 is equivalent to settingγ =7, which is also
reasonable in light of previous work on firm level productivity distributions.4 Although ad valorem
equivalents are quite sensitive to the value chosen for σ orγ, using indices relative to a base year
reduces that problem to economically insignificant levels. For example, using σ =10 results in
substantially different estimated worldwide ad valorem equivalents for services: 106% in 1995 and
107% in 2007, compared with 153% and 155% respectively with σ =8. However, the change
in those numbers over time is nearly identical: 1.3% versus 1.4%. The next subsection presents
results using both methods.
4The work referred to in this paragraph relates exclusively to goods markets. We are not aware of any comparable
2.2
Descriptive Results
First, Table 1 column 1 compares our results with those reported in Novy (2009) for USA trade
costs in goods vis-a-vis its major trading partners. Ours are generally very close to his, although
slightly higher in some cases. This finding provides reassurance that our new data, which cover
a much broader range of countries and sectors than previous estimates, are reliable with regard
to existing work. It is worth stressing that the relatively high numbers reported in Table 1 reflect
the full range of cost factors that affect international transactions, not just protection (i.e. tariffs
in the case of goods markets).5 Based on a comprehensive review of the literature, Anderson and
van Wincoop (2004) estimate that international trade costs of the type we are measuring amount to
around 74% in ad valorem equivalent terms for goods markets. Our number is thus slightly lower
than theirs, even though both figures may seem high to those used to discussing rates of protection
in advanced countries, which are generally in single digits.
The standout result from Table 1 is that the level of trade costs is much higher in services sectors
than in goods–about double, on average, for the US and its major trading partners. The same result
emerges from Table 2, which compares trade costs of major trading economies vis-a-vis the rest
of the world. The absolute levels of trade costs in services are very high: over 100% in all cases,
and over 200% for India. These figures should be interpreted with caution, since they rely on an
assumption as to the value of the elasticity of substitution, and on an assumption that it is the same
in goods and services sectors. But even if the numbers are subject to uncertainty, the relative pattern
of trade costs is clear: they are much higher in services sectors than in goods sectors.
At first glance, the results in Table 1 might appear surprising: even between two markets that
are close geographically and culturally, and that are perceived to be relatively open–the USA and
Canada–there are trade costs in services of around 100%, compared with only 30% in goods. It
is important to remember, however, that this number is not a measure of protection; rather, it
5For goods markets, it would in principle be possible to net out the effect of tariffs so as to arrive at a figure for
Table 1: Comparison of trade costs in goods and services, USA vis-a-vis major partners, 2000. (Percent ad valorem equivalent.)
Partner Goods (Novy) Goods (Us) Services
Canada 25 29 100
Germany 70 70 121
Japan 65 66 125
Korea 70 70 122
UK 63 68 111
Simple average 59 61 116
Table 2: Comparison of trade costs in goods and services, major trading economies vis-a-vis the rest of the world, latest year. (Percent ad valorem equivalent.)
Country Goods Services Services (Walsh, 2006)
USA 91 144 77
Canada 77 165 82
EU 72 143 n/a
Japan 100 173 0
China 91 183 121
India 139 205 114
Simple average 95 169 79
encompasses all types of trade costs.
The same reasoning applies to the estimates in Table 2. It is to be expected that the measures
we present will be substantially higher than, for example, the ad valorem equivalents reported by
Walsh (2006) for services markets. Taking that author’s results as a measure of protection, it is
by no means unrealistic that additional trade costs–i.e. those not related to direct trade protection–
should add an additional 70% or so to the overall level of trade costs for the USA vis-a-vis the rest
of the world. The comparison with goods markets is again instructive. The World Bank’s Overall
Trade Restrictiveness Index suggests a protection rate in the USA of a little over 6% for goods, but
total trade costs are more on the order of 60%. So in ad valorem terms, total trade costs in services
are perhaps double the rate of protection, whereas in goods the multiple is more like ten times.
As noted above and in the Appendix, our calculation of the level of trade costs in ad valorem
equivalent terms is sensitive to our assumed value forσ, the intra-sectoral elasticity of substitution,
[image:10.612.150.461.259.377.2]Figure 1: World aggregate trade costs indices for goods and services, 1995-2007 (1995=100). 8 5 9 0 9 5 1 0 0 1 0 5 T ra d e c o s ts i n d e x ( 1 9 9 5 = 1 0 0 )
1995 2000 2005 2010
Year
Goods Services
index numbers–the sensitivity problem practically disappears. Index number results are very close
for values ofγ in the range five to nine, around our central value of seven (as in Novy, 2009).
The index number approach is useful for examining performance over time (Figure 1 through
Fig-ure 5). We see that on a world aggregate basis (FigFig-ure 1), trade costs in goods have declined by
more than 15% over the last ten years. The same is by no means true for services: trade costs have
barely moved over the last decade, and if anything, may have slightly increased. The same pattern
emerges for most of the major trading economies in the next set of figures. It is interesting to note
that the US services index declines by a few points over the period 1995-1998, but the EU index
does not–even though this period should coincide with realization of the full impact of the 1992
program on the internal market in services.
The obvious exception to the pattern described above and in Figure 1 through Figure 4 is China
(Figure 5): trade costs have declined substantially in services markets as well as in goods. It is
Figure 2: US trade cost indices for goods and services, 1995-2007 (1995=100). 9 0 9 5 1 0 0 1 0 5 T ra d e c o s ts i n d e x ( 1 9 9 5 = 1 0 0 )
1995 2000 2005 2010
Year
Goods Services
Figure 3: EU trade cost indices for goods and services, 1995-2007 (1995=100).
8 5 9 0 9 5 1 0 0 1 0 5 T ra d e c o s ts i n d e x ( 1 9 9 5 = 1 0 0 )
1995 2000 2005 2010
Year
[image:12.612.74.475.415.713.2]Figure 4: Japan trade cost indices for goods and services, 1995-2007 (1995=100). 9 6 9 8 1 0 0 1 0 2 1 0 4 T ra d e c o s ts i n d e x ( 1 9 9 5 = 1 0 0 )
1995 2000 2005
Year
Goods Services
levels of trade costs relative to other major economies. So there is still considerable room for
further reductions. Nonetheless, the proportional reductions since 2000 are impressive.
The second caveat is that the trade costs that we are measuring represent an average of trade costs
facing foreign producers exporting to China, and trade costs facing Chinese firms exporting to other
countries. Thus, we cannot conclude that the very large trade cost reductions observed for China are
solely due to policy reforms undertaken at home. They are also linked to trade cost reductions by
China’s trading partners following accession to the WTO, which provided China with permanent
MFN status.
Nonetheless, our findings are in line with recent work suggesting that the terms of China’s WTO
Accession Agreement had real “bite” in services, in the sense that they required significant
lib-eralization of applied policies (Mattoo, 2004). This is in stark contrast to most countries’ GATS
schedules submitted at the end of the Uruguay Round: they established binding policy ceilings, but
Figure 5: China trade cost indices for goods and services, 1995-2007 (1995=100).
8
5
9
0
9
5
1
0
0
T
ra
d
e
c
o
s
ts
i
n
d
e
x
(
1
9
9
5
=
1
0
0
)
2000 2001 2002 2003 2004 2005
Year
Goods Services
Uruguay Round has been undertaken unilaterally or preferentially, and it is therefore not surprising
that for other countries, changes in trade costs on a multilateral basis have been limited.
Another case that is deserving of attention is that of the EU. Since trade policies are set in Brussels,
one might expect a certain level of uniformity of trade costs with respect to the rest of the world.
However, this is not the case. First, different countries display highly divergent levels of trade
costs in goods and services markets alike. Germany, for instance, has tariff equivalents of 65% and
127% for goods and services respectively for 2007. The same figures for another large Eurozone
economy, France, are 91% and 168%, while for a small economy like Ireland, they are 114% and
165%. For a “new” EU member like Poland, the tariff equivalents are 75% and 144%. This pattern
suggests that there are a range of factors that influence trade costs, but which remain heterogeneous
at the level of individual member states. It is beyond the scope of this paper to delve into the
reasons for that heterogeneity in detail, but it seems likely that future work could uncover evidence
trade costs, but which are not fully encompassed in the EU’s common trade policy.
In addition, we find that changes in services trade costs over time are also very different across EU
countries (Figure 6 - Figure 9). There are substantial reductions in trade costs between 1995 and
2007 in Germany, Ireland, and Poland, but a noticeable increase over the same period in France.
This is in marked contrast with goods markets, where all four economies register substantial
de-clines in trade costs. Although more in-depth analysis is needed before drawing any firm
conclu-sions, this heterogeneity in time paths suggests that member states may have taken substantially
different tracks in implementing the single market for services, and that significant imperfections
remain (witness the aborted Bolkestein Directive).
Finally, the case of Poland is interesting for what it can potentially say about the process of EU
accession. In services markets, we see that trade costs only started to fall rapidly from about 2002
onwards. The changes for 2002-03 and 2003-04 were particularly large, on the order of 5% each
year. The rate of decline in goods trade costs, however, is much more consistent over the full
sample. This example tends to suggest that the degree of “bite” in the single market for goods is
substantially greater than that of the single market for services: the process of acceding to the EU
is associated with a consistent decline in trade costs of over 25% for goods, but a stop-and-start fall
of less than 20% for services.
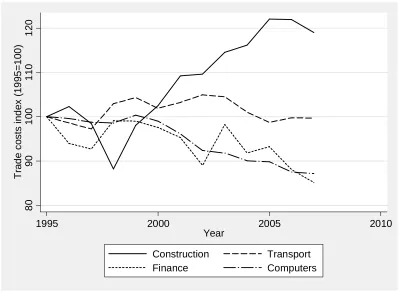
The index number approach is also useful for examining the evolution of sectoral trade costs over
time. As an example, Figure 10 presents a comparison between construction, transport, financial,
and computer services. Trade costs in construction services have increased markedly over the last
decade, by nearly 20%. Construction is also the most insulated sector, with ad valorem equivalent
trade costs of around 200%. Of course, performance is likely to vary markedly across countries; the
figure presents aggregate data for the world as a whole, and therefore includes relatively restricted
as well as fairly open markets.
None of the other three sectors exhibits a substantial increase in trade costs over time. Trade costs
in transport services have remained approximately constant over the last decade. By contrast, trade
Figure 6: Germany trade cost indices for goods and services, 1995-2007 (1995=100). 8 0 8 5 9 0 9 5 1 0 0 T ra d e c o s ts i n d e x ( 1 9 9 5 = 1 0 0 )
1995 2000 2005 2010
Year
Goods Services
Figure 7: France trade cost indices for goods and services, 1995-2007 (1995=100).
8 5 9 0 9 5 1 0 0 1 0 5 1 1 0 T ra d e c o s ts i n d e x ( 1 9 9 5 = 1 0 0 )
1995 2000 2005 2010
Year
[image:16.612.75.476.414.711.2]Figure 8: Ireland trade cost indices for goods and services, 1995-2007 (1995=100). 7 0 8 0 9 0 1 0 0 T ra d e c o s ts i n d e x ( 1 9 9 5 = 1 0 0 )
1995 2000 2005 2010
Year
Goods Services
Figure 9: Poland trade cost indices for goods and services, 1995-2007 (1995=100).
7 5 8 0 8 5 9 0 9 5 1 0 0 T ra d e c o s ts i n d e x ( 1 9 9 5 = 1 0 0 )
1995 2000 2005 2010
Year
[image:17.612.75.473.417.712.2]Figure 10: Trade costs indices for construction services, transport services, financial services, and computer services, 1995-2007 (1995=100).
8 0 9 0 1 0 0 1 1 0 1 2 0 T ra d e c o s ts i n d e x ( 1 9 9 5 = 1 0 0 )
1995 2000 2005 2010
Year
Construction Transport
Finance Computers
consistent with the rise of outsourcing in those sectors over roughly the same time period: as
trade costs fall, probably due to improved information and communications technologies (ICTs), it
becomes feasible for firms to have more of these kinds of tasks performed overseas. Sectors such
as transport and construction, on the other hand, are largely immune to such developments because
of the need for physical proximity between producer and consumer.
3
Trade costs and regional trade agreements
In this section, we analyze the impact of regional trade agreements (RTAs) on bilateral trade costs,
as a first example of the potential uses to which our new data can be put. Figure 11 shows the
evolution of trade costs within RTAs and outside RTAs over the period 2000-2007. Average trade
average across sectors and partners that is calculated separately for pairs of countries within RTAs
and pairs of countries that are not part of an RTA.6 We include only country pairs for which we
have information for all years so that changes in the composition of the two groups only reflect
[image:19.612.167.449.179.400.2]changes in RTA membership.
Figure 11: Trade costs within and outside RTAs
Figure 11 shows that trade costs are on average lower within RTAs. For 2007, trade costs within
RTAs represent a tariff-equivalent of 82%, while outside RTAs the tariff equivalent is 110%.7
Re-gionalism can therefore be understood as having a real impact on trade costs. The discrepancy
between trade costs within and outside RTAs is the same at the beginning and at the end of the
period. The increase in the number of RTAs that have entered into force, as well as the deepening
of some of these RTAs (such as new Member states in the EU), had no significant impact on trade
costs. Figure 11 basically shows two flat lines.
Focusing now on trade costs in services industries, Figure 12 shows that trade costs are generally
higher for services with tariff-equivalents reaching 127% outside RTAs and 121% within in 2007.
The difference between trade costs within and outside the RTA is less important for services than
for goods. Services RTAs appear less preferential and, taking into account the high level of trade
Figure 12: Trade costs for services industries within and outside services RTAs
costs in services, do not offer clearly improved market access for foreign services providers. What
is also interesting in Figure 12 is that the gap between trade costs within and outside RTAs has been
decreasing for services industries. The sample of countries is the same for all years, so the only
compositional change that could explain the convergence in the two curves would be that RTAs
recently signed are on average less preferential or less effective in reducing trade costs.
While the above figures already highlight the impact of RTAs on trade costs, an econometric
anal-ysis can tell us more by controlling for a certain number of variables that could explain the trends
observed, beyond the entry into force of RTAs. Moreover, we have stressed that RTAs in services
can be very preferential or almost non-preferential, depending on the schedules of commitments
negotiated. This is why we need also to test the contribution of RTAs to reduced trade costs on the
basis of the extensiveness of services commitments.
We create two variables to assess services provisions in RTAs. The first one is a dummy variable
that takes the value of one when an RTA includes services provisions8. The second variable is
an index based on a detailed analysis of services schedules of commitments in RTAs. The index
is equal to zero when there are no preferential commitments in the RTA (as compared to GATS
8The list of agreements with services provisions comes from WTO Regional Trade Agreements Information
commitments that represent the MFN treatment of services trade) and takes the value of 100 when
full market access and national treatment are granted on a preferential basis for services trade in
the 155 sub-sectors of the GATS Sectoral Classification List. More information on the calculation
of the index can be found in Annex B.
Both the RTA dummy and the services RTA index are bilateral variables that account for preferential
treatment in services trade. In the case of the dummy variable, we assume that by signing a regional
trade agreement, countries have introduced preferential treatment for services trade. However,
because of the diversity of services commitments and differences in the ambition of services RTAs,
one can assume that the index we have created is a better variable to assess the role of RTAs in
reducing trade costs as it reflects at the industry level whether there are specific market access and
national treatment commitments that can facilitate trade in services.9
The empirical model that is estimated is the following:
τi jkt = β0+β1RTAi jkt+di jk+dt+εi jkt (2)
where τi jkt is the log of the bilateral trade costs calculated as in Equation 5. The RTA variable
can be the log of the index we have created at the industry level (RTA_indexi jkt) or a dummy
variable (RTA_dummyi jt) that has a value of one when the two countries have a RTA.10 We also
include another dummy variable that indicates that one country is party to a RTA and not the other
(RTA_diversioni jt). This second dummy variable can potentially capture trade-diverting effects
where trade costs with non-parties are higher than trade costs within the RTA. In Equation 2,
dis-tance and other common geographic variables, as well as GDP, do not appear because we have
fixed-effects by country-partner-sector and by year. The influence of geography on trade costs,
as well as market size and sector-specific characteristics, are covered by these fixed effects. Thus
we expect the RTA variable to capture the impact of the preferential treatment granted to services
9On differences across RTAs in services schedules of commitments, see Marchetti and Roy (2008).
10In the index presented in Annex B, there is a different value for each signatory in a given RTA as parties do not
Table 3: Services trade costs and RTAs: regression results
All industries Services (dummy) Services (index) Services (diversion)
(1) (2) (3) (4)
RTA_dummy -0.051** -0.163*** -0.342***
(0.008) (0.020) (0.032)
RTA_index -0.043***
(0.005)
RTA_diversion -0.200***
(0.027)
Obs. 86,692 36,322 33,522 36,322
R-squared 0.047 0.076 0.076 0.082
Note: OLS estimation with robust standard errors. Significant at: *** 1% ** 5% * 10%
providers. Table 3 below presents the results of regressions where we pool across sectors.
In the four regressions in Table 3, the variables measuring the contribution of RTAs all have the
ex-pected sign. Participating in an RTA is correlated with lower trade costs. In the first column, where
all industries are pooled together, we check that this is the case not only for services industries
but for other industries as well. In Column 2 of Table 3, we have, however, a stronger coefficient
when pooling only services industries. Services RTAs have a higher impact on the reduction of
trade costs in services industries. The coefficient on the dummy variable implies that being part
of a services RTA is correlated with trade costs on average 15% lower. This is higher than the
difference in the tariff-equivalent trade costs shown on Figure 12. In the regression, we control for
many other variables that can influence this difference (through the country-partner-sector and year
fixed-effects) and we can see that the Figure was to some extent misleading and that the average
trade costs observed are influenced by other economic characteristics beyond participation in an
RTA.
In the next Column of Table 3, the RTA index has a smaller coefficient than the one estimated for
the RTA dummy variable. One should take into account that the variable is no longer a dummy,
and that the index has a value between 0 and 100 that corresponds to the preferential treatment
granted in RTAs. The coefficient can therefore not be directly compared with the one found for
provisions are associated with a higher impact. This could also explain the discrepancy between
the econometric results and Figure 12.
Lastly, in Column 4 of Table 3, in addition to the RTA dummy variable, we test for the impact of
RTAs on non-parties through another dummy variable that takes the value of one when only one
of the two countries belongs to a given RTA. The negative and significant coefficient found for
theRTA_diversionvariable indicates that trade costs are also lower for non-parties, but to a lesser
extent. This is an interesting result that highlights an important difference between services trade
and goods trade liberalization. Because behind-the-border barriers and domestic regulations are
more important for services trade, trade liberalization is often not on a discriminatory basis. For
example, reforms in the telecoms sector can facilitate the access for all foreign providers and not
providers from specific countries as opposed to others. Tariffs in the case of goods offer a better
way of discriminating between parties to an RTA and non-parties. In the case of services, reforms
triggered by the signature of an RTA are likely to benefit all players at the end of the day, especially
in the context of the liberal rules of origin observed for services providers (Fink and Nikomborirak,
2007; Baldwin et al., 2009). This line of argument suggests that, at the end of the day, it is unilateral
and non-discriminatory policy reforms that matter most in services markets: they are effectively the
basis for anything that happens at the regional and multilateral levels.
Even in the market where services reforms have been the most comprehensive -the European
Union-, Figure 13 shows that intra-EU trade costs and extra-EU trade costs are not significantly
different. In 2007, the difference in the tariff-equivalent is just 1 percentage point higher than on
Figure 12. In our sample, most observations correspond to trade flows between EU countries and
the trade-weighted average also accentuates the weight of EU services trade flows. This is why
Fig-ure 13 is not fundamentally different from FigFig-ure 12. The level of trade costs among EU countries
remains fairly high and there does not seem to be a specific single market effect. One should
how-ever keep in mind that the measure we use captures a difference between internal and external trade
and EU reforms could have had an impact both on the internal market of EU member countries and
Figure 13: Trade costs for services industries within and outside the European Union
4
Trade costs and productivity
For goods sectors, there is extensive empirical evidence that lower trade costs are associated with
higher productivity at the firm- and sector-levels (e.g., Pavcnik, 2002). Lower trade costs lead to
contraction and exit by smaller, less-productive firms, and the transfer of resources to larger, more
productive ones. The overall result is a productivity gain.
Breinlich and Criscuolo (2008) show that many of the stylized facts regarding services firms are
similar to those for goods manufacturers. For example, production is highly concentrated in a small
number of firms, and exporters tend to be larger and more productive than other firms.
VanDer-Marel (Forthcoming) shows that regulation in services sectors has an important influence on the
productivity of services firms: as for tariffs in goods markets, more restrictive regulation is
associ-ated with lower productivity. However, the present paper is the first one to present evidence on the
links between services productivity and trade costs, using a comprehensive measure that captures
all regulatory and other burdens on international service providers.
We adopt two empirical strategies to explore these links. First, we use our dataset in its most
disaggregated form. Each observation corresponds to a reporting country-partner-sector-year
of costs in both directions, it makes sense to use a bilateral measure of productivity as well. To
do this, we take the geometric average of sectoral TFP in the exporter and importer, as reported in
the EU-KLEMS database. This measure covers 21 countries and 23 sectors. (See O’Mahony and
Timmer, 2009 for details on the estimation of TFP.) The models for productivity and productivity
growth are as follows, where di jk anddt indicate fixed effects by country-partner-sector and year
respectively:
log T FPi jkt
= b1L.τi jkt+di jk+dt+ei jkt (3)
D.log T FPi jkt
= b1L.τi jkt+b2L.log T FPi jkt
+di jk+dt+ei jkt
The second part of our empirical approach uses data aggregated to the reporting country-sector-year
level, by summing trade and production variables across all partners, and recalculating trade costs
for each country. As in the descriptive statistics section of the paper, this approach yields a measure
of bilateral trade costs with respect to the rest of the world. We again ensure a consistent sample
over the estimation period by limiting consideration to those country-partner-sector observations
that are present in all years from 1995-2007. The basic models for this second approach are as
follows, wheredi jkanddt indicate fixed effects by country-sector and year respectively:
log(T FPikt) = b1L.τikt+dik+dt+eikt (4)
D.log(T FPikt) = b1L.τikt+b2L.log(T FPikt) +dik+dt+ei jt
Regression results are in Tables 4-5.11 In line with the literature on manufacturing firms, our data
support the hypothesis that lower trade costs are associated with higher productivity, and faster
productivity growth in services sectors. Using bilaterally disaggregated data (Table 4) the level
effect is approximately the same for goods and services (columns 1-2), and is highly statistically
significant in both cases. The TFP growth effect is much stronger for goods; the services parameter
11All results were obtained using our standard parameter assumption, i.e. γ=7. In additional results, available on
Table 4: Regression results using bilaterally disaggregated data.
(1) (2) (3) (4)
TFP TFP Growth
Services Goods Services Goods L.Log(Trade Costs) -0.049*** -0.057*** -0.006* -0.037***
(0.005) (0.010) (0.002) (0.004) L.Log(Geo. Ave. TFP) -0.170*** -0.244***
(0.009) (0.009) Observations 18368 70912 18242 69162
R2 0.169 0.144 0.114 0.163
Groups 3202 5876 3194 5802
Fixed effects Ctry-Part-Sect Ctry-Part-Sect Ctry-Part-Sect Ctry-Part-Sect
Year Year Year Year
Note: OLS estimation with robust standard errors. Significant at: *** 1% ** 5% * 10%
Table 5: Regression results using unilateral (aggregate) data.
(1) (2) (3) (4)
TFP TFP Growth
Services Goods Services Goods L.Log(Trade Costs) -0.051* -0.236 -0.001 -0.264***
(0.025) (0.155) (0.010) (0.070)
L.Log(TFP) -0.161*** -0.366***
(0.031) (0.045)
Observations 1280 2540 1280 2540
R2 0.104 0.048 0.099 0.208
Groups 128 254 128 254
Fixed effects Country-Sector Country-Sector Country-Sector Country-Sector
Year Year Year Year
Note: OLS estimation with robust standard errors. Significant at: *** 1% ** 5% * 10%
is estimated less precisely, but remains 10% significant.
Results are slightly weaker using aggregated data. For services, there is still a negative and
sta-tistically significant coefficient in levels, but the coefficient in the growth rate regression is very
small and statistically insignificant. In goods, by contrast, the levels coefficient is only marginally
significant at the 15% level, whereas the coefficient in the growth rate regression is large in absolute
[image:26.612.85.531.310.487.2]5
Conclusion
This paper uses a new, theory-based methodology due to Novy (2009) to present some of the first
systematic evidence on the level of trade costs in services sectors. It also discusses changes in
those costs over time. We find strong evidence that trade costs in services are much higher than
in goods: perhaps a multiple of two or even three times. The data also suggest that trade costs in
goods have fallen substantially over the last decade, but that they have remained essentially stable
in services markets. China’s experience is different, however, and is suggestive of an important role
for external commitment mechanisms such as the WTO in reducing trade costs in services.
There are many potential empirical applications of our data. We examine two here. First, we find
that trade costs within services RTAs are lower than outside RTAs, but that the differential is not
particularly large, and in some cases has even been narrowing over time. Contrary to the experience
in goods markets, we find that services RTAs can also reduce trade costs for non-member countries.
One likely reason is that services RTAs are linked to general regulatory reform programs that have
only limited discriminatory effects. The presence of liberal rules of origin in services RTAs might
also be part of the explanation.
The second question we address is the impact of trade costs on productivity and growth in services
markets. We find strong evidence that services sectors facing lower trade costs tend to be more
productive, and have higher productivity growth. As is the case for goods markets, this result is
consistent with models in which lower trade costs lead to the shrinkage or exit of less productive
firms and the transfer of resources to larger, more productive ones.
Future work can extend ours in a number of directions. First, to the extent possible, it would
be beneficial to include additional countries in the database. However, limits on the availability
of national accounts and trade data at a sufficient level of disaggregation make further progress
difficult at this time.
Second, it will be important to decompose overall trade costs into those that are amenable to policy
cultural and linguistic differences, for example. We expect, however, that regulation plays a large
part in the persistence of high trade costs in services, either directly or indirectly. Regulatory
barriers obviously hinder services trade. By contrast, regulation that reinforces the main conduits
by which services are traded across borders –like ICTs– tends to reduce trade costs. We have seen
evidence of this type of effect in the computer and financial services sectors, for example. Better
understanding the direct and indirect effects of regulation will be crucial to facilitating trade in
services in the future.
References
Anderson, J. E., van Wincoop, E., September 2004. Trade costs. Journal of Economic Literature
42 (3), 691–751.
URL❤tt♣✿✴✴✐❞❡❛s✳r❡♣❡❝✳♦r❣✴❛✴❛❡❛✴❥❡❝❧✐t✴✈✹✷②✷✵✵✹✐✸♣✻✾✶✲✼✺✶✳❤t♠❧
Breinlich, H., Criscuolo, C., Dec. 2008. Service traders in the uk. CEP Discussion Papers dp0901,
Centre for Economic Performance, LSE.
URL❤tt♣✿✴✴✐❞❡❛s✳r❡♣❡❝✳♦r❣✴♣✴❝❡♣✴❝❡♣❞♣s✴❞♣✵✾✵✶✳❤t♠❧
Broda, C., Greenfield, J., Weinstein, D., Sep. 2006. From groundnuts to globalization: A structural
estimate of trade and growth. NBER Working Papers 12512, National Bureau of Economic
Re-search, Inc.
URL❤tt♣✿✴✴✐❞❡❛s✳r❡♣❡❝✳♦r❣✴♣✴♥❜r✴♥❜❡r✇♦✴✶✷✺✶✷✳❤t♠❧
Chaney, T., September 2008. Distorted gravity: The intensive and extensive margins of
interna-tional trade. American Economic Review 98 (4), 1707–21.
Dee, P., 2003. Modelling the policy issues in services trade. Economie Internationale (2Q-3Q),
283–300.
Marchetti, J. A., Roy, M., 2008. Services liberalization in the WTO and in PTAs. In: Marchetti,
J. A., Roy, M. (Eds.), Opening Markets for Trade in Services. Countries and Sectors in Bilateral
and WTO Negotiations. Cambridge University Press, pp. 61–112.
Mattoo, A., 2004. The services dimension of china’s accession to the wto. In: Deepak Bhattasali,
S. L., Martin, W. (Eds.), China and the WTO: Accession, Policy Reform, and Poverty Reduction
Strategies. World Bank.
Miroudot, S., Lanz, R., Ragoussis, A., 2009. Trade in intermediate goods and services. OECD
Trade Policy Working Paper 93, OECD.
Novy, D., November 2009. Gravity redux: Measuring international trade costs with panel data,
mimeo.
O’Mahony, M., Timmer, M. P., 2009. Output, input and productivity measures at the industry level:
The eu klems database. The Economic Journal 119, 374–403.
Pavcnik, N., January 2002. Trade liberalization, exit, and productivity improvement: Evidence
from chilean plants. Review of Economic Studies 69 (1), 245–76.
URL❤tt♣✿✴✴✐❞❡❛s✳r❡♣❡❝✳♦r❣✴❛✴❜❧❛✴r❡st✉❞✴✈✻✾②✷✵✵✷✐✶♣✷✹✺✲✼✻✳❤t♠❧
VanDerMarel, E., Forthcoming. What determines services tfp: Services trade or services trade
regulation? Working paper, GEM Sciences Po.
Walsh, K., Nov. 2006. Trade in services: Does gravity hold? a gravity model approach to estimating
barriers to services trade. The Institute for International Integration Studies Discussion Paper
Series iiisdp183, IIIS.
URL❤tt♣✿✴✴✐❞❡❛s✳r❡♣❡❝✳♦r❣✴♣✴✐✐s✴❞✐s♣❛♣✴✐✐✐s❞♣✶✽✸✳❤t♠❧
A
Calculation of trade costs
Trade costs in services are calculated as in Novy (2009) using the following equation:
τi jkt =
xiikt.xj jkt
xi jkt.xjikt
21γ
(5)
Wherexi jkt is the production from countryiconsumed in countryjfor sectorkin yeart, andγ is the
shape parameter of the Pareto distribution which indicates the degree of heterogeneity prevailing
in a given sector (See Chaney, 2008). This methodology for computing time-varying trade costs
therefore requires data on both domestic output and bilateral trade at the sector level. We use a
29 sector classification based on ISIC Rev.3, which is the industry classification used in national
accounts data such as input-output tables. In what follows, we provide a brief overview of the way
data were collected and handled in order to calculateτi jkt across countries, sectors and years.
Domestic output
Because we are primarily interested in total domestic demand for a given sector, one cannot rely
on sectoral GDP data as the latter do not comprise intermediate consumption. We thus use gross
sectoral output. Our primary data sources are EU KLEMS and the OECD’s STAN database, which
are for the most part compatible as long as one does not get into productivity analysis (O’Mahony
and Timmer, 2009). In addition, STAN also provides data on total exports at the sector level which
may prove useful when computing ‘intranational trade’, that isxiikt. Both sources rely on the ISIC
Rev.3 classification so that no further corrections are needed with respect to sector correspondence.
However, because country coverage remains limited to OECD and EU countries, we also rely on
the UN’s National Accounts Official Country Data. The latter provide data for several emerging
and developing economies such as Croatia, Namibia, Colombia, and Nicaragua. Yet, only a few
data points are in effect compatible with our primary sources as reporting and methodology differ
‘Transport, storage and communications’.
This prompted us to use Input-Output (IO) tables for major Asian economies like China, India,
Indonesia or Taiwan. Data come from the OECD’s set of IO tables which detail sector-level gross
output using an ISIC Rev.3-compatible classification. Since IO tables are only typically released
every five years, we had to interpolate missing values for these four countries. While this inevitably
entails some smoothing, it allows us to bring the analysis to a more disaggregated level for countries
as important as China.
Gross output data are most of the time expressed in millions of local currency and at basic prices. A
prior conversion into USD is therefore required if we are to combine them with trade data and get
a measure of trade costs that is comparable across countries. This is done using bilateral nominal
exchange rates from the OECD and the IMF’s International Financial Statistics database (market
rates, period average). With regards to basic prices, the problem is that those do not comprise the
whole range of taxes/subsidies confronting buyers. This may prove problematic when combining
gross output with trade flows. Since there is no easy way to address this issue, we chose to
ap-ply a rough conversion factor to output data whenever possible. The latter is calculated for each
country/industry as the ratio of intermediate consumption valued at purchasers prices over
interme-diate consumption valued at basic prices, both of which can be found in Input-Output (IO) tables.
Intermediate consumption is being used instead of gross industry output because IO tables only
contain output valued at basic prices. The underlying assumption thus made is that - for a given
country/industry - the ratio for intermediate consumption prices applies equally to industry output.
Note that this conversion factor can only be used in cases where an IO table is available.
Trade flows
For goods, we rely on the OECD’s ITCS database which provides data on bilateral trade flows
directly at the ISIC Rev.3 format. The flows being expressed in current USD, no further adjustment
proved necessary. Things are more complicated for services where our data sources are threefold.
is Eurostat’s balance of payments statistics. And third is the UN’s Service Trade database. Aside
from data availability concerns arises the issue of aggregation. Because data for mode 1 and mode
2 trade in services essentially come from balance of payments statistics, they are released using the
EBOPS classification. We thus had to use a conversion key from EBOPS to ISIC Rev.3 that allows
comparison to be made with other data. Unfortunately, such a conversion inevitably entails losses
of information. This is particularly the case for industries such as “Computer activities” and “Other
business activities” (see Miroudot et al., 2009).
B
Services RTA index
To assess the impact of Regional Trade Agreements (RTAs) on trade costs, we compute an index
that captures the extent to which services RTAs are preferential as compared to the GATS. This first
requires going through all services RTAs that are covered in our trade dataset, and comparing GATS
specific commitments to those undertaken within RTAs.12 We do so for each party to an agreement,
subsector and mode of supply. In each case, we distinguish between fully committed subsectors
(“Full” subsectors), partially committed subsectors (“Partial” subsectors), and subsectors for which
no commitment has been undertaken (“Unbound” subsectors). In addition, remaining restrictions
for those subsectors that are “Partial” are classified according to (i) whether they pertain to the
Mar-ket Access principle or to the National Treatment principle, and to (ii) the nature of the restriction
itself – that is whether it consists of licensing requirements, residency requirements, discriminatory
measures with regard to taxes and subsidies etc. Horizontal restrictions – those that apply to all
subsectors – are also taken into account and reported for all subsectors.
Once this is done, an initial score of 100 is assigned to each agreement, country, subsector and
mode of supply regardless of its degree of commitment (including the GATS). Then, depending on
whether the subsector is Full, Unbound or subject to some restrictions, some points are deducted
Table 6: Scores assigned to RTA commitments - Deduction by type of restrictive measure and mode of supply
Mode 1 Mode 2 Mode 3 Mode 4 Market access
Unbound -50 -50 -50 -50
Restrictions on foreign ownership 0 0 -20 0 Quantitative restrictions -20 0 -5 0 Scope of sub-sector limited -15 -20 -15 -15 Restrictions to the movement of people 0 0 0 -20 Restrictions on the number of competitors -5 0 -5 0 National treatment
Unbound -30 -30 -30 -30
Nationality/residency/licensing requirements -15 0 -15 0 Restrictions to the movement of people 0 0 0 -15 Measures related to taxes and subsidies -2.5 -5 -2.5 0 Measures related to competition -2.5 -5 -2.5 0 Restrictions on ownership of property/land -2.5 -5 -2.5 0 Other discriminatory measures -2.5 -5 -2.5 0
One assumption is that market access matters relatively more than national treatment (i.e. entry
barriers and quantitative restrictions are more trade-restrictive than discrimination between foreign
and domestic companies).
Since we work with data on cross-border trade in services, we assign Mode 1 a much larger weight
(80%) than is the case for the other modes. Yet, we choose not to give a zero-weight to Modes 3
and 4 to account for the potential complementarities that may exist between modes of supply.
We are now left with a score ranging between 0 and 100 for each agreement/country/subsector. The
next step is then to compute for each RTA the difference between the agreement’s score and the
GATS score. This difference therefore takes on values from -100 to 100. Because an agreement
that is worse than GATS (i.e. GATS-minus) is de facto ineffective, we replace all negative values
by zeros, which means no preferential treatment at all. Hence, the higher the value of the index, the
more preferential the RTA for a given country/subsector.
Last, we convert W/120 subsectors into ISIC Rev.3 sectors using the UN’s Provisional Central
sectors do not match one-to-one, we average the RTA index when needed using equal weights.
Eventually, we get an index of the preferential content of RTAs for each party to an agreement that