http://dx.doi.org/10.4236/jss.2016.43036
Are Hong Kong Investors Interested in
Shenzhen-Hong Kong Stock
Connect—An Investor Behavior
Analysis Based on Shanghai-Hong
Kong Stock Connect
Xiaoyu Liao
School of Economics, Jinan University, Guangzhou, China
Received 4 March 2016; accepted 28 March 2016; published 31 March 2016 Copyright © 2016 by author and Scientific Research Publishing Inc.
This work is licensed under the Creative Commons Attribution International License (CC BY).
http://creativecommons.org/licenses/by/4.0/
Abstract
In November 2014, Shenzhen-Hong Kong Stock Connect was opened. It has been more than one year until now. Although its transaction is not as expected, the opening of Shenzhen-Hong Kong Stock Connect is a must. Hong Kong investors investing in the A-share market in the Chinese mainland by Shenzhen-Hong Kong Stock Connect are mainly small- and medium-sized institution-al investors who have not obtained QFII quota. Through the aninstitution-alysis of their investment behaviors, we have found that the preference of Hong Kong investors is single and concentrated. They ex-tremely prefer financial blue-chip AH share. They will try to invest in growth stock in the unfami-liar A-share market, mainly mid cap stock with relatively high valuation, relatively low dividend, a certain risk and relatively good growth ability. They prefer information technology shares. The opening of Shenzhen-Hong Kong Stock Connect will bring opportunities different from those of Shenzhen-Hong Kong Stock Connect.
Keywords
Shanghai-Hong Kong Stock Connect, Shenzhen-Hong Kong Stock Connect, Investor Preference
1. Introduction
stock exchange connectivity mechanism of Shanghai Stock Exchange and The Stock Exchange of Hong Kong Ltd. On November 17th, 2014, Shanghai-Hong Kong Stock Connect was officially opened. Shenzhen-Hong Kong Stock Connect refers to the technology connection established by Shanghai Stock Exchange and The Stock Exchange of Hong Kong Ltd. Investors of the two places can buy and sell shares of the other exchange within the specified scope through the local securities companies or brokers, including Shanghai Stock Connect and Hong Kong Stock Connect. The market expected that Shanghai-Hong Kong Stock Connect could introduce Hong Kong investors, promote and open the investment channels in the market of Taiwan and mainland, allow the valuation system and investment style of A-share to comply with international standards, and change its value structure and the unreasonable investment style. At the same time, it would further cause the transforma-tion of A-share trading system, and directly push the speeding up of the reform of capital market system in the Chinese mainland, including the acceleration of the registration system, establishment of self-discipline market regulation and perfect delisting system, forming of mature trading mechanism, etc.
However, after the opening of Shenzhen-Hong Kong Stock Connect, the trading was not so hot as expected. A main reason is the difference of trading mechanism of Taiwan and mainland. Currently during execution Shenzhen-Hong Kong Stock Connect requires brokers to pay 20% of trading deposit. The proportion is too high, and money can be occupied for more than a month. It affects the investment willingness of market participants. In addition, the restrictions on the trading volume and type of shares have not been reduced, the trading days have fault on different vacation, A-shares are not allowed to be bought and sold on the same day, and A-shares have to be transferred from the escrow account to the brokerage account before the selling. Due to these issues, overseas investors keep away from Shenzhen-Hong Kong Stock Connect. However, without the limitations of the trading system, are Hong Kong investors interested in the A-share market? Will they invest?
Because Shenzhen-Hong Kong Stock Connect has been implemented for a short time, there are few studies on Shenzhen-Hong Kong Stock Connect, and most of them focus on Shanghai Stock Connect. Most scholars focus on the impact of Shanghai-Hong Kong Stock Connect on capital flow and difference of announcement effect in the two places, as well as the impact of Shenzhen-Hong Kong Stock Connect on volatility and flow ability of Shanghai stock, behaviors of investors in the Chinese mainland, etc. However, there is no study on the invest-ment behavior of Hong Kong investors in the Shanghai stock market.
Liu Yao [1] analyzed the capital flow of two places caused by Shanghai-Hong Kong Stock Connect. He be-lieves that fundamentals of listed companies, market and macroeconomic operation are main factors influencing the capital flow microcosmically, mesoscopically and macroscopically. Yan Jiajia [2] used the event study me-thod to study the announcement effect generated by Shenzhen-Hong Kong Stock Connect, and found that the announcement effect of Shenzhen-Hong Kong Stock Connect incident in the Hong Kong stock market was stronger than that in the Shanghai stock market. The results of volatility test and Granger causality test of two markets show that the volatility in the Hong Kong stock market is significantly bigger than that in the Shanghai stock market, and on the premise that there is a correlation between the two markets, the Hong Kong stock mar-ket is more sensitive to information than the Shanghai stock marmar-ket. By empirical research, Chen Chen [3] found that the net effect of Shanghai-Hong Kong Stock Connect pilot increased the volatility of Shanghai stock and reduced the flow ability. Liu Rongmao [4] studied the impact of Shanghai-Hong Kong Stock Connect on the effectiveness of Shanghai stock market, and found Shanghai stock market had significant long-term memorabil-ity, but after Shanghai-Hong Kong Stock Connect its long-term and short-term memorability declined signifi-cantly. By studying the behaviors of A-share investors in the Chinese mainland under Shanghai-Hong Kong Stock Connect, Kang Lingwei [5] found that Shanghai-Hong Kong Stock Connect was obviously good for A-share in the Chinese mainland. Investors showed transaction laziness and lack of response when the event occurred, and overconfidence and overreaction after the event. At the same time, the investor sentiment and the stock volatility have positive interaction and feedback mechanism. The investor sentiment depends more on the fluctuation of large-cap shares. By exploring the impact of Shanghai-Hong Kong Stock Connect on the volatility of Shanghai stock market, Wang Chengben [6] found that Shanghai-Hong Kong Stock Connect failed to en-hance the mean spillover effect between the two markets, and after Shanghai-Hong Kong Stock Connect Shanghai stock market did not enhance the learning of pricing in the Hong Kong stock market or stabilize the price fluctuation.
Different from Shanghai-Hong Kong Stock Connect, Shenzhen-Hong Kong Stock Connect gets through invest-ment channels of growth stock at home and abroad. High-quality SME GEM and Hang Seng Small-cap Index constituent stock are expected to become investment targets.
This paper will use the stock investment data of 1 year from the opening of Shanghai-Hong Kong Stock Con-nect to now to analyze investment behavior and investment preference of Hong Kong investors in the Chinese mainland market, and from the perspective of whether Hong Kong investors are interested in growth shares of A-share, infer the investment opportunities in the future after the opening of Shanghai-Hong Kong Stock Connect.
2. The Differences of Markets and Investors of the Chinese Mainland and
Hong Kong
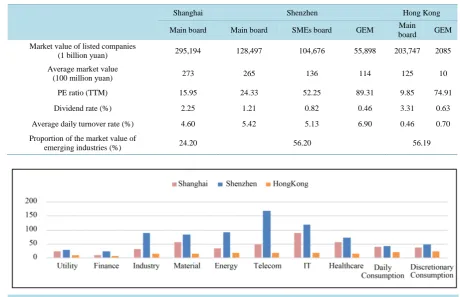
Shenzhen Stock Exchange is divided into the mainboard, SMEs board and GEM with distinctive characteristics. Compared with Shanghai Stock Exchange and The Stock Exchange of Hong Kong, Shenzhen Stock Exchange has the following main features: 1) The average market value and PE ratio of the mainboard are similar to those of Shanghai Stock Exchange, and the average market value of SMEs board is low, but the valuation level is rel-atively high; 2) The market value of the emerging industry has a high proportion, and the industries are scattered; 3) The turnover rate is relatively high, and the dividend rate is relatively low.
Specifically speaking (Table 1),
• Total market value and average value of listed companies: SME GEM and the main board of Shenzhen Stock Exchange have equal shares. The total market value of the main board is far lower than that of Shang-hai and Hong Kong. The average market value of listed companies on the main board in Shenzhen is close to that of Shanghai Stock Exchange; and the average market value of SME in Shenzhen is similar to that of the main board in Hong Kong. The values on GEM in Hong Kong are much lower than those on GEM in Shenzhen.
• Industry structure: The three places focus on different aspects. Listed companies in Shanghai Stock Ex-change focus on finance, industry, energy, material and other traditional industries. In recent years they ac-count for about 80%.Among them, finance acac-counts for 30%, followed by industry of about 24%. In listed companies in Shenzhen Stock Exchange and The Stock Exchange of Hong Kong, the proportion of optional consumption, daily consumption, health care, information technology, telecommunication service and other emerging industries increases. Now they all account for more than 56%; but they have a large difference in terms of the industry structure. The industry distribution in Shenzhen Stock Exchange is relatively uniform. Finance only accounts for 10%, information technology and optional consumption account for about 20%; in The Stock Exchange of Hong Kong, finance accounts for about 40%, followed by information technology of 18%.
• PE ratio: The overall dynamic PE ratio of A-share in Shenzhen is much higher than that on the main board of the other two markets. The overall market valuation is significantly higher than that on the main board of Shanghai and Hong Kong. After February 2015, the PE ratio of Hong Kong GEM increased significantly. By industry (Figure 1), the overall valuation of utilities, daily consumption and optional consumption in Shenzhen Stock Exchange is similar to that in Shanghai Stock Exchange, and the valuation in other indus-tries is much higher than that in Shanghai; except finance, in Hong Kong the valuation of listed companies in other industries is significantly lower than that in Shanghai and Shenzhen. Among them, the valuation of telecommunication services is mainly because in the division of Wind telecommunication service industry, Shanghai Stock Exchange and Shenzhen Stock Exchange only contain two and three listed companies, far less than 21 listed companies of The Stock Exchange of Hong Kong.
• Dividend rate: The dividend rate in the Shenzhen market is generally lower than that in Shanghai and Hong Kong. The dividend rate of Shenzhen SME Board and GEM and Hong Kong GEM are similar and all lower than that on the main board.
• Average daily turnover rate: The average daily turnover rate on the boards in Shenzhen is relatively higher than that in Shanghai. On Shanghai and Shenzhen market, there are many individual investors. Due to the common feature of fanatical peculation, the turnover rate on the two markets is much higher than that on the main board and GEM in Hong Kong.
The Differences of the Investor Structure
Table 1. The differences of stock markets in the three places.
Shanghai Shenzhen Hong Kong
Main board Main board SMEs board GEM Main
board GEM
Market value of listed companies
(1 billion yuan) 295,194 128,497 104,676 55,898 203,747 2085
Average market value
(100 million yuan) 273 265 136 114 125 10
PE ratio (TTM) 15.95 24.33 52.25 89.31 9.85 74.91
Dividend rate (%) 2.25 1.21 0.82 0.46 3.31 0.63
Average daily turnover rate (%) 4.60 5.42 5.13 6.90 0.46 0.70
Proportion of the market value of
[image:4.595.79.540.97.394.2]emerging industries (%) 24.20 56.20 56.19
Figure 1. PE ratio by industry of exchanges in the three places.
On the Hong Kong stock market the investors are mainly institutional investors, and the proportion of foreign investment agencies is relatively large. According to the latest data of The Stock Exchange of Hong Kong, from October 2013 to September 2014, transactions of institutional investors accounted for 59% of the total market transaction, in which 35% was from overseas institutional investors, 24% was from local institutional investors of Hong Kong, and local individual investors accounted for 20%. In addition, among investors from other places, the Chinese mainland investors accounted for 13%, and British and American investors accounted for 54%.
We expect that potential foreign investors of Shenzhen-Hong Kong Stock Connect and Shenzhen-Hong Kong Stock Connect are mainly small and medium-sized institutional investors who have not obtained QFII quota. Some individual investors are also included. The investment style may be not so steady as that of QFII, and even relatively radical. First, because the existing channels such as QFII are provided by relatively large institutional investors who invest in A-share. By the end of 2015, the cumulative QFII quotas examined and approved by the exchange office increased to USD81.068 billion, and the total number of institutions reached 279. In addition, RQFII quota examined and approved was RMB444.325 billion, and the total number of institutions reached 156.The original intention of schematic design of Shanghai Stock Connect and Shenzhen Stock Connect is clos-er to people, aiming at providing professional small and medium-sized investors with investment channels, in order to attract investors with different attributes to enter the A-share market.
3. Analysis on the Investment Style Investors Going to the North
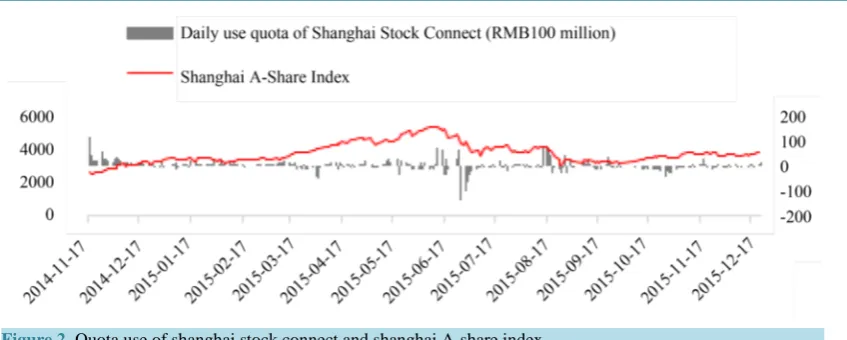
Figure 2. Quota use of shanghai stock connect and shanghai A-share index.
investment skills, but they fail to correctly grasp the A-share market.
The degree of participation of Shanghai Stock Connect is not high. By the end of December 2015, the daily used quota of investors going to the north and south was respectively RMB598 million and RMB621 million. The balance of daily limit accounted for 95.3% and 94%; investment quota cumulatively used accounted for 39.9% and 43.3% of the available quota of investment respectively. The total market value of Shanghai Stock Exchange was RMB29.5 trillion, the market value of free flow was RMB25.4 trillion, the used quota of Shang-hai Stock Connect of RMB180.285 only accounted for 0.47% of the market value of free flow; in 2015 the turnover of A-share was RMB1.31569293 quintillion, 1.591987 trillion, the turnover of Shanghai Stock Connect was RMB1.591987 trillion, accounting for only 1.21%. However, large and frequent trading record of individual share shows the close attention of funds. Through the analysis on characteristics of active stock sold since the opening of Shanghai Stock Connect, i.e. the top ten shares of daily turnover, we infer the preference of investors mainly going to the south and north.
By the end of December 2015, there are 569 tradable targets of Shanghai Stock Connect. The accumulative turnover is RMB1.632494 trillion. Within 260 trading days, accumulatively 145 top 10 active individual shares in terms of daily turnover in Shanghai Stock Connect appeared, and active daily accumulative turnover was RMB635.7 billion. The number of active individual shares and accumulative turnover accounted for 25.5% and 38.9% of Shanghai Stock Connect. In daily trading, the proportion of daily turnover of active shares in that of Shanghai Stock Connect reduced gradually from 55% in the first stage after opening. In the late stage it was rel-atively stable and around 35% (Figure 3), which had strong representativeness.
3.1. Preference Characteristics of Funds Going to the North
Through statistics of 145 active stocks on 260 trading days, we found that:1) The preference of funds going to the north is extremely single and centralized. The turnover of active stocks is much higher than that of non-active stocks. In top ten shares in terms of the daily turnover, 44 shares appeared for one time, and 23 shares appeared for 2 times (Figure 4). Only 13 shares appeared for 90 - 260 times at a high frequency, but the total turnover on the active days was up to RMB396.2 billion, accounting for 62.3% of the turnover of active stock and 24.3% of accumulative turnover of Shanghai Stock Connect (Table 2). On the other hand, the higher the active level is, the higher the average daily turnover is. On active days, the av-erage daily turnover of individual shares appearing at a high frequency for 90 - 260 times was RMB274 million, in which the average daily turnover of Ping An Insurance appearing for 260 times was RMB527 million times, much higher than RMB99 million appearing for one time and the average daily turnover of RMB9 million of non-active stock.
Figure 3. Turnover of active stock accounted for about 39% of the turnover of Shanghai stock connect.
[image:6.595.116.531.430.557.2]Figure 4. The accumulative turnover and average daily turnover of active stock.
Figure 5. Proportion of AH share in active stocks of Shanghai stock connect.
Table 2. Turnover of shares with different active levels in Shanghai stock connect.
All Top ten active
stocks
Stocks active for 1 day
Stocks active for
90 - 260 days Non-active stocks
Number of stocks 569 145 44 13 424
Proportion 25.5% 7.7% 2.3% 74.5%
The cumulative turnover
(RMB100 million) 16,324 6357 43 3962 9967
Proportion 38.9% 0.3% 24.3% 61.1%
[image:6.595.92.538.599.718.2](increase of capital interest), the proportion of AH share gradually rose to about 50%.
3.2. Characteristics of Funds Going to the North
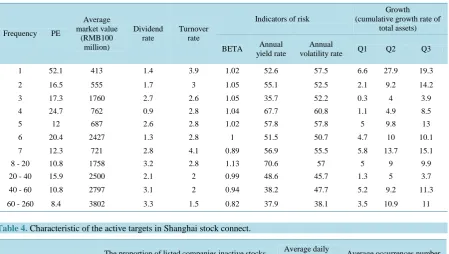
1) The active stocks with higher level of preference of funds going to the north are steadier. Active stocks ap-pearing for more than 20 times have the following characteristics (Table 3).
• Low PE ratio (about 10 times), high average market value (above RMB250 billion), relatively high dividend rate (2% - 3%), low price/book value ratio (1.55 times) and relatively low turnover rate (about 2%);
• The risk degree is low. BETA value is less than 1. The annual yield rate is relatively low (37% - 45%), the annual volatility rate is low (38% - 45%);
• with steady and healthy growth. The growth rate of total assets in three quarters of 2015 (relative growth rate at the beginning of the year) was about 5%, 10% and 5% respectively.
2) Funds going to the north also show interest to growth individual stocks. Active stocks have the following characteristics, including high PE ratio (52.1 times), relatively low average market value (41.3 billion), low div-idend rate (1.4%), high price/book value ratio (4.47 times), high turnover rate (3.9%), relatively high risk (BETA of 1.02, the annual yield rate and volatility rate above 50%), and high growth (The growth rate of total assets in three quarters of 2015 was 6.6%, 27.9% and 19.3%).
[image:7.595.90.540.320.574.2]3) In terms of industry configuration (Table 4), funds going to the north focus on finance most and extremely
Table 3. Characteristics of active targets in Shanghai stock connect.
Frequency PE
Average market value
(RMB100 million)
Dividend rate
Turnover rate
Indicators of risk
Growth (cumulative growth rate of
total assets)
BETA Annual
yield rate
Annual
volatility rate Q1 Q2 Q3
1 52.1 413 1.4 3.9 1.02 52.6 57.5 6.6 27.9 19.3
2 16.5 555 1.7 3 1.05 55.1 52.5 2.1 9.2 14.2
3 17.3 1760 2.7 2.6 1.05 35.7 52.2 0.3 4 3.9
4 24.7 762 0.9 2.8 1.04 67.7 60.8 1.1 4.9 8.5
5 12 687 2.6 2.8 1.02 57.8 57.8 5 9.8 13
6 20.4 2427 1.3 2.8 1 51.5 50.7 4.7 10 10.1
7 12.3 721 2.8 4.1 0.89 56.9 55.5 5.8 13.7 15.1
8 - 20 10.8 1758 3.2 2.8 1.13 70.6 57 5 9 9.9
20 - 40 15.9 2500 2.1 2 0.99 48.6 45.7 1.3 5 3.7
40 - 60 10.8 2797 3.1 2 0.94 38.2 47.7 5.2 9.2 11.3
60 - 260 8.4 3802 3.3 1.5 0.82 37.9 38.1 3.5 10.9 11
Table 4. Characteristic of the active targets in Shanghai stock connect.
The proportion of listed companies inactive stocks Average daily
turnover (Billion) Average occurrences number
Finance 26.2% 0.28 34.0
Industry 20.7% 0.21 14.3
IT 13.1% 0.15 4.5
Discretionary Consumption 12.4% 0.19 15.6
Material 8.3% 0.20 8.2
Daily Consumption 6.2% 0.12 32.1
Utility 5.5% 0.22 5.8
Healthcare 4.8% 0.11 7.7
Energy 2.8% 0.25 7.5
[image:7.595.87.539.558.723.2]prefer insurance and banking, followed by industry and daily consumption. The industrial investment is rela-tively scattered. The daily consumption is relarela-tively concentrated. In 145 active stocks focused on by funds, there are 38 financial shares, accounting for 26%.The average daily turnover on the active days was the most, which was RMB279 million. Within 260 trading days it appeared for the most times on average, i.e. 34 times. The investment of industrial share is relatively scattered. 30 shares accounted for 21%. The average daily turno-ver was RMB210 million. The aturno-verage occurrence number is relatively small, which is 14 times. The investment of daily consumption shares is relatively concentrated. 9 shares accounted for 6%, the average daily turnover was RMB120 million, and the average occurrence number was relatively small, which was 32 times.
4) In addition, in the finance industry, funds going to the north especially prefer insurance. There are only four listed companies of insurance, accounting for 3%. The target is extremely single, but the average daily turnover was up to RMB419 million, and the average occurrence number was 95, much higher than that of other finance industries. Among them, Ping An Insurance appeared fro 260 times, the average daily turnover was RMB527 million, followed by banking, whose average daily turnover was up to RMB215 million, and the av-erage occurrence number was 46.
3.3. Whether Funds Going to the North Are Really Interested in Growth Stocks
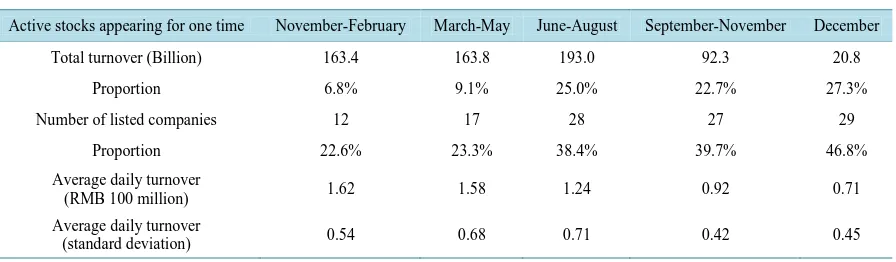
[image:8.595.91.539.588.719.2]Funds going to the north really show interest in growth stocks. The proportion of investment in growth stocks represented by active stocks appearing for 1 time gradually increased. And the average daily turnover declined steadily, the standard deviation did not reduced correspondingly, which showed the selection of investment tar-gets was more dispersed, and the investment in different tartar-gets was more differentiated. By the end of Decem-ber 2015, in 44 active stocks appearing for one time, the numDecem-ber of individual stocks after June 2015 is much larger than that from November 2014 to May 2015, and the proportion increased from less than 10% to 25% (Table 5).
On a certain level, due to the general rising before the stock market crash, funds going to the north have not power to pursue the growth stocks with relatively high return. The long-term shock and consolidation of the market after the stock market crash may become the opportunity in which the funds will focus on growth stocks. After the stock market crash of A-share, Shanghai Stock Connect had massive outflow, and the turnover sharply declined. Since November 2014, every 3 months (November 2014-February 2015, February-May 2015, June- August 2015, September-November 2015 and December) the total turnover of active stocks was respectively RMB163.4 billion, RMB163.8 billion, RMB193 billion, RMB92.3 billion and RMB20.8 billion. Separately, in each interval the number and proportion of active stocks appearing once had steady growth after June 2015, and increased from 22.6% in November 2014 to 46.8% in December 2015. The average daily turnover of individual stocks declined steadily from RMB162 million to RMB71 million. The standard deviation reduced, showing decentralization of investment target and differentiation of investment of individual stocks.
3.4. Characteristics of Individual Stocks Extremely Preferred by Funds Going to the North
Funds going to the north extremely prefer some individual stocks. By the end of December 2015, in 260 transac-tions, Ping An Insurance appeared in the top ten daily turnover for 260 times, Guizhou Maotai appeared for 188 times, CITIC Securities appeared for 181 times, and China Merchants Bank appeared for 161 times. In addition,Table 5. Active stocks appearing for one time in Shanghai stock connect.
Active stocks appearing for one time November-February March-May June-August September-November December
Total turnover (Billion) 163.4 163.8 193.0 92.3 20.8
Proportion 6.8% 9.1% 25.0% 22.7% 27.3%
Number of listed companies 12 17 28 27 29
Proportion 22.6% 23.3% 38.4% 39.7% 46.8%
Average daily turnover
(RMB 100 million) 1.62 1.58 1.24 0.92 0.71
Average daily turnover
individual stocks appearing for more than 90 times include Shanghai Automotive Industry Corporation (119 times), Industrial and Commercial Bank of China (105 times), National Commercial Bank (98 times), Daqin Railway (98 times) and Yili Industrial (97 times). The larger the turnover is, the greater the impact on the price of individual stock is. We also consider every 3 months as a time interval to calculate the proportion of the total turnover of each share on the active days in the interval in the total market turnover of the share (Table 6).
1) Most shares extremely focused on by funds going to the north are relatively familiar AH shares. The funds extremely prefer to financial blue-chip AH share. In the top six stocks, 4 are AH shares, including Ping An In-surance, CITIC Securities, China Merchants Bank and Industrial and Commercial Bank.
2) Funds going to the north extremely prefer steady large-cap insurance (Ping An Insurance) and rare prod-ucts with strong heterogeneity (Guizhou Maotai), and have great impact on the stock price. Guizhou Maotai, as traditional well-known liquor, has no alternative in Shanghai even in the rare products at present, so it continues to attract investors going to the north, the continuous turnover proportion accounts for more than 13%, and it is enough to affect its stock price. During the stock in the aftermarket, to some extent, it serves as the backcourt of overseas investor unfamiliar with domestic situation. The proportion increased to 31%.
3) Funds going to the north changed a lot in the industries (Daqin Railway, Shanghai Automotive Industry Corporation). They may be adjusted according to market demand. For example, the automobile consumption stimulus policy issued in the fourth quarter was good for the automotive industry. The focus on banks and bro-kers is relatively stable due to the steady fundamentals.
4. Conclusion and Recommendation
Investors of Shanghai Stock Connect are mainly small- and medium-sized institutional investors who have not obtained QFII quota. Some individual investors are also included. The investment style may be not so steady as that of QFII, and even relatively radical. They have certain investment skills. By tracking characteristics of top ten shares in terms of daily turnover in Shanghai Stock Connect, we know that funds going to the north have preference characteristics as follows.
1) The preference targets are extremely single and centralized. The turnover of active stocks in Shanghai Stock Connect is much higher than that of non-active stocks. Characteristics of extremely preferred targets in-clude low valuation, high dividend, low turnover rate, low risk, relatively steady growth ability and famous liq-uor with high heterogeneity, which have great impact on the stock price.
2) The preference of AH share is limited, but the financial blue-chip AH share is extremely preferred;
[image:9.595.91.538.512.718.2]3) They will try to invest in growth stocks in the unfamiliar markets (A-share), which are mainly shares with relatively high valuation, relatively low dividend, a certain risk, relatively good growth ability and middle mar-ket value. They prefer information technology;
Table 6. The proportion of the total turnover of extremely active stocks on the active days in the total market turnover.
November-February March-May June-August September-December
2.4% 3.7% 3.9% 8.1%
Yili Industrial (97). 13.6% 4.6% 2.2% 3.2%
Daqin Railway (98). 0.5% 1.4% 2.1% 2.8%
National Commercial Bank (100). 5.1% 1.8% 3.7% 2.8%
Industrial and Commercial Bank (105). 15.9% 7.2% 3.7% 19.7%
Shanghai Automotive
Industry Corporation (119). 3.1% 3.2% 5.1% 9.3%
China Merchants Bank (161). 2.0% 1.4% 1.4% 2.4%
CITIC Securities (181). 15.1% 13.8% 12.6% 31.1%
Guizhou Maotai (188). 20.5% 3.3% 5.8% 13.2%
4) In terms of industry configuration, they focus most on finance, and extremely prefer insurance and banking, followed by industrial and daily consumption. The industrial investment is relatively scattered, and the daily consumption is relatively concentrated.
While if Shenzhen-Hong Kong Stock Connect fails to have a large breakthrough on the trading mechanism of Shanghai-Hong Kong Stock Connect, its influence on the market funds will also be limited in the short term. However, investors going to the north and south will largely continue its investment preference in Shanghai- Hong Kong Stock Connect, so when Shenzhen-Hong Kong Stock Connect is opened, there are the following investment opportunities: 1) The leading blue-chip stocks in each industry, especially financial blue-chip AH share (Ping An Insurance, GF Securities); 2) Rare targets, especially the traditional liquor (Wuliangye); 3) Steady growth stocks with low valuations, high market value and high dividend rate; and 4) High-quality SME GEM with relatively good growth ability. The information technology industry is better.
References
[1] Liu, Y. (2015) Study on the Influence of Shanghai-Hong Kong Stock Connect on the Capital Flow. Journal of Finan-cial Economics, 12, 123-127.
[2] Yan, J.J. and Guo, W. (2015) Huang Wenbin. Comparative Study on the Announcement Effect of Shanghai-Hong Kong Stock Connect. Economic Perspectives, 12, 69-77.
[3] Chen, C. (2015) Study on the Influence of Shanghai-Hong Kong Stock Connect t on the Volatility and Flowability of Shanghai Stock-Based on the Double Difference Model. Times Finance, 32, 146-150.
[4] Liu, R.M. and Liu, H.X. (2015) The Influence of Shanghai-Hong Kong Stock Connect on the Effectiveness of Shang-hai Stock Market. Economics and Management Research, 8, 54-62.
[5] Kang, L.W. (2015) Study on the Behaviors of A-Share Investors in Chinese Mainland under Shanghai-Hong Kong Stock Connect. East China Jiaotong University, Nanchang.