Some aspects of the mechanical testing of hot rolled
asphalt surfacings.
CHOYCE, P. W.
Available from Sheffield Hallam University Research Archive (SHURA) at:
http://shura.shu.ac.uk/19465/
This document is the author deposited version. You are advised to consult the
publisher's version if you wish to cite from it.
Published version
CHOYCE, P. W. (1981). Some aspects of the mechanical testing of hot rolled asphalt
surfacings. Masters, Sheffield Hallam University (United Kingdom)..
Copyright and re-use policy
See
http://shura.shu.ac.uk/information.html
M. V / *-U 1 v i U I U I J S JL POND s i m i
SHEFFIELD SI 1WB (5? 0 * 1 3
7 9 2 5 3 0 ^ 0 1 1 4
Sheffield City Polytechnic Library
REFERENCE ONLY
Mr
L L
- 5 d e c wyfa
ProQuest Number: 10694346
All rights reserved
INFORMATION TO ALL USERS
The quality of this reproduction is dependent upon the quality of the copy submitted.
In the unlikely event that the author did not send a com plete manuscript and there are missing pages, these will be noted. Also, if material had to be removed,
a note will indicate the deletion.
uest
ProQuest 10694346
Published by ProQuest LLC(2017). Copyright of the Dissertation is held by the Author.
All rights reserved.
This work is protected against unauthorized copying under Title 17, United States C ode Microform Edition © ProQuest LLC.
ProQuest LLC.
789 East Eisenhower Parkway P.O. Box 1346
SOME ASPECTS OF THE
MECHANICAL TESTING
OF HOT ROLLED ASPHALT
SURFACINGS.
m
P . W . CH O Y CE BSc. M.I.H.E
Thesis subm itted to th e Council f o r N ational Academic Awards f o r the Degree of M aster of Philosophy based on
. i
re se a rc h conducted in the Department of C iv il E ngineering,
S h e ffie ld C ity P o ly tech n ic in c o lla b o ra tio n w ith the
ESSo Petroleum Company Ltd,
ABSTRACT
Hot Rolled Asphalt Wearing course m ix tu res, c o n tain in g up to 55°/0
by mass of coarse aggregate, were te s te d over a range of b inder co n ten ts using the follow ing t e s t methods:-
M arshall Test
In d ir e c t-T e n s ile Test Wheel-Tracking T est.
The r e s u l t s obtained were used to asse ss the a b i l i t y of each of these methods to
( i ) a s s i s t in the s e le c tio n of an optimum m ixture com position, from the p o in t of view of re s is ta n c e to deform ation
( i i ) p re d ic t the re s is ta n c e to deform ation of the v ario u s m ixtures t e s te d .
I t was found th a t the r e s u l t s obtained by a l l th ree t e s t methods could be used to define an "optimum b inder c o n ten t" fo r a given s e t of c o n s titu e n ts , and th a t both M arshall S t a b i l i t y and M arshall Q uotient were c lo s e ly r e la te d to re s is ta n c e to deform ation, as measured in the Wheel-Tracking T est.
In the lig h t of the r e s u l t s o b tain ed , the M arshall Test would appear to be most s u ita b le of the th re e (from the p r a c t i c a l p o in t of view) fo r a p p lic a tio n to the design of Hot Rolled A sphalt Mix tu re s .
SUMMARY OF CONTENTS PAGE ABSTRACT
SUMMARY OF CONTENTS i
CONTENTS ii
ACKNOWLEDGEMENTS Xi n
NOTATION xiv
CHAPTER 1 : INTRODUCTION 1
CHAPTER 2 : BACKGROUND INFORMATION 11
CHAPTER 3 : EXPERIMENTAL PROGRAMME 64
CHAPTER 4 MATERIALS AND SPECIMEN COMPOSITION 72
CHAPTER 5 : EXPERIMENTAL PROCEDURES 91
CHAPTER 6 : DISCUSSION OF EXPERIMENTAL RESULTS
142-CHAPTER 7 : CONCLUSIONS 2.48
FUTURE WORK 261
REFERENCES 263
APPENDIX A : COMPUTER PROGRAMS 2 93
APPENDIX B : DETAILED TEST METHODS 300 APPENDIX C : DATA RECORDING SHEETS 321
APPENDIX D : EXPERIMENTAL RESULTS 327
CONTENTS: PAGE Section
1.
2
.
2.1 2.1.1 2.1.2 2.1.2.1 2.1.2.22 .1 .2 .3 2 .1 .2 .4 2 .1 .3 2 .1 .3 .1 2 .1 .3 .2 2 .1 .3 .3 2 .1 .3 .4 2 .1 .4 2 .1 .4 .1 2 .1 .4 .2 2 .1 .4 .3 2 .1 .4 .4
A b stract
Summary of Contents Contents
Ac knowle d geme n t s N otation
CHAPTER 1
INTRODUCTION 1
CHAPTER 2
BACKGROUND INFORMATION 1\
The Mechanical T esting of Bituminous Paving M ixtures 12
In tro d u c tio n 12
Em pirical Test Methods 12
General
12-Common Em pirical Test Methods 13
Advantages of Em pirical Test Methods 13 D isadvantages of Em pirical Test Methods 14
Fundamental Test Methods 14
General 14
Common Fundamental Test Methods
Advantages of Fundamental Test Methods D isadvantages of Fundamental Test Methods Sim ulative Test Methods
General
Common Sim ulative Test Methods
Advantages of Sim ulative Test Methods Disadvantages of Sim ulative Test Methods
16 16 17 ii
X i I »
S ection PAGE
2.2 Test methods used in the Current In v e s tig a tio n
2 .2 .1 In tro d u c tio n 18
2 .2 .2 The M arshall Test Method 1®
2 .2 .2 .1 O utline of Test Method
2 .2 .2 .2 H is to r ic a l Background 19 2 .2 .2 .3 A p p licatio n to Hot Rolled Asphalt
2 .2 .2 .4 E ffe c t of Sand F ra c tio n of Binder Requirement
and A sphalt P ro p e rtie s 2.7 2 .2 .2 .5 R e p e a ta b ility and R e p ro d u c ib ility 2 9 2 .2 .2 .6 What i s Measured in the M arshall Test 31 2 .2 .2 .7 A b ility to Assess R esistance to Deformation 32 2 .2 .2 .8 A p p licatio n s to Q uality C ontrol 35 2 .2 .3 The In d ir e c t-T e n s ile Test Method 36 2 .2 .3 .1 O utline of Test Method 36
2 .2 .3 .2 Theory 36
2 .2 .3 .3 H is to r ic a l Background 39 2 .2 .3 .4 A p p licatio n to Bituminous M ate ria ls 39 2 .2 .4 The Wheel-Tracking Test Method 4 2 2 .2 .4 .1 O utline of Test Method _ 42 2 .2 .4 .2 H is to r ic a l Background 44 2 .2 .4 .3 A p p licatio n and Usage 46 2.3 Specimen Manufacture and T esting
-Some Im portant C onsiderations 50 2 .3 .1 Manufacture of Test Specimens 50
2 .3 .1 .1 In tro d u c tio n 50
2 .3 .1 .2 D ensity, P a r t i c l e O rie n ta tio n and
D egradation 50
Section PAGE
2 .3 .1 .5 Mixing and Compaction Temperatures 57 2 .3 .2 Method of T esting Specimens 59
2 .3 .2 .1 In tro d u c tio n 59
2 .3 .2 .2 Mode of Load A p p licatio n 59 2 .3 .2 .3 Loading Rate and Test Temperature 6QL
CHAPTER 3
3. OUTLINE OF EXPERIMENTAL PROGRAMME 64
3.1 In tro d u c tio n 64
3.2 Mechanical T esting Procedures Employed 65. 3.3 Hot Rolled Asphalt M ixtures Considered 65 3.4 Comparison of Laboratory and Road R esu lts 6.8 3.5 Statement of Aims and O bjectiv es ®9.
{
CHAPTER 4
4. MATERIALS AND SPECIMEN COMPOSITION 72
4 .1 In tro d u c tio n 72
4 .2 Coarse Aggregate 73
4 .2 .1 Sieve A nalysis - P a r tic le - S iz e D is trib u tio n 73 4 .2 .2 R elativ e D ensity and Water A bsorption . 74
4.3 Fine Aggregate 74
4 .3 .1 Sieve A nalysis - P a r tic le - S iz e D is tr ib u tio n ^5 4 .3 .2 R elativ e D ensity and Water A bsorption 78
4 .4 F i l l e r 79
Section
4 .4 .2 R elativ e D ensity
4.5 Binder
4.6 Specimen Composition 4 .6 .1 General
4 .6 .2 C a lc u la tio n of Specimen P ro p o rtio n s Required 4 .6 .3 Specimen I d e n ti f i c a t i o n
CHAPTER 5
5. . EXPERIMENTAL PROCEDURES 5.1 In tro d u c tio n
5.2 Storage of C o n stitu en t M ate ria ls 5.3 The M arshall Test
5 .3 .1 In tro d u c tio n
5 .3 .2 P re p a ra tio n of C o n stitu en t M aterials 5 .3 .3 Mixing and Compaction
5 .3 .4 Measurement of Specimen Height 5 .3 .5 D eterm ination of Specimen Density 5 .3 .6 C a lc u la tio n of Air Voids in Specimens 5 .3 .7 D eterm ination of S t a b i l i t y and Flow 5 .3 .8 General C onsiderations
5.4 The In d ire c t-T e n s ile Test 5 .4 .1 In tro d u c tio n
5 .4 .2 Test Specimens
5 .4 .3 D eterm ination of the In d ir e c t-T e n s ile Strength
Section PAGE
5 .5 .2 D e sc rip tio n of Apparatus 1.27
5 .5 .3 Mixing 134
5 .5 .4 Compaction 135
5 .5 .5 D eterm ination of Specimen Density 137
5 .5 .6 Wheel-Tracking Test 137
CHAPTER 6
6. DISCUSSION OF EXPERIMENTAL RESULTS 142
6.1 M arshall Test R esu lts 143
6 .1 .1 Comments on Test Procedure 143
6 .1 .1 .1 In tro d u c tio n 143
6 .1 .1 .2 Mixing and Compaction O perations 143 6 .1 .1 .3 S t a b i l i t y - Flow D eterm inations 146 6 .1 .1 .4 Execution of Test Procedure 147 6 .1 .1 .5 R e l i a b i l i t y of Equipment 147 6 .1 .2 A nalysis and P re s e n ta tio n of R esu lts 151
6 .1 .3 D iscussion of R esu lts 152
6 .1 .3 .1 Main I n v e s tig a tio n 152 6 .1 .3 .2 R e p e a ta b ility and R e p ro d u c ib ility 165 6 .1 .3 .3 Method of Measuring S t a b i l i t y -179 6 .1 .3 .4 E stim ation of M arshall Optimum Binder Content 181
fo r Mortar M ixtures
6 .1 .3 .5 Critique of B.S. 594 Design Method 182-6 .1 .3 .182-6 Summary of Conclusions 186 6.2 In d ire c t-T e n s ile Test R esu lts and
Comparison w ith M arshall R esu lts (88 6 .2 .1 Comments on Test Procedure 188
S ection PAGE
6 .2 .1 .2 V a lid ity of Test Method 188
6 .2 .1 .3 Test Specimens 192.
6 .2 .2 A nalysis and P re s e n ta tio n of R esu lts 19 2
6 .2 .3 D iscussion of R esults 193
6 .2 .3 .1 Optimum Binder Content as Determined from
the In d ir e c t-T e n s ile Test k)3 6 .2 .3 .2 Comparison of M arshall and In d ir e c t T ensile
Test R esults 198
6 .2 .3 .3 Summary of Conclusions 207 6.3 Wheel-Tracking Test R esu lts and Comparison
w ith M arshall R esu lts 209
6 .3 .1 Comments on Test Procedure 209
6 .3 .1 .1 In tro d u c tio n 209
6 .3 .1 .2 ' Machine C h a r a c te r is tic s 210
6 .3 .1 .3 Compaction O peration 210
6 .3 .1 .4 Test R esu lts 214
6 .3 .2 A nalysis and P re s e n ta tio n of R esu lts 216
6 .3 .3 D iscussion of R esu lts 217
6 .3 .3 .1 R e p e a ta b ility .217
6 .3 .3 .2 Optimum Binder Contents Determined from 218 Wheel-Tracking Test R esu lts
6 .3 .3 .3 Comparison of M arshall and Wheel-Tracking
Test R esults 221
6 .3 .3 .4 Summary of Conclusions 2 3 6 6.4 Optimum Binder Content in R e la tio n to
S ection PAGE
6.5 Mixture P ro p e rtie s in R elatio n to R esistance to
Deformation. 241
6.6 Laboratory-Road C o rre la tio n s . 247
CHAPTER 7
7. Main Conclusions 248
7.1 In tro d u c tio n . 2 4 9
7.2 The M arshall T e st. 2 4 9
7 .2 .1 Test Procedure. . 2 4 9
7 .2 .2 R e p e a ta b ility and R e p ro d u c ib ility . 2 4 9 7 .2 .3 Method of Measurement of S t a b i l i t y . 2 5 0 7 .2 .4 R esults Obtained fo r H.R.A. M ixtures. 2 5 1
7.3 The In d ir e c t-T e n s ile T e st. 251
7 .3 .1 Test Procedure. 251
7 .3 .2 R esu lts Obtained fo r H.R.A. M ixtures. 252 7.4 R elatio n sh ip between M arshall S t a b i l i t y and
In d ir e c t-T e n s ile S tren g th . 2 5 2 7.5 The Wheel-Tracking T e st. 2 5 3
7 .5 .1 Test Procedure. 2 5 3
7 .5 .2 R esu lts Obtained fo r H.R.A. M ixtures. 253 7.6 R elatio n sh ip between M arshall R esu lts and
Wheel-Tracking R e su lts. 2 5 4 7.7 Optimum Binder Content in R elatio n to
Mixture P r o p e r tie s . 2 5 4 7.8 Mixture P ro p e rtie s in R elatio n to R esistance
to Deformation. 2.55
7.9 P rin c ip a l Findings and C onclusions. 2 56
FURTHER WORK 261
S ectio n PAGE APPENDIX A
A. Computer Programs 2 9 3
A .l In tro d u c tio n 2 9 4
A. 2 MIX : Mixture Composition 294 A.3 MARSH : M arshall Test R esu lts 2 9 6 A.4 SPLIT : In d ire c t-T e n s ile Test R esu lts 2 9 8
APPENDIX B
B. D etailed Test Methods 300
B .l The M arshall Test 30.1
B.1.1 P re p a ra tio n of C o n stitu en t M ate ria ls 30.1 B . l . 2 P re p a ra tio n P rio r to Manufacture .30.1
B .l. 3 Mixing 302
B .1.4 Compaction 302.
B.1.5 D eterm ination of Specimen Density-Voids 303 B . l . 6 D eterm ination of S t a b i l i t y and Flow 3.04 B.1.7 Flow Chart fo r the M arshall Test 307 B.2 The I n d ire c t-T e n s ile Test 313 B .2.1 P re p a ra tio n of C o n stitu en t M ate ria ls 313 B .2 .2 P re p a ra tio n P rio r to Manufacture 31.3
B .2 .3 Mixing 3.13
B .2 .4 Compaction 313
B .2 .5 D eterm ination of Specimen Height 313 B .2 .6 D eterm ination of Specimen Density-Voids 314 B .2 .7 D eterm ination of In d ire c t-T e n s ile Stren g th 3.14
B.3 The Wheel-Tracking Test 316
S ection PAGE
B .3 .3 Mixing 316
B .3 .4 Compaction 317
B .3 .5 D eterm ination of Specimen Density-Voids 317
B .3 .6 Tracking Test 318
APPENDIX C
C. Data Recording Sheets 3 2 1
C .l In tro d u c tio n 322
C.2 Specimen Composition 322
C.3 Laboratory Data 323
C.4 M arshall Test R esu lts 324
C.5 In d ire c t-T e n s ile Test R esu lts 325 C.6 Wheel-Tracking Test R esu lts 326
APPENDIX D
D. Experim ental R esults 327
D .l M arshall Test R esu lts 3£8
D .1.1 In tro d u c tio n 328
D .1.2 Tables of R esu lts - Sand A (using Load Ring) 329 D . l . 3 Tables of R esu lts - Sand A 333 D.1.4 G raphical P re se n ta tio n s - Sand A .341 D.1.5 C o-operative Work a t E.R .C .A ., Tables of
R esults - Sand A 345
D.1.6 Tables of R esults - Sand B "as receiv ed " 346 D . l . 7 Tables of R esults - Sand B 348 D.1.8 G raphical P re s e n ta tio n s - Sand B 351 D.2 In d ire c t-T e n s ile R esu lts 355
D.2.1 In tro d u c tio n 356
S ection PAGE D .2 .3
D .2.4 D .2 .5 D.3 D.3.1 D .3 .2 D .3 .3 D .3 .4 D .3 .5 D .3 .6 D .3 .7
D .3 .8 D .3 .9
E. E .l E. 2 E .2.1 E.2.2 E.2.3 E.2.4 E.3 E.4 E .4.1 E .4 .2 E .4 .3 E.5
G raphical P re se n ta tio n s - Sand A 359 Tables of R esu lts - Sand B 363 G raphical P re s e n ta tio n s - Sand B 366 Wheel-Tracking Test R esu lts 3 7 0
In tro d u c tio n 371
Tables of R esu lts - Sand A 371 G raphical P re s e n ta tio n s - Sand A 373 Tables of R esu lts - Sand B 376 G raphical P re s e n ta tio n s - Sand B 378 Tables of R esu lts - Sand A, Rut Depth Data 381 G raphical P re s e n ta tio n - Sand A, Rut Depth 383 Data
Tables of R esu lts - Sand B, Rut Depth Data 384 G raphical P re s e n ta tio n - Sand B, Rut Depth 383 Data
APPENDIX E
S t a t i s t i c a l Methods 386
In tro d u c tio n 387
C h a r a c te r is tic s of D ispersions 387
A rithm etic Mean 387
Variance and Standard D eviation 387 C o e ffic ie n t of V a ria tio n 388
Range 388
Accuracy of the Mean 3 8 8
Comparison of Means 3 8 9
The t-T e s t 389
The F-Test ggQ
E.5.1 Linear R egression .3 9 2
E.5.2 Non-Linear Regression .392
ACKNOWLEDGEMENTS
The author wishes to extend h is s p e c ia l thanks to :
The ESSO Petroleum Company Lim ited, in c o lla b o ra tio n w ith whom, t h i s work was c a r rie d o u t.
Dr. I . F. Taylor (S h e ffie ld C ity P o ly tech n ic) and Mr. K. A.
Lammiman (ESSO Petroleum Co. L td ., now r e t i r e d ) , fo r t h e i r a s s i s t ance during the course of the work, in t h e i r ro le s as Academic and I n d u s tr ia l S upervisors, re s p e c tiv e ly and
Mr. A. P. Morton, fo r the in v alu ab le a ss is ta n c e and support given during the course of the la b o ra to ry work.
In a d d itio n , thanks are due to the follow ing people, who were of g re a t a ss is ta n c e throughout the work.
Mr. A. Thompson
Mr. P. F. Lonsborough Mr. S. Wilson
Mr. K. Wells
Mr. J . Holding, a l l of S h e ffie ld C ity Polytechnic Dr. F. D. Harper
Mr. D. M. G iles Mr. C. M. M itchell Mr. M. Dixon
Mr. A. J . S uart, a l l of the ESSO Petroleum Co. Ltd. and also
Mr. F. A. Jacobs (T ransport and Road Research Laboratory)
T otal mass of mix
Mass of coarse aggregate in mix
Mass of fin e aggregate and f i l l e r in mix Mass of fin e aggregate in mix
Mass of f i l l e r in mix Mass of binder in mix
% by mass, coarse aggregate in mix (stone c o n ten t) 7o by mass, fin e aggregate in mix
7o by mass, f i l l e r in mix
7o by mass, b in d er in mix (b in d er c o n ten t) R elativ e d e n sity of coarse aggregate R elativ e d e n sity of fin e aggregate R elativ e d e n sity of f i l l e r
R elativ e d e n sity of binder
7, f i l l e r re ta in e d on 75 micron sieve
7» fin e aggregate re ta in e d on 75 micron sieve 7o fin e aggregate re ta in e d on 2.36 mm sieve
R elativ e Mix D ensity (g/m l)
Compacted Aggregate D ensity (g/m l) Percentage Voids in Mix
Percentage Voids in the M ineral Aggregate Percentage Voids F ille d w ith Binder
Specimen Volume (ml) Specimen Height (mm) M arshall S t a b il i t y (kN) M arshall Flow (mm)
I.T .S . In d ir e c t T ensile Stren g th (N/mm x 10 )2 -1 T T ensile Q uotient (N/mm )2
D V e rtic a l Deformation a t F a ilu re (mm) T.R. Wheel-Tracking Rate (mm/hr)
R.D.ioo Rut Depth a f t e r 100 passes (mm) R*D ,1000 Rut Depth a f t e r 1000 passes (mm)
r#d,end Rut Depth a f t e r 45 minutes (mm)
Note to Reader
Throughout the in v e s tig a tio n , values of S^, S^, V^, V^, and B have been determined in accordance w ith B.S. 594 (1973). To m ain tain co n siste n cy w ith t h i s Standard, the u n its of and
3
S. are quoted as g/ml (e q u iv a le n t to g/cm ) and likew ise those
A
3 fo r B as ml (e q u iv a le n t to cm ) .
1. INTRODUCTION
Hot Rolled Asphalt (H.R.A.) i s a dense, im pervious, gap-graded m a te ria l. I t s com position i s based upon a s a n d - f i l l e r - binder m o rtar, com prising between 35 and 1007<> by mass of the m ixture depending upon the a p p lic a tio n , the remainder of the m ixture being a r e l a t i v e l y s in g le -s iz e d coarse aggreg ate.
As a wearing course m a te ria l H.R.A. has secured i t s e l f a p re eminent p o s itio n in the U.K. fo r the su rfa cin g of f le x ib le con
s tr u c tio n f o r motorways, tru n k and p r in c ip a l roads.
The most w idely used com position fo r t h i s purpose i s a low-stone c o n ten t m ixture c o n tain in g 307» by mass coarse ag g reg ate, w ith a fin e n a tu r a l sand, lim estone dust as f i l l e r and a f a i r l y high co n ten t of 50 p e n e tra tio n grade b i t u m e n . I t i s u s u a lly
la id to a th ic k n e ss of 40mm and a skid r e s i s t a n t su rface i s p ro vided by the a p p lic a tio n of coated ch ip p in g s.
The H.R.A. m ixtures used today have developed out of ex perience gained over a number of y e a rs. The f i r s t examples being la id
/ 6 \ on the Kings Road, Chelsea and Pelham S tr e e t, Kensington in 1895. '
S h o rtly a f t e r t h i s , an American C liff o rd Richardson came to England and helped in the development and p roduction of H.R.A. on a
were combined and the number changed to the more fa m ilia r B.S. 594. This was f i r s t issu ed in 1935 and since th a t time f u r th e r re v is io n s have been made in 1945, 1950, 1958, 1961 and most r e c e n tly in 1973. The only major changes over the y ears have been the continued in c re ase in the hardness of b in d er used f o r h e a v ily - tr a f f ic k e d roads and a re d u c tio n in the number of stone c o n te n ts s p e c ifie d .
The com position of H.R.A. m ixtures has in the p a st been s p e c ifie d in terms of " re c ip e s " , the p e rcen t by mass of each c o n s titu e n t being l i s t e d in ta b le form. The p re sen t e d itio n of B.S. 5 9 4 ^ ^ in clu d es re c ip e s p e c if ic a tio n s fo r wearing course m ixtures con ta in in g up to 557» by mass of coarse a g g re g a te . For each coarse aggregate' co n ten t th re e b in d er c o n ten t schedules are given, ranging from lean to r ic h r e l a t i v e l y speaking. Guidance on s e le c tio n of the a p p ro p ria te schedule i s given in the Standard, and i s based upon t r a f f i c i n t e n s i t y and geographical lo c a tio n . A ty p ic a l B.S. 594 re c ip e s p e c if ic a tio n fo r wearing course m ixtures i s given in ta b le 1.
The recip e method of s p e c if ic a tio n has a number of advantages in terms of the ease w ith which a m a te ria l can be s p e c ifie d , m anufactured w ith in given to le ra n c e s and be te s te d f o r compliance w ith the o r ig i n a l s p e c if ic a tio n . Over the years H.R.A.
pro-jf
duced in accordance w ith such s p e c if ic a tio n s has proven i t s e l f capable of providing an adequate and duiable su rfa cin g m a te ria l under heavy t r a f f i c c o n d itio n s . This success i s a tt r i b u t e d to i t s to le ra n ce to com position v a r ia tio n , i t s f l e x i b i l i t y , f a t
-/o \ / q\
TABLE 1
COMPOSITION OF WEARING COURSE MIXTURES - ROCK AGGREGATE (RECIPE METHOD)
Schedule No.
Percentage By Mass Of T o tal Mixture
Coarse Aggregate re ta in e d on 2.36mm t e s t
sieve SolubleBinder
Aggregate passing 75um B.S. t e s t sieve
1A 0 10.3 13.0
15 9.1 11.0
30 7.9 8.9
40 7.1 7.5
55 5.9 5.4
IB 0 10.8 14.0
15 9.6 12.0
30 8.4 9.9
40 7.6 8.5
55 6.4 6.4
1C 0 11.3, 15.0
15 10.1 13.0
30 8.9 10.9
40 8.1 9.5
and ease w ith which i t can be compacted to form a dense, imper meable la y e r. The moderate U.K. clim ate has a lso c o n trib u te d to t h i s success.
However, since the e a r ly 1960*s problems w ith H.R.A. re c ip e m ixtures have become ap p aren t. In c e r t a i n p a r ts of the U.K. the lo c a lly a v a ila b le aggregates were not producing com pletely s a ti s f a c t o r y m ixtures f o r use on h e a v ily tr a f f ic k e d roads and motorways. P a r ti c u la r ly a t severe s i t e s , n ot^ably steep g ra d ie n ts where
heavy t r a f f i c was slow and c a n a liz e d , marked permanent deform ation was occurring and producing r u ts in the wheel tra c k s . A t y p ic a l example of t h i s i s described by Windmill, while P l e a s e ^ ^ re p o rts th a t marked deform ation had occurred in Schedule 1 H.R.A. *s on a s t r a i g h t s e c tio n of dual-carriagew ay a f t e r only th re e years tr a f f i c k i n g .
The form ation of such r u t s has adverse e f f e c t s upon the r id in g q u a lity and s a fe ty of the su rfa cin g and causes f u r th e r c a n a liz a tio n of t r a f f i c which serves to worsen the s i tu a t io n . The d e fo r
mation which i s ev id en t a t the road surface may r e s u l t from the accum ulation of deform ations of a l l the pavement la y e r s , p lu s deform ation of the underlying subgrade. The l a t t e r i s not
(4) u su a lly a problem in the U.K., where adequate pavement design en su res, by the p ro v isio n of adequate la y e r th ic k n e ss , th a t sub grade deform ations are n e g lig ib le . The problem in the U.K. i s , th e r e fo re , a sso c ia te d w ith deform ations confined to the
pave-( 12) ment la y e rs , and in p a r t i c u l a r , the uppermost su rfa cin g la y e r s .
deform ations. When H.R.A. deforms due to the passage of a wheel, p a r t of the deform ation i s recovered im m ediately, p a rt reco v ers a f t e r some delay and a small amount is irre c o v e ra b le ,
(13)
permanent deform ation. ' I t is the accum ulation of such permanent deform ations over a period of time which i s the major cause of r u t t i n g . The deform ation behaviour described p rev io u s ly i s not only in flu en ced by the i n t r i n s i c p ro p e r tie s of the m ixture but a lso by c e r t a in e x te r n a l f a c to r s , in p a r t i c u l a r ,
(14) t r a f f i c loading and c lim a tic c o n d itio n s .
In the U.K. during the 1960's and 1970's a rap id growth in the
(15) number and weight of commercial v e h ic le s using major roads o c c u rre d ' and t h i s was a major f a c to r c o n trib u tin g to the appearance of
the deform ation problems and i t s continued presen ce. More
r e c e n tly the e x c e p tio n a lly hot summers of 1975 and 1 9 7 6 ^ ^ served to a c c e le ra te the occurrence and s e v e rity of the problem.
Secondly, although the s p e c if ic a tio n makes c e r ta i n requirem ents reg ard in g the p ro p e rtie s of the c o n s titu e n ts , th ere are d i f f e r ences in s p e c ific g ra v ity , grading, p a r t i c l e shape and su rface
te x tu re which have a marked e f f e c t upon the p ro p e rtie s of the (11}
r e s u ltin g m ix tu re. P le a s e v J in d ic a te s th a t t h i s i s p a r t i c u l a r ly tru e fo r the sand f r a c t io n , fo r 307, stone H.R.A. wearing course m ixtures a t a fix e d m id -s p e c ific a tio n b inder c o n ten t of 7.97o by mass, r e s is ta n c e to deform ation as measured in the la b o ra to ry can vary by a f a c to r of 10 depending upon the type of sand used. In a d d itio n , the use of a s p h a ltic cements of the same p e n e tra tio n grade but d i f f e r e n t rh e o lo g ic a l p ro p e rtie s can a lso a f f e c t re s is ta n c e to deform ation by the same degree.
In the p r a c t i c a l s i tu a t io n t h i s v a r ia tio n could be even g r e a te r when a d d itio n a l fa c to r s such as hardening of the b in d er during mixing and d iffe r e n c e s in coarse aggregate and f i l l e r are con
s id e re d .
By the end of the 1960's th e re was, th e re fo re , a need fo r H.R.A. su rfa cin g m ixtures w ith an in creased r e s is ta n c e to deform ation under heavy t r a f f i c . One of the p o ssib le s o lu tio n s a v a ila b le to achieve t h i s end was the adoption of a Mix Design tech n iq u e, based upon a Mechanical t e s t i n g procedure. Mix Design can be considered in simple terms as the s e le c tio n of c o n s titu e n t p ro p o rtio n s w ith the aid of r e s u l t s obtained from a Mechanical t e s t . Such a procedure may or may not include design c r i t e r i a r e la te d to t r a f f i c i n t e n s i t y and c lim a tic c o n d itio n s. Provided a s u ita b le t e s t procedure could be adopted, b e n e f its should be gained from, in p a r t i c u l a r , the s e le c tio n of the a p p ro p ria te b in d er con ten t f o r the c o n s titu e n ts used, enab lin g the pro d u ctio n of m ixtures of optimum com position as reg ard s perform ance.
S uccessful a p p lic a tio n of such a design method, may a lso make i t p o ssib le to design adequate m ix tu res, using m a te ria ls a t p re s e n t excluded by the s p e c if ic a tio n , thus enab lin g the b e s t use to be made of lo c a lly a v a ila b le ag g reg ates.
In December, 1973 an e x ten siv e re v is io n of B.S. 5 9 4 ^ ^ was issu ed which included f o r the f i r s t time a Mix Design procedure based upon a Mechanical t e s t . This s e c tio n was a t t h i s stage an o p tio n a l a lte r n a tiv e to the re c ip e method of s p e c if ic a tio n fo r H.R.A. wearing course m ix tu res. The Mechanical t e s t procedure upon which th is design method was based, was the M arshall t e s t . This method of te s t i n g had p re v io u sly been used e x te n s iv e ly abroad and in p a r t i c u l a r in the U . S . A . I t s use had in the p a st
(18 }
been confined to A sphaltic C oncretev } and had fo r some y ears (19) been used in the U.K. in connection w ith a i r f i e l d pavements
d e ta ile d in B.S. 5 9 4 ,^ ^ re q u ire s the s e le c tio n of an optimum binder co n ten t fo r the, s a n d - f ille r - b in d e r m o rtar, based on r e s u l t s obtained in the M arshall t e s t . An adjustm ent is then ap p lied in o rd er to o b ta in a ta r g e t b in d er co n ten t f o r the t o t a l m ixture, coarse aggregate included.
Since the in tro d u c tio n of the o p tio n a l mix design procedure, r e s u l t s from f u l l scale road t r i a l s , la b o ra to ry in v e s tig a tio n s and feedback from in d u stry has fu rn ish ed inform ation reg ard in g the performance of designed m ix tu res, and has allowed r e - a p p r a is a l of the procedure. As a r e s u l t , a d d itio n a l s p e c if ic a tio n c la u se s fo r H.R.A. wearing course m i x t u r e s ^ ^ (21) were i ssue(j i n Feb ru a ry , 1979. The in tro d u c tio n of these c lau se s made the use of the Mix Design procedure compulsory fo r a l l su rfa cin g and re s u rfa c in g work on tru n k roads and motorways, w ith e f f e c t from 1 s t, A p ril, 1980, and a lso included, amongst o th e rs , a re q u ire ment fo r m ortar s t a b i l i t y a t i t s optimum b in d er c o n te n t, depending upon t r a f f i c flow. The c o lle c tio n of inform ation in the manner in d ic a te d p re v io u sly w il l continue and f u r th e r updating of the procedure w i l l take place as i t becomes n ecessary .
This then i s the c u rre n t p o s itio n reg ard in g H.R.A. Mix Design in B r itis h p r a c t i s e , a t p re sen t B.S. 594 i s undergoing a f u r th e r major r e v is io n which i s due to be published in the near f u tu r e .
( 2 2 )
t o t a l m ixture would seem the next lo g ic a l s te p .
2. BACKGROUND INFORMATION
2.1 The Mechanical T esting of Bituminous Paving M ixtures
2 .1 .1 In tr o d u c tio n :
The follow ing s e c tio n s review in g en eral terms the a p p lic a tio n of Mechanical te s t in g procedures to Bituminous Paving m ixtures w ith an emphasis on those used to asse ss r e s is ta n c e to deform ation.
Since the e a r ly p a rt of t h i s cen tu ry many such procedures have been developed in many c o u n trie s , n o tab ly the U.S.A. When con s id e rin g the wide d iv e r s ity of the a v a ila b le methods, i t i s con v e n ien t to make a d i s t i n c t i o n , based upon the n atu re of the t e s t i t s e l f , and regard these methods as being e i th e r
Em pirical methods, Fundamental methods or Sim ulative methods.
2 .1 .2 Em pirical Test Methods: 2 .1 .2 .1 General
An Em pirical t e s t i s one in which some a r b i t r a r y p ro p e rty of a compacted paving mixture is determ ined, ty p ic a lly the maximum
load su sta in e d under given loading c o n d itio n s . Such t e s t methods now form the b a s is of many w idely used Mix Design procedures in which t e s t r e s u l t s are considered along w ith the d e n sity and void co n ten t of compacted specimens, in order to s e le c t a m ixture com p o s itio n which w il l perform adequately from the p o in t of view of r e s is ta n c e to deform ation and d u r a b i l it y , y ie ld in g a m ixture w ith :
( i i ) S u f fic ie n t s t a b i l i t y to w ithstand t r a f f i c loading w ith out undue d i s t o r t i o n .
( i i i ) S u ffic ie n t a i r voids to allow fo r s l i g h t a d d itio n a l
compaction under t r a f f i c w ithout bleeding or lo ss of s t a b i l i t y , y et low enough to exclude a i r and m o istu re.
(iv ) S u f fic ie n t w o rk a b ility to perm it easy placement and compaction to the re q u ire d d e n sity .
In most cases an "optimum binder co n ten t" fo r a given aggregate g ra d a tio n i s s e le c te d and i s used d i r e c t l y or a c ts as a guide to the binder co n ten t to be used in p r a c t i s e .
In such t e s t s , i t i s the a r b i t r a r y p ro p erty measured which i s
«
used to a sse ss a m ix tu re 's re s is ta n c e to deform ation under t r a f f i c , o fte n termed " s t a b i l i t y " . This p ro p e rty i s not a measure of any i n t r i n s i c m ixture p ro p e rty , i t i s , th e r e fo re , e s s e n t i a l th a t a c o r r e la tio n between la b o ra to ry and road performance be e s ta b lis h e d . This done, i t i s then p o ssib le to define design c r i t e r i a in terms of la b o ra to ry param eters, to be applied depending upon t r a f f i c and c lim a tic c o n d itio n s .
2 .1 .2 .2 Common Em pirical Test Methods M arshall t e , t < l ><7><17>(23>
Hveem S tabilom eter and Cohesiometer t e s t ^ ^ ^ 7^ 24^ Hubbard - F ield t e s t ^ 1™ 25*'^26>
Duriez t e s t . <14><27>
2 .1 .2 .3 Advantages of Em pirical Test Methods
( i ) Equipment and procedures are u s u a lly sim ple.
com positions to be assessed quick ly .
( i i i ) Provided they are used w ith in the c o n s tr a in ts of proven la b o ra to ry - road c o r r e la tio n s , adequate, economic m ixtures can be produced.
( iv ) T heir s im p lic ity and speed of o p e ra tio n means they can e a s i l y be adopted f o r o n -s ite q u a lity c o n tro l.
2 .1 .2 .4 Disadvantages of Em pirical Test Methods
( i ) I t is n ecessary to e s ta b l i s h a c o r r e la tio n between la b o ra to ry and road performance before r e s u l t s can be of any p r a c t i c a l u s e .
( i i ) Many t e s t s are only ap p lic ab le to a lim ited range of mix tu re types and w e ll defined c o n d itio n s of t r a f f i c and c lim a te . ( i i i ) R esu lts obtained w ith d i f f e r e n t Em pirical methods do not agree w ith each o th e r to any g re a t e x te n t.
( iv ) Loading c o n d itio n s o fte n bear no resemblance to those found in p r a c t i s e .
( v) In most cases i t i s not p o ssib le to analyse the s tr e s s e s a c tin g during t e s t i n g .
2 .1 .3 Fundamental Test Methods: 2 .1 .3 .1 General
A Fundamental t e s t s e ts out to measure some i n t r i n s i c (fundam ental) p ro p erty of the m ixture under t e s t . Unlike Em pirical methods, they a re , w ith c e r t a i n ex ce p tio n s, u n su ita b le fo r Mix Design a p p li c a tio n s and tend, th e re fo re , to be considered as re se a rc h t o o ls .
( r a t io n a l ) approach. Others developed more re c e n tly allow the d eterm in atio n of those p r o p e rtie s re q u ired fo r computer programs used in m u lti- la y e r e l a s t i c ( v is c o e la s tic ) methods of pavement design.
2 .1 .3 .2 Common Fundamental Test Methods: T r ia x ia l t e s t < D (2 8 )(2 9 )(3 0 )(3 1 )
(1 )(3 2 ) Unconfined Compression t e s t
In d ire c t-T e n s ile t e s t ^ 33^ 3^ U niaxial Creep t e s t ^ 35^ 36^ 37^ Various rep eated loading t e s t s :
Dynamic Modulus t e s t ^ 35^ 39^ 40^ Fatigue t e s t (38)(40)
/ 30 \
Dynamic Creep t e s t .
2 .1 .3 .3 Advantages of Fundamental Test Methods:
( i ) Loading systems employed perm it the c a lc u la tio n of s tr e s s e s a c tin g during te s t in g .
( i i ) S tre sse s more c lo s e ly resem bling those found in p r a c tis e can be reproduced.
( i i i ) R esu lts obtained perm it a more th e o r e t ic a l approach to the problem of re s is ta n c e to deform ation, and a com puter-aided approach to Pavement Design.
2 .1 .3 .4 Disadvantages of Fundamental Test Methods:
( i ) T esting equipment i s u s u a lly complex, expensive and re q u ire s tra in e d o p e ra tiv e s .
( i i ) Time req u ired fo r t e s t i n g i s o fte n c o n sid e ra b le .
to re se a rc h r a th e r than p r a c t ic a l a p p lic a tio n s .
2 .1 .4 Sim ulative Test Methods: 2 .1 .4 .1 General
Test methods re f e r r e d to p re v io u sly are considered to have 2 major drawbacks. F i r s t l y , in many cases the loading c o n d itio n s and the s tr e s s e s produced w ith in the specimen f a i l to sim ulate the p r a c t i c a l s it u a ti o n . Secondly, even i f i t i s p o ssib le to re p ro duce such c o n d itio n s , d i f f i c u l t i e s a r is e when try in g to apply r e s u l t s obtained fo r t e s t specimens to the behaviour of the same m ixtures in a layered pavement system.
As the name su g g ests, sim u lativ e t e s t s s e t out to overcome such shortcomings by attem pting to sim ulate the c o n d itio n s experienced in the p r a c t i c a l road s it u a ti o n .
2 .1 .4 .2 Common Sim ulative Test Methods: Laboratory Wheel-Tracking t e s t ^ ^ ^ ^ ^ ^ M iniature Test T racks(****)
Large-Scale Test Tracks
F u ll Scale Road T r i a l s / 46X 48X 49)
2 .1 .4 .3 Advantages of Sim ulative Test Methods:
( i ) Simulate to varying degrees, the loading c o n d itio n s , s t r e s s e s , compaction, environment and layered s tru c tu re found in p r a c t i s e .
( i i ) Allow assessm ent of re s is ta n c e to deform ation under r e a l i s t i c c o n d itio n s, thereby allow ing m ixtures to be "ranked" more r e a l i s t i c a l l y than by o th e r methods.
under r e a l environm ental and t r a f f i c c o n d itio n s to be observed.
2 .1 .4 .4 Disadvantages of Sim ulative Test Methods:
( i ) They are in g en eral more expensive to c o n stru c t and operate than "conventional" t e s t methods.
( i i ) Require more time to c a rry out and in the case of Large- Scale t e s t tra c k s and F u ll-S c a le Road T r ia ls t h i s time can be p r o h i b i t i v e .
( i i i ) In F u ll-S c a le Road T r ia ls and Large-Scale t e s t tr a c k s , environm ental f a c to rs are v a r i a b l e .
( iv ) R esults from Laboratory Wheel-Tracking t e s t s and M iniature t e s t tra c k s need to be c o rr e la te d w ith a c tu a l road performance before the r e s u l t s are of p r a c ti c a l use.
2.2 Test Methods Used in the Current I n v e s tig a tio n ; 2 .2 .1 In tr o d u c tio n :
The follow ing s e c tio n s r e f e r in d e t a i l to v ario u s asp e c ts of the t e s t methods used in the c u rre n t in v e s tig a tio n . These methods are name l y :
M arshall t e s t
In d ire c t-T e n s ile t e s t and Wheel-Tracking t e s t .
I t should be noted th a t many of the previous a p p lic a tio n s have not been d i r e c t l y r e la te d to H.R.A., however, in o rd er to draw upon the experience gained w ith o th e r m a te r ia ls , the au th o r f e l t i t necessary to re p o rt upon a p p lic a tio n s to Bituminous m ixtures in g e n eral; w ith s p e c ific re fe re n ce to H.R.A. whenever p o s sib le ^
2 .2 .2 The M arshall Test Method: 2 .2 .2 .1 O utline of Test Method
M ixtures are made up a t s e v e ra l b in d er co n ten ts and c y l i n d r i c a l specimens 101.6 mm d ia x approx 63.5 mm high (4 in d ia x 2.5 in ) are compacted in s t e e l moulds using a standard drop-hammer. (See l a t e r ) .
D eterm inations are then made to f a c i l i t a t e the c a lc u la tio n of the d e n sity and void co n ten t of specimens.
M arshall Flow (mm or 0.01 in ) r e s p e c tiv e ly .
From the r e s u l t s o b tain ed , an "optimum b inder c o n te n t" i s d e te r mined, the manner in which t h i s i s done depends upon the type of mix and i t s a p p lic a tio n .
(7 )(1 7 )(2 3 ) N.B. A more d e ta ile d d e s c rip tio n can be found elsew here.
2 .2 .2 .2 H is to r ic a l Background:
The M arshall t e s t procedure was o r i g i n a l ly developed in America by Bruce M arshall of the M iss is sip p i S tate Highways Department.
During the 1940*s, the U.S. Corps of Engineers adopted t h i s method of t e s t i n g and developed around i t the M arshall Mix Design p ro cedure, v a r ia tio n s on which are w idely used today. The work c a r r ie d out to t h i s end was tw o -fo ld :
( i ) the development of a compaction procedure, which r e s u lte d in specimen d e n s it ie s e q u iv a le n t to those of pavement c o re s, ( i i ) the e stab lish m en t of s u ita b le design c r i t e r i a fo r s e le c tio n of "optimum b in d er c o n te n t", based on the r e s u l t s from the t r a f f ick in g of a F u ll-S c a le Test Track a t the U.S„ Waterways Experim ental
(51) S ta tio n s , Vicksburg, M is s is s ip p i.
The r e s u l t s from the above le d . to the adoption of the drop-hammer method of compaction and the design c r i t e r i a s e t down in ta b le 2. Optimum binder co n ten t (O.B.C.) being based upon the mean of the b in d er c o n ten ts corresponding to the follow ing in the la b o r a to ry t e s t :
( i ) Maximum S t a b i l i t y . ( i i ) Maximum Mix D ensity.
ra n g e .
( iv ) A value of Voids f i l l e d w ith Binder a t the middle of the sp e c ifie d ra n g e .
N.B. A check i s then made to ensure a l l c r i t e r i a , in clu d in g Flow, are met a t t h i s O.B.C.
This procedure fo r Mixture design is a p p lic a b le to A sp h altic Concrete w ith a nominal maximum aggregate s iz e of 25 mm (1 in ) or l e s s ,
fo r the su rfa cin g of a i r f i e l d pavements, and forms p a rt of an (52)
o v e r a ll Pavement Design procedure.
Table 2
M arshall Design C r i t e r i a : A sphaltic Concrete (S u rfa cin g s)
U.S. Corps of Engineers - AIRFIELDS
S t a b i l i t y A ll m ixtures 500 lb min (2220N)
Flow A ll m ixtures 20 (0.01 in ) max (5 .1 mm) Voids in Mix A sp h altic Concrete 3 - 5%
Sand Asphalt 5 - 7% Voids F ille d A sphaltic Concrete 75 - 85% w ith Binder Sand Asphalt 65 - 75%
Asphalt I n s t i t u t e - HIGHWAYS
TRAFFIC CATEGORY HEAVY MEDIUM LIGHT
Blows per face 75 50 35
S t a b i l i t y (min) 750
(3340) 500(2220) 500(2220) Flow (min - max) 8 - 1 6
(2 .0 - 4 .1 ) 8 - 1 8 (2 .0 - 4 .6 ) 8 - 2 0 (2 .0 - 5 .1 ) Voids in Mix
(min - max) 3 - 5 3 - 5 3 - 5
Voids in M ineral
Aggregate Minimum value given in design manual depending on nominal maximum s iz e of a g g re g a te .
(19) U.K. - AIRFIELDS 1
S t a b i l i t y 1800 lb (min) (8000N) Flow 0 - 1 6 (0.01 in ) (4 .1 mm) Voids in Mix CO i <r
Voids f i l l e d
Table 3
I n te r n a tio n a l M arshall Requirements fo r Heavily T raffick ed Roads
( a f t e r Akcroyd e t a l ^ ^ ) .
Country
Blows per face
Stab i l i t y (min)
(kN) Flow(mm) Quotient(kN/mm)
Voids in Mix(7o)
Void in m ineral aggregate (%)
France 50 8.0 1 .0 -3 .0 - 4 max
-Germany 75 3.0 1 .0 -4 .0 - 1-4
-I t a l y 75 8.0 1 .0 -3 .5 - 3-6
-Holland 50 5.5 2 .5 -4 .5 3.0* 2-4 -Spain 75 7.5 2 .0 -3 .5 1 .5 -2 .0 3-5 15-22 Sw itzerland 50 10.0 1 .8 -2 .2 - 2-4
-Turkey 50 6.0 2 .5 -4 .5 - 3-5 12*
U.S.A. 75 5.0 2 .0 -4 .5 - 3-5 15*
Canada 75 5.4 2 .0 -5 .0 - 2-5 14-15
Japan 75 6.0 2 .0 -4 .0 - 3-5 17-20
South
A frica 75 4.5 2 .0 -4 .0 1.5* 2-10 15"JU
In the U.K., use has been lim ited to the design of a i r f i e l d su r-(19)
fa c in g s, w ith design c r i t e r i a based on those o r i g i n a lly d ev el oped being used, see ta b le 2. U n til re c e n tly i t s a p p lic a tio n
to Highway su rfacin g s had been lim ited to a few experim ental s e c tio n s of a s p h a ltic c o n c r e te .
2 .2 .2 .3 A p p licatio n to Hot Rolled Asphalt
The M arshall t e s t was included in B.S. 594 (1 9 7 3 ) ,^ ^ as an o p tio n a l a lte r n a t iv e to the recip e method of s p e c if ic a tio n fo r H.R.A. wearing course m ix tu res. This was the f i r s t a p p lic a tio n of a Mix Design method to H.R.A. in the U.K. and the reasons fo r the s e le c tio n of the M arshall t e s t fo r t h i s purpose would appear to stem from a com bination of the follow ing:
( i ) S im p licity of apparatus and procedure.
( i i ) Worldwide acceptance of t h i s method, fo r the design of o th e r dense bituminous su rfa c in g s, and the a ss o c ia te d know ledge gained from t h i s .
( i i i ) A v a ila b ility of equipment and tra in e d p ersonnel in many U.K. la b o r a to r ie s .
/ 56 \
As e a r ly as 1958, Broome and Please rep o rted on an in v e s t ig a ti o n to determine the u sefu ln ess of Mechanical t e s t s in the design
of H.R.A. su rfa c in g s, in which the M arshall t e s t was one of 8 t e s t s co n sid ered . Since then, i n t e r e s t in the M arshall t e s t
(57)
appears to have grown, in 1961, P lease d iscu ssed i t s value in a s s is tin g in the design of H.R.A. wearing course m ix tu res, and i t s a b i l i t y to measure the re s is ta n c e to deform ation of such m ix tu re s.
-Asphalt and Coated Macadam A sso ciatio n (T.R.R.L. - A.C.M.A.) (58 }
Working P arty was, s e t up to in v e s tig a te in g re a te r d e t a i l the a p p lic a tio n of the M arshall t e s t to H.R.A. mix d esig n .
This took the form of an in te r - l a b o r a to r y study, in which 6 la b o r a t o r i e s , using the d r a f t t e s t procedure, proposed fo r the fu tu re (1973) re v is io n of B.S. 594, in v e s tig a te d the p ro p e rtie s of H.R.A. m ixtures comprised of 8 d i f f e r e n t fin e aggregate sands covering a wide range of p h y sic a l p r o p e r tie s . The r e s u l t s of t h i s in
-(59) v e s tig a tio n fu rn ish ed in fo rm atio n reg ard in g the range of O.B.C.
(59)
and M arshall S t a b i l i t y which could be expected fo r " ty p i c a l 11 sands a v a ila b le in the U.K., and the degree of r e p e a t a b i l i t y and
( 58 } r e p r o d u c ib ility of t e s t r e s u l t s .
The c o r r e la tio n of la b o ra to ry r e s u l t s and f i e l d performance is an e s s e n t i a l p a rt of design procedures based on Em pirical t e s t s , and to t h i s end, F u ll Scale Road T r ia ls have been l a i d ^ ' ^ ' ^ ^ ^ on s e c tio n s of h e a v ily tr a f f ic k e d roads in the U.K. Most
impor-(59) ta n t of these was th a t la id on the A.33 W inchester-by-pass in 1972 which in co rp o rated 307, stone H.R.A. m ixtures comprised of the 8 sands in v e s tig a te d p re v io u sly . Although p e r io d ic a lly m onitored, no inform ation reg ard in g the performance of the m ixtures under t r a f f i c has y e t been p u b lish ed .
The o p tio n a l Mix Design-procedure introduced in 1973^^ e n t a i l s the d eterm in atio n of an optimum b in d er co n ten t fo r the s a n d - f i l l e r - b inder p o rtio n of the mix, coarse aggregate is not in clu d ed .
follow ing param eters are p lo tte d vs. binder c o n ten t: Mix d e n sity (S^),
Compacted Aggregate d e n sity (S .)A M arshall S t a b i l i t y (S)
The O.B.C. i s taken as the mean of the 3 b in d er co n ten ts c o r r e s ponding to the maximum values of S^, and S, an adjustm ent is then made to o b ta in a Target b in d er c o n ten t fo r a m ixture c o n ta in ing S7o coarse a g g re g a te .
N.B. No lim itin g v a lu es, regarding S t a b i l i t y , Flow or Void Content were included a t t h i s tim e.
In the years follow ing 1973, feedback from in d u stry , continued m onitoring of F u ll-S cale Road T r ia ls and fu r th e r la b o ra to ry work
secured d ata f o r r e - a p p r a is a l of the o r i g i n a l design procedure. On the b a s is of t h i s in February, 1979 the issu e of Departmental
(20) (3)
Table 4:
Requirements fo r H.R.A. Wearing Course M ixtures (d esig n method) a f t e r HD/2/79
(a) Optimum binder c o n ten t of s a n d - f ille r - b in d e r m ortar - not le s s than 9.270 by mass.
(b) S t a b i l i t y :
T r a f fic Flow (Commercial V ehicles per day)
Minimum S t a b i l i t y a t m ortar O.B.C. (Newtons)
Less than 2000 3000 2000 - 4000 4500 4000 - 6000 5500 More than 6000 6500
(c) Flow: not g r e a te r than 5 mm a t m ortar O.B.C.
F u rth er, the design method was extended to cover m ixtures c o n ta in -/ 61 \
ing Crushed Rock Fine aggregate and Heavy-Duty bitumen, in an attem pt to gain f u r th e r improvements in mixture perform ance.
This then i s the p re sen t s i t u a t i o n in the U.K., elsew here, m ixtures (14)
Minimum S t a b i l i t y 3330 N
Flow 2.0 - 4.6 mm
Voids in Mix 4 - 6 7»
( 65
L a te r, in 1974, Marais puts forward te n ta tiv e design c r i t e r i a f o r H.R.A. m ix tu res, and these are included in ta b le 3.
2 .2 .2 .4 E ffe ct of Sand F ra c tio n on Binder Requirement and Asphalt P ro p e rtie s
D iffe re n t sands although conforming to B.S. 594 grading lim its re q u ire d if f e r in g amounts of b in d er in o rd er to produce the most s ta b le and durable mix. This r e s u l t s d i r e c t l y from d iffe r e n c e s in the p h y sica l p ro p e rtie s of the sands, namely
P a r t i c l e - s i z e d i s t r i b u t i o n (grading) P a r ti c le shape
Surface t e x t u r e .
These in flu en ce the packing c h a r a c t e r i s t i c s and in p a r t i c u l a r th« voids in the compacted aggregate and hence the amount of b in d er which can be held by the m i x . ^ ^
/ r-i \ / r r \
For s a n d - f ille r - b in d e r m ixtures P rice and Duthie concluded th a t grading was the major f a c to r governing the b ind er c o n ten ts re q u ire d to produce maximum mix d e n sity and max s t a b i l i t y .
P a r ti c le shape, surface te x tu re and to a le s s e r e x te n t grading
( 66") ( 67")
a lso in flu en ce the value of maximum s t a b i l i t y a tta in e d by a given mix, as a r e s u l t of t h e i r e f f e c t on i n t e r n a l f r i c t i o n and p a r t i c l e in te r lo c k . In the li g h t of the requirem ents of
( 21)
HD/2/79, emphasis has s h if te d to the s e le c tio n of rough/angular sands in ord er to produce high s t a b i l i t y mixes, here again the M arshall t e s t i s of use in a sse ssin g which sands are s u ita b le fo r the s e v e re st t r a f f i c c o n d itio n s .
To i l l u s t r a t e the e f f e c t of grading on the p ro p e rtie s of the r e s u ltin g mix, a tte n t i o n i s drawn to ta b le 5. Showing the e f f e c t on binder co n ten t fo r maximum s t a b i l i t y and the value of maximum s t a b i l i t y , of a l te r i n g the grading of a sin g le sand, w ith in the lim its of B.S. 594.
Table 5 :
E ffe ct of Grading on M arshall P r o p e r tie s :
( 68 ^
(Based on the work of Bellamy )
Grading
Property Coarse-end B.S. 594 M id-point B.S. 594 Fine-end B.S. 594 Binder Content fo r
Maximum S t a b i l i t y
(7o by mass) 7.0 8.0 11.0
Maximum S t a b i l i t y
(Newtons) 5775 4485 3100
The preceding has r e la te d to s a n d - f ille r - b in d e r m ix tu res.
in determ ining the binder requirem ent and p ro p e rtie s of the mix, confirm ing s im ila r fin d in g s fo r A sphaltic C oncrete.
2 .2 .2 .5 R e p e a ta b ility and R e p ro d u c ib ility ;
For a t e s t method to be s a t i s f a c t o r i l y ap p lied to Mix Design, the r e s u l t s obtained must be re p e ata b le and re p ro d u c ib le . These terms are defined e l s e w h e r e a n d r e f e r to the degree of v a r ia tio n a sso c ia te d w ith the ex ecu tio n of the t e s t procedure.
^ (7 2 )(7 3 )(7 4 )(7 5 )(7 6 )(7 7 ) . ^ . . , , . Numerous au th o rs have re p o rte d co n sid erab le v a r ia tio n in measured S t a b i l i t y values fo r what are nom inally
i d e n ti c a l samples of A sphaltic C oncrete. Q uantified in terms (73)
of Standard D eviation r e s u l t s included in ta b le 6a in d ic a te values ranging 550 - 1670N (100 - 300 l b s .) In c o n sid erin g these r e s u l t s i t must be recognised th a t although they r e f e r to sin g le o p e ra to rs using sin g le s e ts of a p p aratu s, m ixtures were sampled from o p e ra tio n a l mixing p la n t, thereby in tro d u cin g sources
(73) of v a r ia tio n not re la te d to t e s t method alone.
( 78 ) In a c o n tro lle d la b o ra to ry in v e s tig a tio n in 1962, Vokac d e t ermines a value of 340N (61 lb s) fo r Standard D eviation. However, the v a l i d i t y of t h i s r e s u l t must be questioned as the standard
(76 drop-hammer compactor was not used and t h i s i s considered by some to be one of the major sources of the v a r ia tio n a sso c ia te d w ith t h i s t e s t .
Table 6 :
M arshall Test : R e p e a ta b ility and R ep ro d u cib ility
(a) Ploft-b Studies - A sphaltic Concrete
Source of Data Standard Dev: lbs .a tio n - S t a b i l i t y Newtons Odasz and Nafus^7^ 1954 255 1400
C orbett and Warden^ 7^ 1955 132 - 264 720 - 1450 C orbett 1956 140 - 195 770 - 1075 P a rk e r(75) 1956 275 - 301 1500 - 1650
N e v itt^ 76) 1959 199 1100
Shook^77^ 1960 155 850
(b) Laboratory Studies - Hot Rolled Asphalt ( a f t e r H i l l s ^ ^ )
R esults are mean values fo r m ixtures c o n tain in g 8 d i f f e r e n t sands, te s te d in .6 d if f e r e n t la b o r a to r ie s .
MORTAR MIXES - p ro p e rtie s a t OBC.
R e p ro d u c ib ility (R) R% S t a b i l i t y (kN) 2.3 47
Flow (mm) 1.5 36
Quotient (kN/mm) 0.7 57
307o Stone Mixes - p ro p e rtie s a t OBC.
S t a b i l i t y (kN) 2.8 36
Flow (mm) 1.1 36
Quotient (kN/mm) i . 6 61
N.B. R e p ro d u c ib ility (R) = Standard d e v ia tio n x 2.77 R% = R x 100
These fig u re s were obtained in the TRRL - ACMA study r e fe rre d to ( CO \
p re v io u sly , ' and are in clo se agreement w ith r e s u l t s obtained in an ex ten siv e in v e s tig a tio n of a s im ila r natu re c a r r ie d out in Holland, and those p resen ted by H i n g l e y . ^ ^
From the a v a ila b le inform ation, i t i s apparent th a t a t p re se n t the r e p e a ta b i li t y and r e p r o d u c ib ility of the M arshall t e s t arse u n a c c e p ta b le .
2 .2 .2 .6 What is Measured in the M arshall Test?
In the l i t e r a t u r e the M arshall t e s t is v a rio u s ly described as a "type of unconfined compression t e s t " o r a "type of sem i-confined compression t e s t . " Due to the natu re of the loading c o n d itio n s
(
81)
i t is im possible to analyse the s tr e s s c o n d itio n s during the t e s t and i t is a lso concluded th a t a c e r t a i n degree of l a t e r a l c o n fine-( 82 } ment i s imposed upon the specimen due to f r i c t i o n fo rc e s .
The presence of confinement means th a t the t e s t is not e q u iv a le n t (8 3')
to an unconfined compression t e s t on t a l l specimens, however, an eq u iv alen t degree of confinement can be produced in unconfined compression t e s t s on specimens w ith low, h e ig h t-d ia m e ter r a t i o s .
Hence, when ta lk in g in terms of M arshall S t a b i l i t y we are e s s e n t i a l l y co n sid erin g a measure of s h e a r-s tre n g th under c o n d itio n s of lim ite d f r i c t i o n a l ( l a t e r a l ) support, the l a t t e r in c re a sin g as S t a b i l i t y i n c r e a s e s . Under such co n d itio n s the m ixture under t e s t r e l i e s to a large e x te n t upon Cohesion to develop i t s s tre n g th .
M arshall Flow on the o th e r hand is simply a measure of permanent s t r a i n a t f a i l u r e , re s is ta n c e to such s t r a i n being obtained p rim a rily
( 8 5 \
from aggregate in te rlo c k and in te r n a l f r i c t i o n . McLeod, p o in ts ( 78 \
M arshall Flow and Angle of In te r n a l F r ic tio n which i s seen by
( 69 }
Lees to imply th a t Flow i s d i r e c t l y re la te d to the geometry of the o r ig i n a l aggregate s tr u c tu r e . In comparing Flow w ith Hveem R elativ e S t a b i l i t y , P le a s e ^ * ^ shows a s im ila r r e l a t i o n ship e x i s t s fo r HRA's and concludes th a t assig n in g a maximum lim it to Flow i s e q u iv a le n t to a ssig n in g a minimum lim it to I n te r n a l F r ic tio n .
2 .2 .2 .7 A b ility to Assess R esistance to Deformation
The a b i l i t y of M arshall S t a b i l i t y or Flow values to p re d ic t a m ixture*s re s is ta n c e to deform ation under t r a f f i c , appears to . -j i . . . ' (4 2 )(4 4 )(8 1 )
be lacking m many in s ta n c e s .
( 56 ^
Early work w ith H,R.A. in d ic a te d th a t these values alone were not able to a c c u ra te ly p re d ic t a m ixture*s performance in a l l . c a se s. A "ranking** of m ixtures in terms of S t a b i l i t y and Flow, d iff e r e d somewhat from th a t on the b a sis of t h e i r performance in simul&ive t e s t s . A s im ila r disagreem ent i s re p o rte d e l s e - w h ere.(86)
In the road s i t u a t i o n and in sim u lativ e t e s t s , m ixtures are r e s tra in e d by the surrounding and underlying m a te ria l, although
the magnitude of r e s t r a i n t may d i f f e r , in such in sta n c e s re s is ta n c e to deform ation w i l l be la rg e ly a fu n c tio n of aggregate in te r lo c k and i n te r n a l f r i c t i o n , r a th e r than cohesion as in the M arshall t e s t . This f a c t may in some way account fo r the poor agreement observed.
to Flow, re fe r re d to as M arshall Q uotient (Q), may lead to a b e tt e r c o r r e la tio n w ith perform ance.
/ oo \
This r a t i o was f i r s t proposed by N ijb o e r' ' who equated the S t i f f ness Modulus of a m ix tu re, under c o n d itio n s of the M arshall t e s t to
= 1.58 S (kg/cm^) F
where S = M arshall S t a b i l i t y (kg) F = M arshall Flow (mm)
and S/F = M arshall Q uotient (Q) = (kg/mm).
Attempts were then made to s e t re q u ire d values of Q, i n i t i a l l y Required Q > 30 x Tyre p ressu re
(kg/mm) (kg/cm2)
( 8 9 \
w ith Edwards l a t e r re p o rtin g th a t o th e r work suggested fig u r e s of Q as
1.0 kN/mm fo r Northern Europe
2.0 kN/mm fo r areas w ith h o t te r c lim a te s .
(14)(53) Such requirem ents are now p a rt of s p e c ific a tio n s in c e r t a i n c o u n trie s , see ta b le 3. This i s not the case in the U.K., although i t
( C O \
i s re p o rte d } th a t c e r ta in Highway A u th o ritie s sp e c ify t h e i r own requirem ents regarding Q, ty p ic a l values suggested as s u ita b le fo r heavy t r a f f i c co n d itio n s a re :
S a n d -f ille r-b in d e r mix 1.1 to 1.5 kN /m m ^^ S to n e -f ille d mix 2.0 to 2.5 kN/mm.
fo r d if f e r e n t t r a f f i c i n t e n s i t i e s , see ta b le 7.
Table 7 :
M arshall Q uotient - "im plied v a lu e s” HD/2/79 S a n d -f ille r -b in d e r mixes a t O.B.C.
T r a f fic Category c .v .d .
Specified Minimum
S t a b i l i t y (kN)
Implied Minimum Q uotient*
(kN/mm) le s s than 2000 3.0 0.6
2000 - 4000 4.5 0.9
4000 - 6000 5.5 1.1
more than 6000 6.5 1.3
^maximum Flow value a t O.B.C. = 5 mm hence "im plied" Q = S t a b i l i t y f 5.0, kN/mm.
Although M arshall Q uotient should c o r r e la te b e t t e r w ith r e s is ta n c e to deform ation, r e s u l t s of la b o ra to ry s t u d i e s ^ ^ ^ ^ using sim ulative t e s t methods f a i l to in d ic a te d e f i n i t e l y i f t h i s is the c a s e .
However, r e s u l t s of la b o ra to ry -ro ad c o r r e la tio n s do suggest th a t the re la tio n s h ip between ru t depth under t r a f f i c i s more c lo s e ly r e la te d to Q u o t i e n t ^ t h a n S t a b i l i t y , w ith the odd
excep-(93)
tio n . Lack of such inform ation stems from the time needed to c o l l e c t i t and those r e la tio n s h ip s which have been e s ta b lis h e d show a high degree of s c a t t e r , which can be a t t r i b u t e d to :
( i ) the v a ria b le environm ental and t r a f f i c c o n d itio n s ( i i ) poor r e p e a ta b i li t y / r e p r o d u c i b i li ty of the t e s t
In co n clu sio n , i t appears both S t a b i l i t y and Q uotient are c lo s e ly r e la te d to the performance of H.R.A. m ix tu res. More d ata is req u ired before any g re a t sig n ific a n c e can be placed on r e s u l t s .
2 .2 .2 .8 A p p licatio n s to Q uality C o n tro l:
In common w ith a l l m anufacturing p ro cesses the p roduction of B it-(73)
uminous m ixtures i s s u b je c t to v a r ia tio n . As m ixtures of the h ig h e st q u a lity are re q u ire d t h i s v a r ia tio n must be kept to a minimum, the techniques employed to t h i s end are termed Q u ality C ontrol.
The M arshall t e s t has been used f o r many y ears in the (94)
and elsewhere as the b a sis fo r Q u ality C ontrol of A sp h altic c o n crete . This e n t a i l s t e s t i n g samples of m ixture taken from the mixing p la n t, and p lo ttin g the t e s t r e s u l t s on S t a t i s t i c a l Q uality C ontrol C h arts, the m athem atical b a sis of which i s
(95)
d escribed elsew here. F a ilu re of d ata to f a l l w ith in p re determined lim it s in d ic a te s v a r ia tio n is g re a te r than expected, and the source of t h i s v a ria tio n can be sought and r e c t i f i e d w ith in
(72)
a sh o rt tim e, thus m aintaining a high q u a lity product (m ix tu re ).
In the U.K., H.R.A. m ixtures have in the p a st been t e s t e d , only to check compliance w ith the re c ip e s p e c if ic a tio n . • With an in c re a sin g emphasis on deform ation r e s i s t a n t m ixtures c e r t a i n
2 .2 .3 The In d ir e c t- T e n s ile Test Method
2 .2 .3 .1 O utline of Test Method
This involves applying an in c re a sin g compressive load, d is tr ib u te d along opposite g en erato rs of a c y li n d r ic a l specimen r e s u lt in g in the development of a r e l a t i v e l y uniform t e n s i le s t r e s s a c tin g p erp en d icu lar to the loaded d iam etral p lan e. F a ilu re u s u a lly occurs by " s p l i t t i n g " along t h i s plane due to the t e n s i l e s t r e s s , thereby allow ing c a lc u la tio n of the T ensile S tren g th , knowing the load a t f a ilu r e ( P ) and specimen diameter(D) and le n g th (L ).
2 .2 .3 .2 Theory
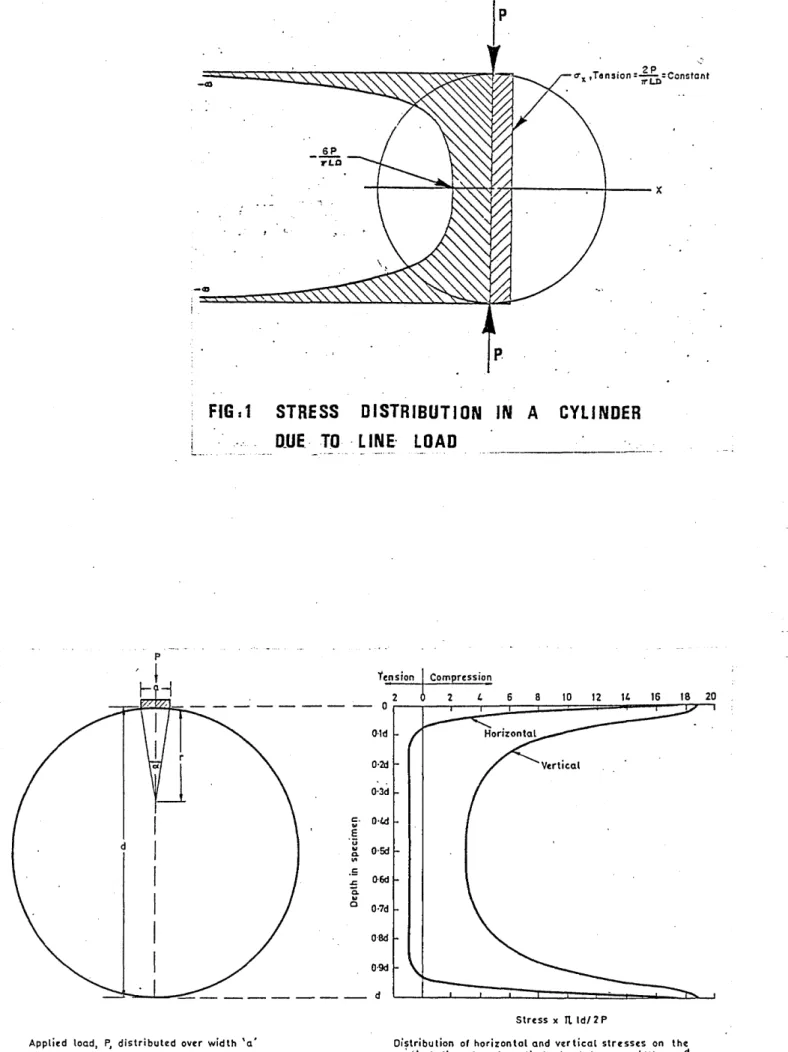
The t h e o r e ti c a l s t r e s s d i s t r i b u t i o n , (see fig u re 1) under such loading c o n d itio n s can be derived from F ro c h t's eq u atio n s fo r
(97)
s tr e s s e s a t a p o in t fo r the case of a t h in d isc su bjected to p o in t loads a t opposite ends of a diam eter. (Corresponding to a c y lin d e r w ith lin e loads along opp o site g e n e r a to rs ). This in d ic a te s th a t on the loaded diam eter:
( i ) V e rtic a l s t r e s s i s com pressive, varying from 6P
ttLD
a t the c en tre to in fin ity .b e n e a th , the load p o in ts .
( i i ) H orizo n tal s t r e s s i s t e n s i l e , w ith a c o n sta n t value of 2P - (1)
TTLD
Under such co n d itio n s the specimen would be expected to f a i l in compression d i r e c t l y beneath the load p o in ts , however, in r e a l i t y co n d itio n s d ev iate co n sid erab ly from those assumed in the e x act s o lu tio n given above: