The prediction of applied force and torque during flat hot
rolling.
GONZALEZ, Jose Antonio.
Available from Sheffield Hallam University Research Archive (SHURA) at:
http://shura.shu.ac.uk/19698/
This document is the author deposited version. You are advised to consult the
publisher's version if you wish to cite from it.
Published version
GONZALEZ, Jose Antonio. (1981). The prediction of applied force and torque during
flat hot rolling. Doctoral, Sheffield Hallam University (United Kingdom)..
Copyright and re-use policy
See
http://shura.shu.ac.uk/information.html
Sheffield Hallam University Research Archive
ruLTi CHMC LIBRARYI N O .3 i KEEL
SHELL IELD SI 1WB b %0'U
7925170
4-Sheffield City Polytechnic Eric M ensforth Library
REFERENCE ONLY
This book must not be taken from the Library
PL/26
ProQuest Number: 10696998
All rights reserved
INFORMATION TO ALL USERS
The qua lity of this reproduction is d e p e n d e n t upon the qua lity of the copy subm itted.
In the unlikely e v e n t that the author did not send a c o m p le te m anuscript and there are missing pages, these will be noted. Also, if m aterial had to be rem oved,
a n o te will in d ica te the deletion.
uest
ProQuest 10696998
Published by ProQuest LLC(2017). C o pyright of the Dissertation is held by the Author.
All rights reserved.
This work is protected against unauthorized copying under Title 17, United States C o d e M icroform Edition © ProQuest LLC.
ProQuest LLC.
789 East Eisenhower Parkway P.O. Box 1346
THE PREDICTION OF APPLIED FORCE AND TORQUE DURING FLAT HOT ROLLING,
by
JOSE ANTONIO GONZALEZ BSc. MIMechE.
This thesis is submitted in part fulfilment of the requirements for the degree of Doctor of Philosophy in Industrial Metallurgy of the Council of National Academic Awards. The work was carried out at Sheffield City Polytechnic, Department of Metallurgy, in
collaboration with Swinden Laboratories, British Steel Corporation.
ABSTRACT
THE PREDICTION OF APPLIED FORCE AND TORQUE DURING FLAT HOT ROLLING.
JOSE ANTONIO GONZALEZ.
A mathematical model has been used to calculate the roll force and torque produced under a wide range of flat hot rolling conditions. The technique used is based on the numerical solution to the Von
Karman equation developed by Alexander and applied to cold rolling conditions. In the present work, extensions have been made that allow the use of a yield .stress which is dependent upon temperature, rate of deformation and extent of inhomogeneity of the deformation process. Like Alexander, the present model considers also the effect of both: the elastic zone at each end of the deformation region and of roll flattening on force and torque. A prerequisite for these calculations has been the experimental determination of the temperature gradients in the plate during rolling, the coefficient of friction between plate and rolls and the flow stress of the material at relevant temperatures and strain rates; the last named data being supplemented by published data on similar material. The results have been compared with
experimentally determined force and torque required to roll mild steel plates at temperatures between 900*C and 1200*C, under uniubricated conditions.
The coefficients of friction associated with percentage
reductions of between 30^ and were within the range 0.2 — 0.^5* The thickness of the scale, the rolling velocity and the temperatures at the plate surface appeared to control the magnitude of the coefficient of friction. The peripheral layers of the plates underwent a severe
quench, caused by rapid heat transfer to the rolls: the associated temperature reduction increased with increasing roll pressures and contact time. The resulting temperature gradient was inpli^pri in tho calculation using a geometric mean of the individual temperature measurements. At rolling temperatures between 900 °C and 1000°G and reductions up to 35^» the degree of agreement between the experimental and calculated roll forces and torques were ±1 Jfo and ±1% respectively, although the use of Suzuki's flow stress data reduced these discrepancies to about4 6% and4 11% respectively in most cases. However the use of higher reductions or higher, temperatures led to poorer agreement between calculation and experiment^ 2% and 4 35- in the case of roll
force and torque respectively), __
The research described was caxried out during the period of March %
1977 to April 1980 in the Department of Metallurgy at Sheffield City Polytechnic and financed by La fundacion Gran Mariscal de Ayacucho (Venezuela). No part of this thesis has been submitted for a degree at any other University or College.
During the period of this work the author attended the following lectures, which constituted part of the M.Sc. in Metallurgical Process Management at Sheffield City Polytechnic:
Module I: . Process Metallurgy Mechanical Metallurgy Advanced Thermodynamics
Module II: Numerical Methods and Programming
Economic Analysis and Financial Control
Module III: High Strength Alloys
Heat Treatment and Transformations
Automatic and Computer Aided Control of Metallurgical
Processes-#
Oxygen Steelmaking Quality Control
Continuous Casting ... —
Module IV: Case studies in the subject areas of:-High Strength Alloys
Oxygen Steelmaking
Hot Rolling Schedule (Appendix I of this thesis)
Acknowledgements.
The author would 15Jce to thank his supervisor Dr, A.J.Fletcher for his guidance at all stages of the writing of this thesis, and Messrs. V.G.Gibson and M.Gleave for their contribution to this research.
He would also like to thank the technical staff of both the
Metallurgy Department and the Department of Mechanical and Production Engineering at Sheffield Polytechnic for their help and cooperationj also the staff of computer services. Particular thanks to Messrs. R.Day and D.Wilkinson for their assistance during the experimental,
stage of this work.
Finally, I am heavily indebted to my wife, Jane, for her untiring effort throughout the typing and revision of this thesis, and for her continuous moral support.
• . • por la continua busaueda . . .
CONTENTS
Abstract • > *
Preface ii
Figures and Tables vii
Notation xiii
CHAPTER 1 Introduction. 1
CHAPTER 2 The Theory of Rolling. 2
2.1 Introduction. 2
2.2 The differential equation governing vari- 3 ation in roll pressure during a pass.
2.3 Early Theories of Rolling. 5
2.4 Orowan's Theory of Rolling. 15
2.5 Approximate Theories. 21
2.6 Alternative Theories. 26
2.7 Alexander's solution to the Von Karman JO
Equation.
2.8 Roll flattening. J1
2.9 The yield Stress applicable in hot foiling. 34 2.10 Coefficient of friction between slab and 39
foils during hot rolling.
2.11 Roll force and torque. 46
2.12 Validity of the theories of hot rolling. ' 49 CHAPTER 3 Numerical. Solution to the Basic Von Karman
Equation.
3.1 Introduction. 53
O O -O jjcvuxvt u x x x o x via L 1.1 VO.UX X J uiiu.v^x 3__ , axw&u w* CO geneous deformation
3«3 Basic differential equation under inhomo- 56
#
geneous deformation.
3.4 Yield Stress variation during Hot foiling. 57
3.5 Roll force per unit width. 58
3.6 Roll torque per unit width. ■-— ' 59
3.7 Elastic arcs of contact. 60
3.8 Roll flattening. 62
3*9 Calculation technique. 63
3.10 Data used in roll pressure calculations. 65
3.11 Computer Programmes. 66
iv
CHAPTER
CHAPTER 5
Experimental Procedure.
4.1 The Rolling Mill. •' 69
4.1.1 Mill power supply. 69
4.2 Mill instrumentation. 70
4.2.1 Tachogenerator. 70
4.2.2 Light-activated switch. 71
4.2.3 Temperature measurements. 72
4.2.4 Load cells. 73
4.3 Determination of the rolling power and roll torque.
74
4.3.1 Frictional power. 75
4.3.2 Idling power. 76
4.3.3 Dynamic power. 77
4.3.4 Rolling power and roll torque. 77
4.3.5 Experimental determination of the frictional power under load.
78
4.4 Recording Instruments. 79
4.5 Reheating furnaces. 82
4.6 Cam plastometer. 83
4.6.1 Cam design. 84
4.6.2 Instrumentation of the cam plastometer. 85
4.7 Rolling Programme. 87
4.7.1 The condition, composition and dimension of the plates.
89
4.7.2 Reheating and rolling. 90
4# 8 A A
4.9 Hot compression tests. Experimental Results.
92
5.1 Introduction. 94
5.2 Roll force measurements. 94
5.3 Roll torque measurements. 96
5.4 Determination of the coefficient of friction during rolling.
97
5.5 Temperature measurements during rolling. 98 5.6 Yield stress data of the material undergoing
rolling.
101
CHAPTER 6
6.1
6.2
6.3 6./f 6.56.6
CHAPTER 7 7.1 7.2 7.3 7.^ 7.5 7.6 7.7 # 7.8 Bibliography. Appendix I Appendix II Appendix III Calculated Results.The magnitude of the mechanical properties 103 and rolling conditions used in the
calculation of roll force and torque.
Effect of the coefficient of friction on 10^ .roll force •
Effect of the mean temperature of rolling 108 on roll force.
Effect of the coefficient of friction on .109 roll torque.
Effect of the mean temperature of rolling on 117 roll torque.
Effect on roll force and torque of the trans- 119 versal distribution of roll
pressure.-Discussion..
Distribution of temperatures in the „ . 121 deforming material.
The effect of the coefficient of friction on 126 the calculated roll force and torque.
Values of the coefficient of friction 129 obtained by experiment.
Inhomogeneity of the deformation process. 13-Comparison between calculated and measured 135 values of roll force.
Comparison between calculated and measured 137 values of roll torque.
Limitations in the accuracy of the measured . 139 and calculated forces and torques.
Conclusions. 1^3
145
Case Study 152
Computer Print-out 159
Temperature Calculations 165
Figures and Tables*
'2.2.1 Roll gap geometry. 167
2.3*1 Comparison of Siebel's and Von Karman*s roll stress 168 distributions.
2.3*2 Variation of the radial pressure and shear stresses 168 ( 5)
along the arc of contact - after Tselikovv .
2.3*3* Distribution of normal and tangential pressures Etlong 169 the Arc of contact according to the theories shown
-(9) after El Wasiri^ .
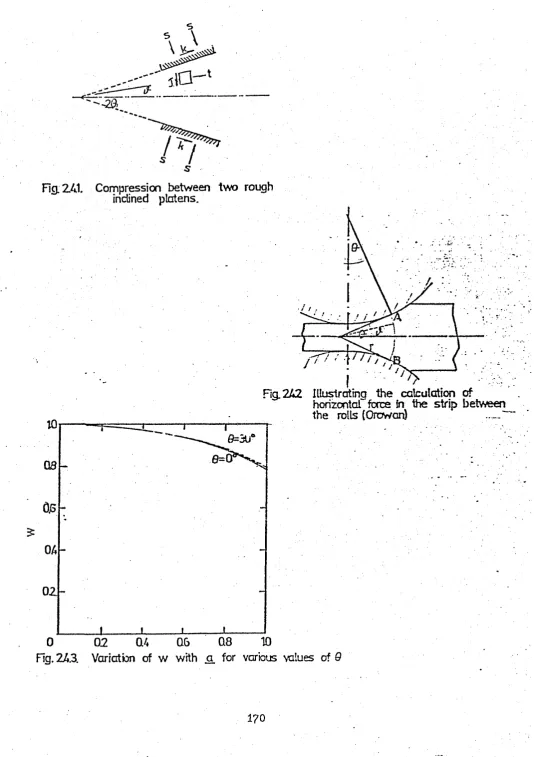
2.4.1 Compression between two rough inclined platens. 170 2.4.2 Illustrating the calculation of horizontal force in 170
the strip between the rolls (Orowan).
2.4.3 Variation of w with a for various values of - after 170 (4)
Orowan .
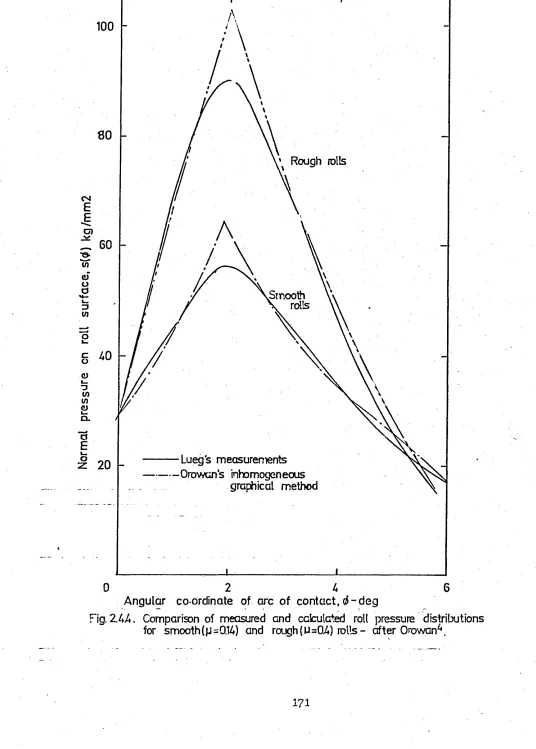
2.4.4 Comparison of measured and calculated roll pressure 171 distribution for smooth (jj=0.14) and rough !jj =0.4)
rolls.
2.5*1 Exit side of a typical friction hill, showing the 172 difference between the Denton and Crane method and
(17) that of El Xalay and Sparling - after Denton et al.
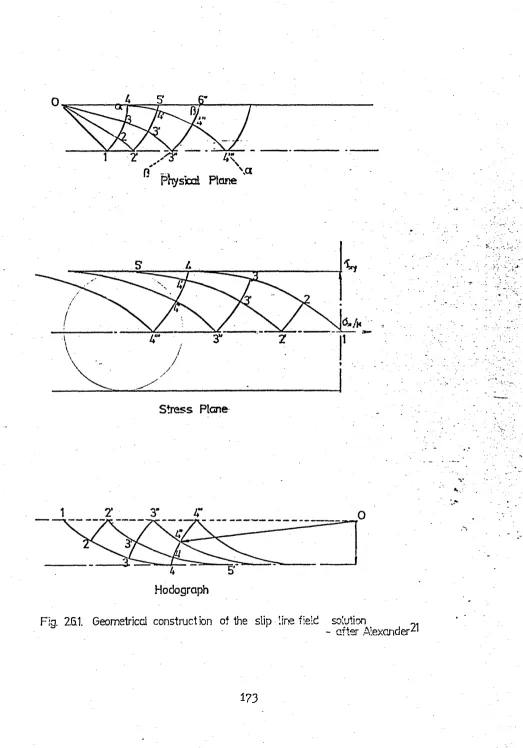
2.6.1 Geometrical construction of the slip line field 173
(
21)
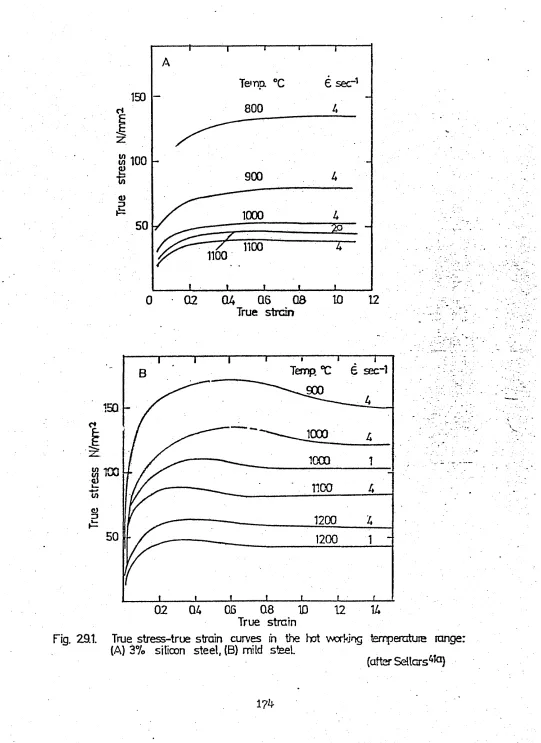
solution - after Alexander2.9*1 Tine stress/true strain curves in the hot working 174 temperature range: (a) silicon steel*(b) mild
(4la )
steel - after Sellars et al. “ ,
2.10.1 Variation of the coefficient of friction in unlubricated 175
( c>o)
hot roiling conditions - after Roberts'" '.
2.10.2 Distribution of snear stresses ana coefficients of 173 friction along the arc of contact - after Matsuura et
(50
al.0 *'.3.2.1 Longitudinal section of a strip "oetween two rolls. 1?6 3*4.1 Variation of the mean strain rate of a section along 177
the arc of contact for a typical rolling pass.
3*10.1 Variation of Young’s modulus with temperature for two 178
(67)
steel compositions - after BISRA Research Report ,
Table A Flow stress constants of 0.17^ C steel at different i?6a temperatures,
3*11*1 Flow chart for the numerical solution to the Von Karman 179 equation to predict roll force and. torque per unit width,
[image:12.612.45.556.25.734.2]4.1.1 (Plate) The rolling mill and ancillary instruments 180 4.2.2 Light-activated switch and its location on the exit 181
table of the rolling mill.
4.2.3 Location of thermocouples inside a plate,(a)two . . 182 thermocouples,(b) four thermocouples.
4.2.4 Calibration curves of the load cells. 183
4*3.5 Experimental values of the roll neck friction 184 coefficient/drive efficiency ratio at various loads.
4.6 Cam plastometer and enlarged section of the die 185 assembly.
4
4.6.1 Cam profiles. 186
4.6.2 Calibration curves of the instrumentation of the 187 cam plastometer.
4.8.1 Relation between the coefficient of friction and the forward slip at various reductions and entry thick
nesses, (a) h = 9*5 raw* (b) h = 12.? ram. 188
(c) h = 16 mm (d) h = 19 mm. 189
5.2 Typical recording of the load cells. 190
5.2.1 Relation between mean roll force and reduction ; 191 measured at 900°C.
5.2.2 " " 1000cC. 192
5.2.3 " " 1100°C. .193
5.2.4 " " 1200°C. 194
5-3*l Simultaneous recordings of voltage, current and 195 angular velocity of the rolls during a test at
900
*CJ I. _J .4 4 f 4 — - 1 1 -- -
---euxu. "~r\j/o x c u u o oxuiif a o o v O x a o c u x uij. y u n c x
uu.uouiUjL'-tion. .
5.3.2 1 Relation between mean roll torque and reduction 196 measured at 900°C.
5.3*3 " " 1000°C. 197
5.3 .4 " " 1100°C. 198
5.3.5 " ” 1200 °C. . 199
Table 1 Rolling parameters determined in experimental work. 200
5.4.1 Forward slip variation with the percentage reduction 201
measured at 900°C.
5.4.2 " 1000°C. 202
5.^.3 " " 1100°c. 203
S.k.k ” " • 1200°C. 2<*
5.4.5 Forward slip variation with percentage reduction 205 under lubricated conditions at 960°C*
5.4.6 " dry " " 206
5.5*1 Temperature variations at the centre and sub-surface 207 of a plate before and during rolling for various red uctions, l£^'--4j$»and mean entry.temperatures,900-li00°C.
5.5.2 " 3¥0 " " " 800-950°C. 208
5.5.3 " W " " " 850°C. 209
5.5.4 Typical recording from an insulated thermocouple 210 Inserted in a plate being deformed.
5*5*5 Correction to allow voltage interference in a re- 210 welded thermocouple•
5.5*6 Temperature variation at several depths of a plate 211 during contact time using insulated thermocouples,
(a)at mean entry temperature 870°C and 30^ reduction, (b)" " " "• 820-900°C and 10-4C£ red.
5.5*7 Temperature variation at several depths of a plate during contact time using rewelded thermocouples,
(a)mean entry temperature 900-1050°C and 1% reduction.212 (b) " " " 1000°C and 3Q^ reduction. 213 (c) " " " 1050°C and 30^ reduction. 213 (d) " " ,f 1050°C and 4C£ reduction, 214 5.6.1 Typical traces of the load/time and displacement/ 215
time recorded in a cam plastometer,
5.6.2 Uniaxial yield stress/strain curves of 0 , 1 ^ C steel 216 at 900~C.
5.6.3 '■ " 1000°C. 217
5.6.4 § " 950 - 970°C. 218
5.6.5 " 980 - 1050°C. 219
6.2.1 Relation between calculated roll force and reduction 220 under homogeneous deformation and using published
flow stress data (jj=0• 2 - 0,6) at 90Q°C.
6.2.2 " " " " " " 1000° C, 221 6.2.3 " " " ” " " 1100 °C. 222 6.2.4 " " " " " " 1200°C. 223
6.2.5
6
.
2.6
6.2.76
.
2.8
6.2.96
.
2.10
6
.
2.11
6
.
2.12
6.3.1
6
.
3.2
6.3.3 6.3.4 6.4.1 6.4.2 6.4.3 6.4.4 6.4.5 9 6.4.6 6.4.7 6.4.8 6.4.9 6.4.10
Relation between calculated roll force and reduction 224 under homogeneous deformation and using flow 'stress
data determined in the present work (p=0.
2-0.6)at,900°C.-.. .. .. «. .. .. .. .. 1000°C. 225
Relation between calculated roll force and reduction 226 under inhomogeneous deformation and using published
flow stress data(p=0.2 - 0.6) at 900°C.
" " " . " " " 1000°G.
227
" " " " 1100°G. 228
.. .. .. t. .. .. 1200°C. 229
Relation between calculated roll force and reduction under inhomogeneous deformation and using flow stress
data determined in the present work(p=0.2-0.6) at 900°C 230
.» u it ii n ii ii ••
•
iooo°c
231Relation between calculated roll force and reduction 232 showing the effect of a..+-3fc variation in the nominal
temperature of rolling and using published flow stress data({J=0.4) - nominal temperature 900°C.
1000°C.
233
1100°C. 234
1200°
C.235
Relation between calculated roll torque and reduction 236
under homogeneous deformation using published flow stress data (p=0.2-0.6) at 900°C.
1. H .. .. .1
100o°c.
237
„ nocrc. 238
.1 ,i ii n i* 12OO °G. 239
Variation of the relative position of the neutral angle 240 with the percentage reduction(p=0.2-0.6) at 900°C.
•1 11 ii •• 11 & ii n 1000 ®G. 241
Variation of the lever arm with percentage reduction 242 at 900°C.
" 1000°C. 243
Variation of the relative position of the neutral angle 244 with the percentage reduction^ =0.2-0.6) at 1100°G. .
Roll pressure and yield stress distributions along the 245 arc of contact under homogeneous deformation and using
6.4.11 Variation of the lever arm with percentage reduction 246 at liOOaC.
6.4.12 " 1200°C. 247
6.4.13 Relation between calculated roll torque and reduction 248 under homogeneous deformation using flow stress data
determined in the present work(JJ =0.2-0.6) at 900°C. •
6.4.14 " " " " " " " M 1000°C. 249 6.4.15 Calculated roll pressure distributions under homo- 250
geneous deformation using both published flow stress data and that determined in the present work,(900°C,
p=0.2, r=33/0 *
6.4.16 Relation between roll torque and reduction under in- 251 homogeneous deformation using published flow stress
data (jj =0.2-0.6) at 900cC,
6.4.1? " " " " 1000°C. 252
6.4.18 " " " " 1100°C. 253
6.4.19 " " " " 1200 °C. 254
6.4.20 Roll pressure distribution assuming both homogeneous 255 and inhomogeneous deformation and using published flew
stress data (900cC,p=0.6, r=18^).
6.4.21 Relation between roll torque and reduction under in- 256
homogeneous deformation using flow stress data deter mined in the present work (p=0.2-0.6) at 900°C.
6.4.22 " " ” " " " " " 1000°C. 257 6.5*1 Relation between calculated roll torque and reduction 258
showing the effect of a ± % variation in the nominal temperature of rolling and using published flow stress data (jj=0.4) - nominal temperature 900°C.
6. 5.2 • " ” " " 1000°C. 259
6. 5.3 "• " " “ 1100°C. 260
6. 5.^ " " “ " 1200°C. 261
6.6.1 Distribution of stresses across roil gao nid-way between 262
(6g1 exit and entry planes - after Sansome
6.6.2 Transversal distribution of peak roil pressures for 262 various cross sectional shapes of the material between
( 68) the rolls - after Polukhine^ ^ .
6.6.3 Roll force distribution across strip width - after 262 (51)
Matsuura et- al. .
Table 2 7.1 Table 3 7.4.1 7.4.2 7.5.1 7.5.2 7.5.3 7.5.4 7.5.5 7.5.6 7.6.1
7
.
6.2
7.6.3 7.6.4 7.6.5
7
.
6.6
7.7
Correcting factors to allow for transversal drop of 265
roll pressure distribution.
Measured and calculated temperature profiles at several 266 instants during the time of contact.
Values of coefficient of friction determined from 267
several empirical relationships.
Reconstructed disposition of the hot junction of- 268 thermocouples in rolled plates.
Relation between theoretical and experimental values 269
of the neutral angle and percentage reduction (Series A) Comparison between calculated and measured values of 270 roll force for the rolling conditions in Series A at
880 - 940°C.
Comparison between calculated and measured values of 27i roll force for the rolling conditions in Series A at
950°C.
Comparison between calculated and measured values of 272 roll force for the rolling conditions in Series A at
1080CC.
Comparison between calculated and measured values of 273 roll force for the rolling conditions in Series A at
Jt Jt t s Or*
1JOU o.
Comparison between measured and calculated roil forces 274 in Series A using published flow stress data.
Comparison between measured and calculated roll forces 275 in Sex-ies A using flow stress data determined, m the
present work.
Comparison between calculated and measured values of roll torque for the rolling conditions in Series A at
(a) 880 -.940 °C. 276
(b) 950*c;-. 277
(c) 1080°C. ^ 278
(d) 1150^, 279
Comparison between measured and calculated roll torque 280 in Series A using published flow stress data.
Comparison between measured and calculated roll torque 280 in Series A using flow stress data determined in the
present work.
Distribution of roll pressure and shear stress/roll 281 pressure ratio along the arc of contact(ll00*C,r=4($).
Notation.
R Roll radius.
Vr Peripheral velocity of the rolls. V Velocity of the material,
h Thickness of the material. L Length of the arc of contact, r Reductioni Ah/h1•
d Angular co-ordinate measured from the plane of exit, p Coefficient of friction between rolls and material, s Roll pressure,
f Horizontal force per unit width, q Vertical pressure.
p Horizontal pressure in the rolling direction. T Frictional stress between rolls and material. Y Uniaxial yield stress of the material.
2K Shear yield stress in plane strain of the material. €,C Uniaxial strain and strain rate respectively,
T Temperature E Young's modulus, v* Poisson's ratio.
R' Radius of curvature of the deformed roll, P* Specific roll force.
G’ Specific roll torque.
Index + Refers to conditions towards the plane of exit. - Refers to conditions towards the plane of entry.
Subscript i,2,n Values at the entry, exit and neutral plane respectively,
Units, Length mm Force kN
Angle radians Torque kN-m
1# Introduction.
The rolling mill section of a plant represents, normally, the largest single item of investment, which demands that a mill
should be operated as efficiently as possible. The objective of rolling theories, then, is to enable the roll separating force and the torque to be predicted so that optimum scheduling, operation and control of a mill can be attained in order to produce the maximum tonnage at the lowest cost.
A large number of rolling theories have been proposed to estimate roll force and torque for a wide variety of rolling conditions, and simplified methods, representing a compromise between accuracy and speed of calculation, have been adopted in the rolling industry. Predictions in cold rolling theory have reached acceptable levels of accuracy, whereas hot rolling theories often produce discrepancies, owing to crude assumptions made in their derivation.
The lack of understanding of many aspects of the hot rolling process arises from the difficulties associated with the experimental work. As a result, fundamental research, concerned with the mechanics of deformation of the metal at high temperatures in the roll gap, beCOWAJ^ p-3«3prt+.1 <30 a c +r> aohIeiV’*> a - f o o s + oc ^-P 2?oli force
and torque for rolling mill design and scheduling purposes. This has become- feasible with the widespread availability of digital computers and the amount of data accumulated over recent years on the resistance to deformation of metals at high temperatures.
In the present work, a mathematical model, translated into computer programmes, has been constructed, which provides quick and satisfactory predictions of experimentally determined roll force and torque, and
enables factors affecting rolling loads in flat hot rolling to be studied.
2. The Theory of Rolling.
2.1 Introduction.
The theory of rolling is concerned with the relationships between the external forces applied and the mechanical properties of the material undergoing deformation. Such relationships are established through an analysis of the distribution of stresses inside the material between the rolls. Since considerable difficulties are encountered in the direct determination of the frictional forces between the material and roll surfaces and of the changes of the material properties during deformation, simplified assumptions are introduced into any theory of rolling.
Rolling theories were initiated with the work of Von Karman^^and
(
2
)
Siebel 'who, in order to simplify the actual problem,analysed only the case of flat rolling without spread, rather than that of the more
complicated section rolling where there is considerable spread. They considered the forces acting on a vertical slice of the material being rolled in order to derive a differential equation from which the
variation of roll pressures applied to the deforming material could be determined. Integration of this pressure distribution over the contact length between the material and the rolls allowed the roll force and torque to be determined.
In order to obtain satisfactory solutions to the determination of the roll pressures, roll force and torque under a wide range of rolling conditions, a number of theories,which basically follow the assumptions introduced by Von Karman, have been proposed.
2.2 The differential equation governing the variation in the roll pressure during the rolling pass.
Most of the early theories of rolling' 'relied on assumptions that were "basically the same as those introduced by Von Karman^viz:
(i) Plane sections in the material perpendicular to the direction of rolling remain plane during rolling, i.e. homogeneous deformation is present.
(ii) There is no lateral spread of the material if the thickness of the sheet is small compared with its width.
(iii) The Von Misses criterion of yielding in plane strain applies. When the principal stresses in the plane sections are C| and
jj) , this condition reduces to: Cj-p-Ut>Y
(iv) The plane strain yield stress '2)(=\.\bY constant throughout the contact length.
(v) The coefficient of friction, |J , between the material and the roll, is constant over the arc of contact.
(vi) There is no elastic deformation of the rolls in the arc of contact. Cvii) The elastic-deformations of the material • ere npcrl i opK» p }n
comparison with the plastic deformations,
(viii) The peripheral velocity of the rolls is uniform.
Fig.221 represents a longitudinal section of a strip in transit through the roll gap. Von Karman considered a slice of the material bounded by two parallel planes, AA and 5)3 »which were assumed to remain plane as the material passed through the roll gap.
During rolling the strip is reduced in thickness from to 'n£
and since it does not spread laterally, this vertical compression produces elongation in the rolling direction* Thus, the following relationship applies,
h,Vi=W = h2v/2
where VI and v/z are the mean velocities of the strip entering and leaving the roll gap and V is the velocity at any intermediate
thickness h •
The roll surface velocity must have some value between V1 and V
2
• The point where the roll and strip move at the same velocity is defined as the neutral point. On the entry side the roll moves more rapidly than the strip, while the reverse is the case on the exit side. Thus the frictional forces at the surfaces always act toward theneutral point. This condition produces a roll pressure distribution which includes a maximum pressure at the neutral point. This characteristic shape of the roll pressure distribution is refe'rred to as the friction hill (see Fig
.
2
.
3
.! ).
If the equilibrium of the horizontal forces in the absence of
acceleration, i.e. at a constant roll velocity, is considered, we arrive
rrC 0 ( 0 O ( \• $
where the upper sign refers to the exit side of the neutral point and the lower sign to the entry side.
The roll pressure $ is related to the vertical stress C| by a balance between the vertical forces,
with the application of Von Misses* yield criterion,
C|-|p
thus,
substituting in Eq. 2.2.1 we get
A . lK(s + - X b6 =2^(ssin8±1ick9) (,2.2.10)
69
where the thickness n is given by the geometry of the circular arc of contact ass
h = M ^ U - c o s t f )
2.3 Early theories of rolling.
' In practice the yield stress of the material in hot rolling is a function of temperature, rate and amount of plastic strain and degree of homogeneity of the deformation, which greatly increases the difficulties associated with the solution of Von Karman's equation. In addition, the
(h)
actual arc of contact is elliptical rather than circular 'and the plane sections (
kk
andSB in Fig.2.2.L) are subject to a change in shape as they move towards the exit plane K K • Many workers have attempted to overcome these difficulties by the use of approximate solutions to the Von Karman equation (Eq,2.2Td).Von Karman himself^replaced the radial pressure o on the section by the vertical pressure Cj , Furthermore, he assumed that
)( was small compared with ^ so that Rd0c:d'/ • In addition = was considered with CC&^ i , and hy ■+
4Jv _
.
••dv = *
Hence Eq.(2.2-0 was replaced bys
H
d/ P V - s ^ )
.
{2-5 -9)which, together with the application of the Von Misses yield criterion gave,
Eq. 2.3*2a can be written in terms of the radial pressure in the form
■CY
where
and
H*)=
6 6 0 = U (*' hy VKj.
The formal solution of the linear Eq,2.3.2b is given by,
,-(yp-l MvW [ \|yp I
-V c]
(2.3.3)
i
‘where the sign of the function is taken as positive on the exit and negative on the entry side, and the constant C is determined by the boundary conditions of the exit and entry sides respectively.
s’)
Eq. can be solved only by expanding the integrand inside the brackets in a series. Thus, the final result obtained is cumbersome and not completely accurate.
(
2
)
Siebel' 'assumed tha.t the radial pressure was equal to the yield stress2l\ and that the thickness of the material remained constant on
d'O a
the entry and exit sides of the arc of contact. This implied that except at the neutral point. Further aoDroximations were fl ^ !) * so 6 9 , ^ and CC’S— [ which resulted in a simplified expression:
in cSjp/Jy. = ^
Uj
(2. S. 2 o)
which gave the following solutions:
4C2 C», Ca arc consWs
r h ^ 1
calculations, as it neglects the cumulative effect of the horizontal pressure on the friction hill equation and hence the maximum pressure
(
8
)
obtained is too low.' 'T.L.Smith achieved a simplification of the basic Von Karman equatior(^^assuming that the arc of contact was parabolic. Thus,
] so c h / ^ - ‘Zkhx/jj?
and an expression for the roll pressure distribution was obtained,
(ha Lhy2\ds & +lis. - , \
2L2 Jc!y t? h V2- Z A )
which, after rearrangement, gave:
<j(^) l4-AViXz/h2L2
Thus, from the above equation a distribution of against the relative position could be obtained by selecting values of ^ and hi ,
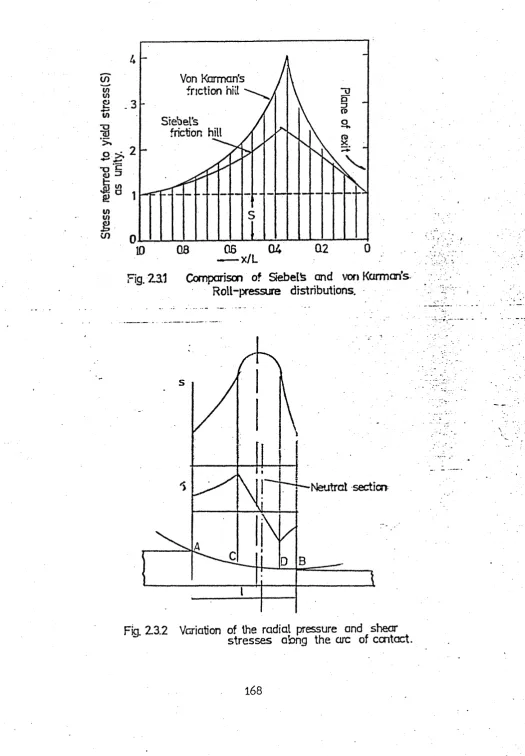
C 8a) The solutions of Siebel arid Von Karman were compared by Trinks' ° , assuming the same rolling conditions, and presented on a graph, shown in Fig. 2.5.1 2 where it can be noted that Von Karman:s solution produces a much higher maximum pressure, whose position coincides with the
X —
neutral point given by the corresponding equation, i.e. when either
vsx
as:
Tselikov^"^introduced O-^'n/^2 and b='n2/^ to write Eq.
{1£0)( lus)
Ch^A-b
and introduced a new variable {} i ;
Hs
Y"
then
u-H ?
jo.2 jk
.
b ' 'Jb U Q y ‘/b
The value of U was substituted into Eq. 2.3.Lo to arrive at
-a solution of the form;
1= m ^ U(^U + C 1 ^
where
m
(jab
Thus the solution given by Eq.(2.3.5a) was similar to the general solution to the approximate Von Karman’s equation, given by Eq.(2.5,0 ).
It was then considered that when Ah and (JKl the integrand could be expanded in a series, so that Eq. 2.3.DO assumed the form,
s~=Co
)
for the entry zone ana
for the exit zone.
_ xiie consran-Ds \.u ana v,i were aerermmea rrom tne oounaaryn . r. , . ,
conditions at the entry plane I t , where Z=L » S - 2/- &b,
and t\c ~ r^ * an(* exit plane )IY\ , where ,
<Ss> and Q ~ 0 •
Thus the final solution of Eq.! 2.3.6O was expressed for the entry and exit zone respectively ass
c- q j ] \ £ + 2 (\ - 'nr)tt»)l &.CD m la.-u) - 2 (I-man
1L y m2 ^ 1
and
,=
\~Subsequently Tselifcov suggested an alternative method to calculate the rolling pressure assuming small angles of contact. He used a
similar approach to that of Von Karman to obtain an equation of the
for,n, (2 .a/.b)
Eg,.
2.2.2.
was also included, i.e.d|p=(l + ^ M s
These values for p and dp with c'o^ were substituted in Eq. 23. k b which divided through by 1 + resulted in,
'{U^L.
. ldh+Kds-0
(2.3,4c)
It was assumed that for small angles of contact^ 0 may heconsidered constant and equal to half the contact angle. Then Eq.2«3,/fc was written as
where
(■a.S.Aci'l
w l
±
m-arid q. ?{(
30 =
were constant. After integration Eq.2 .3, became,
J _ \ o ] M s - $ o l = ^ ! -v Co '
{2.3.b)
1-vE, 1 < ■ h
The constant
Co
is found from the boundary conditions. Thus, when In-U and Eq.(2,5.5) becomesfor the entry side, with
£, = M 4 *-
,and
5
o=
2
^/\+yi\p
0
While for the exit side, when K-h? and $-Sz Eq,(2.3.b ) becomes
Uh_yL with
and
(
5
)Later Tselikov, 'in contrast with previous solutions, recognized the fact that the material did not necessarily slip at all points of
stc of f'nn+.on+. and T'0<3‘tiil?.ted th?.t ?. zone occurred in the vicinity of the neutral point where there was zero relative motion between roll and strip. This zone, where sticking friction conditions occurred,
separated zones at each end of the arc of contact, where relative motion between roll and slab was possible (Fig.2.3/2),Tselikov obtained an
expression for the pressure distribution in the latter zones using the method already outlined; in the case of the sticking zone, a
solution was reached by first determining the magnitude of the frictional forces, which appear on the contact surfaces. This was done assuming
that the frictional forces varied according to a law which is approximately linear, then
T
(23.6)
An approximate expression was then proposed to calculate the
length of the sticking zone , which in hot rolling was lg — 2.0^ Vim ?
thus denoting =0/ and • Eq.2.3.kG was rewritten as,
ds = ^ 2 'hzhf
"” u p .
In (2.3.Ac)V> The plus sign in front of the second term inside the brackets vanished, since Eq. 2.3.£ gave the friction stress for the whole
sticking zone.
The integrated expression of Eq.2,0.ic was given by:
3=Sc^MVu-K')42-VkW,)\nWhl
(2.3.]')
where
and Sc was the radial pressure at the point C determined from Eq. '2.330 and he is the associated thickness of the cross section.
It was proposed that ho in E q . 2 c o u l d be found by equating the values of the radial pressure given by Eq.233b and Eq. 2.3.^ at the point 0 , so:
i h lW -V lv )
Ifln =r
W h o ^
(3)
Nadai 7obtained a differential equation of the form,
d/_)(HjD)±2t+2s'//^=0
(2.3.6)
which again described the stress distribution within the arc of contact. Here the case of applied tension was considered and the yield criterion became S4-j3=i2lK. • In addition, dimensionless groups were introduced:
„ y n
^or small angles of contact the thickness of the material within the roll gap was given by:
Eq. 2.S.& was rewritten as:
=2z ■■ f e s '& a '
Nadai also investigated the effect of three conditions of friction on the distribution of pressure along the arc of contact. These were:-d ) A constant coefficient of friction.
In this case the frictional stress was given by and for a constant coefficient of friction
2^ 2 « C = W f ^ 1 So Eq. 2 3.0a can be written as
(UZ2)(i|/dz')TK»i|=2z.
(2.3.&b)
Eq.2.3.8>b
was integrated by introducing the variable $ such that • 2-to (S’ » whence and,from which . W p (2.5.?)
It was considered that in most cases the integral in Eq. 2.3-9. i- Q
could by computed by replacing ^lT by a series, thus, s/2<= C ^ 0 - - 2{\ ±
using Eq .2,35)0 Nadai calculated the pressure distribution for a number of cases of rolling. These showed that the application of front
or back tension only, or of both together, reduces the roll pressure and shifts the position of the neutral plane.
(id
A constant shear stress at the surface. 'In this case the shear stress was assumed constant, and after introducing the dimensionless number Eq. Z3,0O became:
'/jZfcx du/j = i ^ 3 -
4
^-[l0l l+zf Hi2 which upon integration gave:
3/2^=.
±<z\i>'l+\nLWZ2)
+ C
(2.5.9b)
(iii) A variable shear stress at the surface.
In this case the surface friction was assumed*to he propor tional to the relative velocity of slip. Nadai pointed out that the above assumption was rather doubtful due to the fact that little was known about the conditions of friction when lubricated strips were rolled.
The suggested relationship between the frictional shear stressCjf) and the relative velocity between rolls and strip (V-V^was,
o
where n = mean value of the lubricant viscosity at the rolling pressure,
r
£) - mean thickness of the oil layer.
Considering that the thickness of the strip was given by, ln= then V^^oi/h =
and
80
• s’ w
J _ L \
i
.
O \1 'S, "SO /
where was the value of Z corresponding to the neutral point. After introducing t o a n d = 2tJ/, , ,Eq.2.3»8a took the form,
' O ' ' p * < x
Hence after integration, ^ \ '
f V
UVl1'^4
l l r M W M l2Mc)
Fig.2.3.3 shows the distribution of roll pressure and shear stress along the arc of contact calculated using the theories of Tselikov, Von
(9 )
Karman, Siebel and Nadai, as presented by El Waziri . These curves were applicable to the rolling of wide strip without applied tensions, with a 50^ reduction and a coefficient of friction |ji=0.<2 •
It should be noted that in the solutions of Nadai and Tselikov the sharp maximum pressure has been replaced by rounded*peaks as these curves were obtained from Eqs.2.3.^C and 2,3/J respectively, which do not involve the intersection of two separate relationships between roll pressure and position along the arc of contact. Additionally, in both cases the neutral point does not coincide with the position of the maximum pressure.
Ekelund^assumed that slipping conditions occurred at the entry side of the arc of contact, while shearing or sticking conditions were present from the neutral point to the exit plane. A balance of
horizontal forces was used to obtain an expression of the form:
'/2MM^=2c|^9(ncc6:0-O(&09i.'i0)
(2.3.10)
The yield criteria was expressed as , where
represented the mean strength of the material. Introducing M Ccr/5--&VJ
and , Eq.2/3.10 was integrated to give,
from which
p
which was approximated to,
... / i , / r\ . <2 r\ A
“ 4 C1= p c o s ^ r S ^ ^ '/C h iV h i)
The Ekelund method was semi-empirical because it contained a large number of approximations, often very arbitrary, which were selected to obtain agreement with the results of certain experiments
(9)
on the hot rolling of steel. '
= k K e M Ci A c z t f M
3 1
Most of the theories reviewed above aimed at methods of calculation that were simple enough to be of practical use in rolling mill practice. To achieve this, drastic simplifications were necessary, which led
in some cases, to serious disagreement with experimental results.
Usually it was not clear which of the several assumptions and approxim ations was responsible. On the other hand agreement between theoretical and experimental results may be attributed to the fortuitous
cancella-(4) tion of several errors. 7
2.4. Orowan's Theory of Rolling.
Orowan aimed to discard as many simplifications as possible, and derived a more accurate solution from which simplified theories, valid for restricted rolling conditions, could be evolved. The Orowan
solution was also suitable as a standard against which existing theories (4)
could be assessed. 7
The first part of Orowan's. work was concerned with developing a method to calculate the roll pressure using the assumptions of homo geneous deformation and slipping conditions. Eq.2.2.1 was rewritten as:
Wi+.b n prtfl ’o- I/L vi oT d r'T'T+eria >ie>r>o mo 1/i XO \/
- j -p --- w j'n *•'
and the final expression of 2,4.1 was:
where
and
where ji was the initial value of 1(0] at either the entry or exit plane and the lower limit of the integrals was
0
- Q\ and 0-6' respectivelyOrowan considered that the integral could he solved if the roll flattening was ignored, hut the formulae were too complicated for practical use. The second integral containedM$\*hich was given hy
experimentally determined curves. Thus, it was proposed to obtain a graphical solution•
Orowan compared two of the measurements of roll pressure hy Siehel
( 7 )
and Luegv with the results given hy the homogeneous graphical method. The measured roll pressures taken at or extrapolated to the centre of the strip where plane strain was assumed, were obtained using both smooth and rough rolls. In the first case Orowan considered a low value of JLf=0.i4 and calculated an approximate yield stress distribution along the roll gap using the yield stress data published by Siebel and
(n
Pomp ' . It was found that at a low value of jJ such a graphical method gave results which were comparable with those obtained by early
(1 2 3 ^
theories' * . However when a high value of U was considered in the case of rough rolls, the graphical method produced roll pressures that were too high. Orowan suggested that here the frictional stress
exceeded the shear yield stress of the material and therefore theories that assumed slipping friction - US - were unsuitable in such cases. He concluded that if the frictional stress rises to the magnitude of the shear yield stress, plastic shear will occur in the interior of the deforming material, while the surface will stick to the rolls. In addition Orowan suggested that sticking conditions would appear first at the neutral point and that the zone of sticking friction would be extended towards both entry and exit planes as the coefficient of friction increased.
In order to study the effect of inhomogeneous deformation on roll pressures, Orowan followed Prandtl*s analysis^*^of the"compression of a slab between two rough parallel flat platens; which showed that the stress distribution was defined by,
1 'n
h 1 '
h 1
where C is a constant, h is the distance between the platens, X and Y are the coordinates with origin at the centre of the slab.
Since the roll surfaces are neither parallel nor plane, Orowan used
(11)
the analysis due to Nadai ', -in which the material is compressed between plane rough platens inclined at a small angle 5 . In Fig.— -an element of the deforming material subtends -an -angle (5* with the
centre line of the material and the stresses on this element are also indicated. Nadai proved that in such a case Prandtl's solutions become,
i=S-2K/H%2
(2A5.) 'fc-jd- (-Z.AA.)These equations axe valid, only in the case where the flow of the material is towards the thinnest edge of the wedge shaped slab. Although Nadai's solution applies specifically to this case, Orowan assumed that this solutions also held for material flowing in the opposite direction.
(
8
)
Underwood' 'pointed out that Nadai*s solution applies only to small angles of inclination of the platens, limiting the application of the resulting theory of rolling to small angles of contact.
Eq. 2.4.3* and Eq. 2.4.4. refer specifically to the case in which the material sticks to the platens. Orowan considered that the stress distributions given by these equations could be applied in the case in
which the surfaces of the material slip on the platens if a semi-angle
0 of a hypothetical wedge shaped slab sticking to the platens was calculated, so that the shear stress at the surface of a wedge of semi angle ^should be equal to|JSsK • Thus, the value of $^was related
t0
^ by
g*=
i<
g
Jl8
Substituting
9
in Eq.2.4.3 and Eq. 2.4.4 gives( Z i i U
•f= _US3- ( 2 . U J x b )
T
Orowan assumed that the stress distribution along the surface AB in Fig. 2.4.2. could be approximately the same as if the strip was compressed between two inclined platens tangential to the rolls at A
and B; so that Eq.2.4.4.b and Eq. 2.4.3»b describe the stress distribution along section AB.
The element
dr
in the basic Eq.2.4.1 acting across the surface element consisted of the horizontal components of both the radial and the shear stresses.Upon integration across the surface AB, the contribution of the radial stress component iC&vTOir to Utf) gave
J ioyWt)- to ((6)
ifU» A s - h * \ U - 1 IL S ® W M LS U A W . (2 .L S )
'o
The integrand in Eq,2.4.5* known as Orowan's inhomogeneity factor - w(a) - , is essentially a function of the parameter a=l|ls/k as shown in Fig. 2.^.2) .
Thus Eq.2.4.5 was abbreviated to:
|j(0) =Vis-KKw(o)
(2.i.soy
The contribution of the shear stress
X
to the total horizontal forcewas obtained by integration of its horizontal component .1 :inu along the surface AB. Hence,
Therefore the total horizontal force was given by,
Orowan proposed that under slipping conditions the shear stres contribution ji^(O) could be neglected while sticking conditions were associated with a=l and w(a)=^/4 . Hence, in the former case,
|l8)=ViS-2»CW(a')
{2
U.6
g
)
and for the latter case,
+
.(2A
6b)
The values of s obtained from Eqs. 2 .4 .60 and 2.4.6b were
substituted into the basic differential Eq, 2.4,1. Thus, Orowan obtained expressions in which a non-uniform pressure distribution across the thickness of the material undergoing deformation was included, viz.
(!• j ^ J(Q) CX$0) -r 2 2vCw (0) (siOt) + j).CoS0)
Since Eq.2.4.7a Is of the same form as Eq.2.4.la the general solution given by Eq. 2.4.2 was used. So that,
The analytical solution of Z(0)and the graphical integration of B($
)/z
(@
) enabled Orowan to obtain a solution in the case of sticking friction. With slipping friction the integration of the first term ofthe right hand side of Eq.2.4.7 can be done in finite terms, but there is an additional complication, because w(a) in the second terra of the right hand side depends on s{(]) and thus implicitly on (0) • However, as w(a) varies little with ^(0), Orowan proposed an approximate technique by which the variable inhomogeneity factor could be
included.Thus, an initial value of w(.a) calculated from the known radial pressure at entry, was used to determine J(j)]in the next interval in
j
the arc of contact. This implied that w(a) was considered constant over such an interval. The function w(a) was then recalculated with
the associated value of s(0) and used to determine the next value of 1(D)# as in general no second approximation of w(a) in each interval was
necessary. An analogous procedure was followed in the exit side. Orowan compared the measurements of roll pressure made by Siebel
(7 )
and Lueg 'at both high and low values of the coefficient of friction, with the results calculated with the inhoraogeneous graphical method. Only a slight discrepancy was obtained between the two sets of values, which occurred close to the point of maximum pressure. Here the results of the graphical method showed a sharp peak, while the experimental
results indicated a gradual change in pressure at this point(Fig.
2.4.4. ).
Orowan attributed, this change of the roll pressure urstrluutron rruuau the neutral point, to zones of zero plastic deformation whose presence was thought to have little effect upon the calculated values of roll loads.The complexity of Orowan's method undoubtedly caused some workers to develop alternative solutions applicable only to particular rolling conditions. A characteristic of such solutions was the use of
simplifying assumptions. Typical examples were the solution of Bland
(12} (14}
and Ford' for cold rolling and Sims' 'for hot rolling. These are
referred to below as approximate theories.
2.5 Approximate Theories.
(
12)
Bland and Ford 1 considered a flattened roll radius and small angles of contact. This enabled the following approximations to be
introduced £»n(lc-^cCG0-1 and'n=Vi2-^$S therefore Eq.2.^.1 was reduced to
(2M)
and with the condition of plasticity approximated to S-Zv^h
s° ^ ~ ^ ^ ^
which, after rearranging, became,
.2^iS/i\ + /i/-l\iGiiW = 2s(?(P±u)
(2.&A0)
i§W
)
U <I n
It was then assumed thath
_\U(2&)
i
c
2vi‘n d (i '
& I if 1
This arises because the material work-hardens as rolling proceeds and the thickness of the plate' is reduced: thus 2k increases as h
ft A
decreases. Furthermore, the coefficient \n^~ iJ ^-s sir*aH when low coefficients of friction are used. Hence, Eq. 2.5*la was reduced to
I f_ \ /,. 1 =
which, after integration gave,
V v - c S ^ r 1 ^ !
• -»*N I i .and — ■ / •— \
H = 2 Jr
1 * hi c W hif>>
IIn order to integrate readily the resulting pressure distribution a mean value of the yield stress^was introduced,viz.,
rt/t
ft..
This method was shown to give close agreement with Orowan's homogeneous graphical solution, except for the cases of high back
/S 1 Uivi)
tension with rapid work-hardening. Under these conditions the term 7 7: — ‘^N'V Ui( i $
may not be negligible.
.
(13)Under these circumstances, the solution of Bland and Sims' -^allows a determination of roll pressure to he made hy including the effect of front and hack tension to arrive at,
- \ i j e/b U
i
S'=
_-|,j e/lp
Wens
Later Sims^^assumed that sticking friction would occur over the whole arc of contact and that the shear yield stress would remain constant during the rolling pass. The compression process was
approximated to the deformation of a strip between two rough inclined platens, following Orowan, to obtain,
i/h= ls' A X )
This relationship was substituted in the equilibrium Eq.2.4.1 , togethei
with the approximations QoO^O and CO$0- \ ec$0 = 0 ^ • Thus
Eq. 2.4.1 became, 1 « /r ,
Integration of Eq,2.5«;lb gave
(W lH s M
4*®1
<2-5- «(9/0,>“= $ W il\
&
(2.5.2a)
where
m h j h ' J l e
Sims proposed that mean values of the yield stress could be
obtained by the use of an equation of the form K-f\(r')-v5(.r)lp\ where A(r) and B(r) are constants that could be determined from experimental yield stress data obtained at strain rates equal to the mean rolling strain rates and various reductions. It was also shown that the geometry of the roll gap led to an expression of the mean strain
rate given by r ^ \ q
f>OjrJlr| V r
( 3b)
Cook and McCrum obtained a graphical method based on Sims' solution by which roll force and torque could be determined. This method was limited to the case of the hot rolling of flat sections.
Orowan and Pascoe^^made a further approximation to Orowan's exact solution, which was applicable only in the case when the length of the arc of contact was much greater than the thickness of the strip. It was then assumed that because the planes tangential to the roll surfaces are parallel at the exit plane, the slope of the pressure distribution at a-this point must be the same as that produced by the compression of the material between horizontal platens set hcapart. Thus, the condition of equilibrium for a vertical segment of the compressed material was . i ^ ^ ,
A o c p - V ^ t c ^ O
and from the condition of plasticity under plane strain
| ! ^ r 1 1
so , and n0(icj^'2tdv- [ 2 3 3 )
Thus, assuming sticking conditions, under hot rolling Eq. 2 .5 . 0
was integrated to
where qcis the vertical pressure at entry, which under inhomogeneous deformation and vanishing horizontal pressure becomes o
The slope of the pressure distribution at the exit side was given by
Recently El Kalay and Sparling 'proposed an approximate method to use in flat hot rolling including the Orowan inhomogeneity factor
(12) w(a). The method was a combination of both: Bland and Ford's solution to calculate roll pressures in the zones immediately adjacent to the