http://dx.doi.org/10.4236/nr.2014.51004
Population, Development and Deforestation in Songea
District, Tanzania
*
Michael J. Haule
Lecturer at the College of Business Education, Dar es Salaam, Tanzania. Email: mikehaule@gmail.com, m.haule@cbe.ac.tz
Received September 5th, 2013; revised October 11th, 2013; accepted November 16th, 2013
Copyright © 2014 Michael J. Haule. This is an open access article distributed under the Creative Commons Attribution License, which permits unrestricted use, distribution, and reproduction in any medium, provided the original work is properly cited. In accor-dance of the Creative Commons Attribution License all Copyrights © 2014 are reserved for SCIRP and the owner of the intellectual property Michael J. Haule. All Copyright © 2014 are guarded by law and by SCIRP as a guardian.
ABSTRACT
Deforestation is a phenomenon that forms part of environmental degradation. The fact that deforestation is both a source and contributor to global warming, as it reduces the carbon sinks, cannot be contested [1]. A case study research was carried out in Songea Tanzania aimed at establishing whether there was differential participation of people of different demographic characteristics in those activities that lead into tree cover decline. The study revealed that people of different age group and, sex categories played different roles in activities that lead to de-forestation such as felling trees for firewood and felling trees for establishing and/or for expanding farms. It was observed that age group and sex categories influenced one’s involvement or participation in deforestation thus contributing differently by both activity and degree of forest cover reduction. This literally means that people of different demographic characteristics of age and sex contributed differently to the ailing deforestation process. From this end, it is logical and implicit arguing that the identification of actors in deforestation-related activities confirms the disaggregated manner by which population acts on the environment. Development of blanket con-servation packages that are not focused on age group and sex categories of members the population in question remains too general and in-effective. To be precise, the planning and implementation of effective conservation initiatives has to take into account demographic characteristics of the population in question. The observed real-ity is that the population engages with the environment not as a unit but in its disaggregated manner, i.e. based on its demographic sub-categories [2]. The theory behind a successful conservation initiative is based on unveil-ing the mechanism by which population acts when resultunveil-ing to deforestation.
KEYWORDS
Population; Development; Environment; Actors; Key Actors; Deforestation
1. Introduction
This article is an effort towards production of knowledge and detailed explanations regarding involvement of people of different demographic characteristics, i.e. age groups and sex categories, in activities that shape the forest cover. It is written with the notion that understand- ing the mechanism by which population interacts with the forest cover is located at the interface between people of particular demographic characteristic and the forest. Specific activities under review include forest clearing
for farm expansion and felling trees for firewood. Identification of the key actors in each of the activity leading to forest cover decrease is considered as a pro- found step towards explaining the way household mem- bers of different sex categories, age groups engage in the adverse environmental process. Conceding the stance held by Orians and Skumanich [2], we also assert that human population does not come into interface with the forest as a single unit but in its disaggregated manner.
The article advances the rationale behind the observed people’s differential involvement in such activities that lead to deforestation, with a focus on the West Matogoro Catchment forest located in Songea district of Tanzania.
*The article is based on a chapter of the author’s PhD thesis submitted
The actors in such activities were the ones at the inter- face between development and environment. The know- ledge generated by the study is critical for quantification of the extent to which various actors, by their age group and or sex categories, contribute to deforestation. It is hereby postulated and partly confirmed that identification of the key actors in farm expansion and firewood collec- tion, by their demographic characteristics, is to be central in carrying out the population, development and envi- ronment (PDE) analysis.
The future planning and formulation of forest conser- vation strategies, packages and interventions may be more focused and effective by targeting the specific ac- tive populations of key actors. The key actors were iden- tified not only in terms of who or how many they are, but more important were their demographic characteristics, the impact they caused and rationale behind their en- gagement in the specific deforestation-related activities. Such knowledge ensures higher level precision in the planning of extension packages and the possibility for directing the tailor-made packages to the right target population, a vital aspect for effectiveness and sustaina- bility of conservation efforts.
The understanding and the establishment of the spe- cific man-resource interface constitute the main focus of the article. It is envisaged that without the identification of the key actors to the ailing deforestation process, by their demographic characteristics, there will be less spe- cificity in the tackling of various crucial stages of for- mulation of conservation packages. This is likely to amount into misdirection and consequent ineffectiveness of the conservation activities.
Population, dynamic as it is, needs to be articulated in the analysis. Knowledge on population projection can hence be directly harnessed for use in examining and establishing future trends in population and environmen- tal change if the key actors in environmentally significant processes are known. The key actors form the nexus of PDE relationship. They constitute the “linking popula- tion”. The key actors provide a link between the total population and the actual “resource harvesting” whose interplay directly shapes the environment.
It is worth mentioning, at this stage, that the study was conducted while cognizant of the fact that population growth accelerated the demand for food and other forest products that necessitated the expansion of farms and enhanced extensive and intensive use of firewood. The analysis was based on the classical development para- digm which assumes the key actors, being males and/or females, were “mere agents” of the rest of the household population that benefited from the role of such key actors in specified activities that contributed to the observed declining status of the forest cover of the West Matogoro Catchment Area (WMCA) of Songea, Tanzania. In this
manner, there could be no big variations like the case would be when considering the entire population, which is more generalized and likely to be “demographically misguided”. This is the essence of the need for more fo-cused planning and implementation of the conservation efforts based on key actors identification which the ar-ticle proposes.
2. Methodology
2.1. Study Design
The study was both quantitative and qualitative and made use of both primary and secondary data.
2.1.1. Primary Data
Primary data included both quantitative and qualitative. Quantitative data were collected through household sur- vey conducted in 2005 covering eight out of eleven vil- lages of the WMCA. It covered 40% of the households found in the sample households. Qualitative data were collected through participatory rural appraisal (PRA) and participant observation. The breakdown of the sample households used in the survey is presented in Table 1. The household survey data formed the baseline of the analysis.
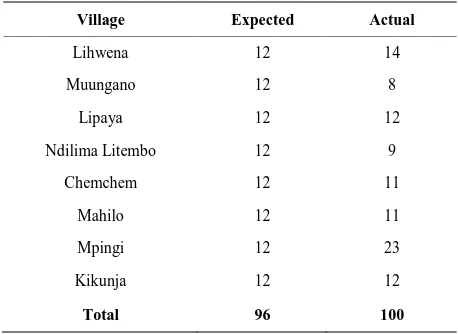
The participants of the PRAs were selected based on gender mix, age groups, sub-villages, and one’s position in the village authority, nature of economic activity, so- cial practice and culture. Purposeful sampling was used in participant selection as it guaranteed maximum varia- tion of participants. Specific approaches and methods used during PRAs included dialogue that utilized fill in blanks, pair-wise ranking, cause and effect diagrams and trend analysis. The number of people participated in PRAs are as presented in Table 2.
Observation method was used to collect general in- formation on various issues pertinent population, devel- opment and environment. The issues included population distribution, settlement patterns, village layouts, farming and forest practices and social systems. Spot observation was carried out at specific sites such as at the sources of the Makupe and Kapela Rivers located at Lihwena and Kikunja respectively.
Data obtained through observation were analyzed and the outcome merged in the production of knowledge re- garding relationship between population, development and environment. Geographic Information System (GIS)
was used to determine the rate of deforestation by activi- ties in the study area.
2.1.2. Secondary Data
Secondary data were all quantitative. Population data
Table 1. Population sample by villages.
Village No. of
Households
Sample Size
Percentage Sample
Chemchem 282 95 40
Mahilo 141 65 40
Mpingi 262 103 40
Ndilima Litembo 185 69 40
Kikunja 245 85 40
Lihwena 161 114 40
Muungano 252 58 40
Lipaya 200 110 40
Source: Field Survey, 2005.
Table 2. PRA participants by villages.
Village Expected Actual
Lihwena 12 14
Muungano 12 8
Lipaya 12 12
Ndilima Litembo 12 9
Chemchem 12 11
Mahilo 12 11
Mpingi 12 23
Kikunja 12 12
Total 96 100
Source: Field Survey, 2005.
lyzed to establish changes in population size, age struc- ture and sex composition through time.
2.2. Data Analysis
Changes in population of the actors in terms of size, age structure and sex composition for 1978, 1988, 2002 and 2005 were analyzed to determine trends and changes in population characteristics to compare such changes with changes in forest cover. In the analysis, population size was determined by numbers of people, age structure by variations in age groups of actors and sex composition by sex ratios.
The article analyzed the data from Household Field Survey1 and the Participatory Rural Appraisal (PRA)2. A total of 3371 household members who lived in 699
households had their data on engagement in deforesta- tion-related activities collected and analyzed to deter- mine their actual involvement in contributing to defore- station.
The complexity regarding deviations in environmen- tally-related behaviors within specified age groups, be- tween the age groups and sometimes even within a single age group with time, were issues investigated. Socio economic profile documents provided baseline informa- tion[6-9].
The method adopted for the analysis of the population based on the understanding of the modus operandi of the members of the population on the environment, forest cover in particular. It was assumed that household mem- bers, by age groups or sex categories classified as key actors, behaved in a similar way when they interacted with the environment in terms of both the intensity and the durationof such activities that shaped the forest cover characteristics and determined the forest quality.
3. Presentation of Findings
3.1. People’s Involvement in Activities
Contributing to Deforestation through Farm
Expansion and Firewood Collecting by
Demographic Characteristics
Participatory Rural Appraisal (PRA) conducted in the area indicated existence of positive relationship between demographic characteristics of the individual and his/her role in activities related to deforestation. It means that one’s age group and/or sex category influenced his/her likelihood to be involved in activities that caused or ac- celerated deforestation.
Age-based and gender-based division of labour are significant factors in explaining the noted age-based or gender-based biases in involvement in activities with negative environmental consequences. The reality is that specific socio-economic tasks were traditionally assigned to individuals based on one’s age and/or sex necessitated for the observed bias. It is this bias that enables for de- forestation to be analyzed on demographic basis; and so is forest conservation. This may be done with regard to both causation and the extent of the effects.
However, investigating on the reasons behind tradi- tional age and/or sex-based division of labour is beyond the scope of the study. Explaining its perpetuity in socie- ties for generations, without significant changes, was considered to be another different subject of enquiry.
3.1.1. People’s Involvement in Forest Clearing for Farm Expansion
1) Involvement by Age-Groups
Survey data in Table 3 indicate that out of 3371 people who lived in the 699 interviewed households, only 18.5%
1
Household Field Survey was conducted in eight of the eleven villages of WMCA to collect data and information to be used in the analysis of PDE relationship in this study.
2Participatory Rural Appraisal was conducted in the study area to
[image:3.595.57.286.298.465.2]Table 3. Household members’ involvement in forest clear-ing through expandclear-ing farms.
Responses Number Percentage
Yes 623 18.5
No 1294 38.4
Not Applicable 1454 43.1
Total 3371 100
Source: Field Survey, 2005.
of them were involved in clearing of the forest for the purpose of expanding farms, while about 38.4% did not take part in the activity. The observed unique feature was that about 43.1% of the household members who indi- cated that the activity was not applicable3. We may pro- foundly argue that farm expansion is an activity that in- volved a relatively small proportion of the population.
Scarcity of public forest land for expansion of farms and the adoption of more intensive farming methods were main reasons for a significant proportion of the popula- tion not being engaged in farm expansion.
Both PRA results and field observations noted acute scarcity of both closed woodland forestsand open public forests on which inhabitants could expand farms into. GIS evidenced the same.
Communities of Lihwena, Muungano and Chemchem had little possibility to expand farms mainly due to their nearness to the municipality of Songea, whereby farming was largely restricted and that urban settlements ex- panded to the peri-urban with the tendency to occupy potential farm areas hence transforming them into urban sectors. Having been surrounded by forest reserves, in- habitants of Ndilima Litembo village lacked the land area for expanding farms. Under the observed land scarcity situations, any increase in farm output depended on ei- ther intensification of farming practices or encroachment of the forest reserves. It was a common scenery in WMCA to find economic activities expanding at the ex- pense of forest reserves; and overt progressive clearing of a few remaining mosaics of closed woodlands and unoccupied public forest lands. Lack of buffer zone man- agement was among the reasons advanced explaining this situation (URT, 2005a). Establishing reasons for the paucity of buffer zone management in the area lies beyond the scope of this study.
Farm expansion was generally driven by the rising food requirements for the growing size of households. Thus it was deemed significant to identify the actors in the activity so as to focus on conservation activities for sustainable results. The population pyramid Figure 1 in- dicates that clearing the forest for the purpose of ex-
Source: Field Survey, 2005.
Figure 1. Involvement of household members in forest
clearing for expanding farms by age groups and sex catego-ries (2005).
panding new farms to be an activity carried out mainly by young adult males.
According to GIS evidence, it was observed that be- tween 1978 and 1988, about 608 Ha of closed woodland were cleared, i.e. 8.73% of the forest existed in 1978. Between 1988 and 2002 more woodland forests were cleared, i.e. about 851.2 Ha; constituting 13.4% of the forest existed in 1988. For the period between 2002 and 2005about 2461 Ha of closed forest were lost, i.e. 44.7%. It is implicit that by 2005 the remaining woodland forest constituted of only 10.6% of the total forest area that existed in 1978 [10].
a) Actors in Clearing Forests for Establishing New Farms by Age Groups
Population pyramid Figure 1 demonstrates that indi-vidual’s interaction with the forest for farm expansion begins at the age of about 8. People in such younger age groups are “inducted” into the activity as part of “training” of the younger generation to join the mainstream small-holder production systems. PRA discussions indicate that at the age of between 15 and 18, involvement of male members of the households in the activity to be more significant since when in the same age segment one has to own a farm, a sign of maturity and socially responsible adulthood.
On this basis, it was not much surprising that those in the age groups 15 to 39 to constitute the majority of the participants in the activity. Massive involvement of the younger population in the activity derived from the fact that they constituted the energetic sector of the popula- tion; vested with socially significant responsibility that ranged from getting married, caring for both their own children and other household members. The number of participants in the activity dropped drastically at the age of 49+ signifying the “exit age” for the activity.
Existence of a proportionately larger group of people aged 60+ was noted to possibly be caused by a miscon- ception of the question. PRA results indicated that such people apparently had played a significant role in farm
3Most of the households depended on farming but they could not
[image:4.595.308.539.85.215.2] [image:4.595.59.287.112.193.2]expansion sometime in the past, but would not like to remain unmarked for their contribution to extensive farming. To the local inhabitants of Songea district, ex- panding a farm signified profound success and an impor- tant investment for the household. Therefore it sounded derogatory for a person indicating not having cleared the forest for the purpose. Thus, the possibility for over re- porting on the issue could not be ruled out.
It was observed that only a small proportion of the population was involved the important activity, i.e. out of 3371 household members, only 623 were actually, i.e. 18.5%. However this does not mean that the activity im- pacted less on the decrease of the forest cover.
b) The Key Actors in Converting Forests into Farms To identify the key actors in the process, data for those who played role in deforestation-related activities and those who did not take part were plotted on the same XY plane. The first intersection indicated the “entry age”, while the second intersection indicated “exit age”.
Figure 2 illustrates that the optimum “entry age” for the activity was 10 while the “exit age” was 44. PRA results lowered the entry age to 10 years. People falling within this range of age segment were the ones who gen-erally contributed to the observed decrease in forest cov-er through expanding farms into previously forested areas evidenced by GIS land cover matrix. The optimum points were located at the points of intersections between those who did not engage in the activity and those who were actually involved.
c) The Key Actors in Conversion of Forests into Farms by their Age Groups
Survey results demonstrated in Figure 2 indicate that the fastest rate of growth of numbers of participants occurred between age groups 10 - 19 and 19 - 24. This section of the population consisted of people who were more energetic to carry out such a task thus displaying a significant contribution to forest cover decrease. The optimum age for one to start involving themselves in the same activity was about 20, i.e. where curves inter-sected.
In this case the key actors in the activity, therefore, constituted of those members aged from 20 to 44, which were the most active population segment in the activity. During the study year, i.e. 2005 there were 345 house- hold members in this age segment who constituted 10.2% of the total households’ population and 55.4% of the total of 623 people noted to be involved in the activity.
When analyzing changes in age group sizes of the key actors, basing on Figure 3, it can be noted that the num-ber of key actors reached the highest point at younger age group, i.e. 15. The numbers of key actors slowly but progressively decreased from age group 25 - 34 and 35 to 44. The less involvement of those aged between 45 and 54 may be explained to be the result of stabilization
[image:5.595.309.539.85.223.2]Source: Field Survey, 2005.
Figure 2. Involvement of household members in tree felling for farm expansion.
[image:5.595.309.538.260.371.2]Source: Field Survey, 2005.
Figure 3. Distribution of key actors (Males) in forest clear-ing for farm expansion by age groups (2005).
of household economies and/or activities, implying that the task of clearing the forest for extra farms was com- pleted and stopped. It may also imply that the following generation (their sons) had taken charge of the activity by the time in their 20s. A sudden drop of involvement was noted at the age of 44 and above. Most of the people in the elderly age groups, i.e. those aged 55 and above were less involved in the activity mainly on account of their physical weakness and may as well be attributed to self- actualization, i.e. they had already cleared the forest to have acquired enough farmlands.
2) Involvement by Sex Categories
PRA results revealed differential involvement in vari- ous economic activities between males and females. This kind of relationship could mainly be attributed to social division of labour and specialization, whereby some du- ties are designated for males and others were meant only for females.
However, it was observed that in the event of the ab- sence of a member of the sex “designated” responsible for a particular activity, a member of another sex could just take over. Community members regarded it a taboo for a particular member of a certain sex to play a socio- economic role meant for a member of the opposite sex category when the “right candidate” was present and in perfect physical and mental conditions to perform the activity.
0 50 100 150 200 250 300 350
15 - 24 25 - 34 35 - 44 45 - 54
The two population pyramids, i.e. Figure 1 and Fig-ure 4, demonstrate the involvement of house-hold popu-lation in clearing the forest for farm expansion and for firewood. Both pyramids demonstrate existence of a broad sex bias in household members’ involvement in the two activities. However, PRA discussions revealed that in firewood cutting, females were responsible mainly for collecting tree branches of already cut by males. Males were thus, responsible for the cutting or felling of trees for firewood chopping.
PRA discussions pointed out the main reasons for ex- plaining the state of affairs based on differences in terms of muscular capacities for labour between males and fe- males; hence underlining the observed perpetual division of labour. PRAs revealed that duties such as clearing the forest for farm expansion, molding and burning of bricks and construction of homesteads were considered “too heavy for females”, therefore, a prerogative of their male counterparts. Whether such biological assumptions that female are physically weak are correct, is an aspect con- sidered beyond the scope of this study.
The population pyramid Figure 1 indicates males’ do- minance in involvement in the felling of trees for farm expansion; therefore, they contributed more to deforesta- tion through the activity. Less involvement of females in the activity was attributed to the socially based division of labour, with males being traditionally charged with the responsibility of ensuring the continuous and satisfactory availability food for the household. PRA results under- lined similar results.
Patriarchy was mentioned to form the basis of domin- ance of male sex in the activity as males were the “own- ers” of the homesteads, farms and farmlands. These were, therefore, logically responsible for both farm preparation and maintenance. The same findings have also been col- laborated by Mbilinyi [11] in her study in conducted in Morogoro, Tanzania.
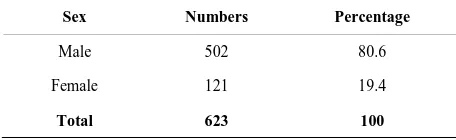
Generally, based on data in Table 4, one may tend to strongly argue on the existence of a positive relationship between one’s sex and involvement in the task of clear- ing of the forest for establishing new farms. About 80.6% of the males participated in the activity compared to 19.4% of their female counterparts, therefore, implying that males dominated the activity. Similar results were
Table 4. Household members’ involvement in forest clear-ing through farm expansion by sex.
Sex Numbers Percentage
Male 502 80.6
Female 121 19.4
Total 623 100
Source: Field Survey, 2005.
[image:6.595.310.538.85.218.2]Source: Field Survey, 2005.
Figure 4. Actors in clearing forests for choping firewood by age groups and sex categories (2005).
echoed by the PRA findings.
However, survey data indicated that the sex-based proportions of those members to whom expansion of farms was not applicable were 48.4% for males and 51.6% for females. Presence of a large number of people to whom the activity is marked as “not applicable” mainly emanated from scarcity of land area for farm expansion.
3.1.2. People’s Involvement in Felling Trees for Firewood by Age Groups and Sex Categories 1) Involvement by Age Groups
Population pyramid Figure 3 indicates presence of few people in the age group 0 - 4 who participated in the task of chopping and collecting firewood. PRA results attributed the trend to lack of enough muscular energy to chop and carry a sizable firewood bundle (mzigo) and walk with it for a distance due to their young age. The age of 4 was therefore considered too low for effective involvement in the activity.
a) Actors in Collecting Firewood
The population pyramid Figure 4 demonstrates the presence of 1,350 people, constituted about 40% of the total population of the household members who partici- pated in the activity. The participants in the activity were within the age group range of 5 - 9 to 60+.
When studying the age structure of the key actors, the same population pyramid indicates the presence of rela- tively less participation of members aged above 40. PRA results attributed to their old age associated it with their being less energetic; and that their off springs had already taken charge over the activity. A drop in numbers of those aged 40 and above implied a drop in their propor- tionate contribution to deforestation through the same activity.
[image:6.595.57.285.653.723.2]at the age group 5 - 9. PRA results pegged the initial age for involvement in the activity at 8. Whether this could be classified as child labour is an aspect beyond the scope of this study.
The number of participants in the activity tended to increase with increasing age up to the age group 25 - 29, where the initial point of decline was observed. From that point the general trend indicated a decreasing num- ber of participants with increasing age. This trend could partly be attributed to the generally observed less in- volvement of males in the activity at both maturity and advanced ages.
The observed unique feature was a sharp rise in in- volvement of people in old age, i.e. aged 55 and above. This could partly be explained in terms of lack of effec- tive “social security mechanisms” to care for the elderly. The elderly were, therefore, left to struggle on their own to earn a living. These old males and females had, as well, to take care of their grandchildren, orphans and widows. A positive relationship between one’s age and involve- ment in the activity of chopping and collecting firewood was noted. The most active age groups in the activity were those between 10 - 14 and 35 - 39. The entire age- groups range constituted 935 household members, i.e. 27.7% of the total households’ population; and 69.2% of the 1350 members who generally participated in the ac- tivity.
b) Identification of the Key Actors in Firewood Col- lecting by Age Groups
Figure 5 indicates that the “entry age” for the activity of chopping and collecting firewood to be 10 while the “exit age” was 49. The stability age was between 15 and 44. From that point onwards the trends were on the reverse, i.e. a decreasing number of key actors with increasing age that was experienced progressively to-wards the “exit age” of 49. From the “exit age” point, the number of key actors declined drastically towards 60+.
People in the age group 10 - 14 constituted the major- ity of participants in the activity, though due to their rela- tively younger age, they possibly contributed less to the deforestation. They merely rendered “assistance” to the more profound players in the activity. As part of the key actors as their presence in large numbers brought about a considerable impact to forest cover change despite their comparatively less individual impact. Although these were the “apprentices” in the process, they likely contri- buted significantly to deforestation. Specific assessment of the impact they caused could provide for a better un- derstanding of both their current contribution and the future potential in changing the forest cover.
c) Key Actors in Collecting Firewood by Age Groups While 40% of the household members played an ac- tive role in chopping and collecting firewood while 60% did not take part in the activity at all. The article perce-
[image:7.595.309.540.84.226.2]Source: Field Survey, 2005.
Figure 5. Involvement of household members in tree felling for obtaining firewood.
ives it important to establish the demographic characte- ristics of key actors in this activity so as to establish the main participants in the activity. Such information is considered basic to the improvement of sources of fire- wood and enhances sustainable resource utilization for the few firewood supplies available. Determining the target population for the activity that adversely affects the environment was therefore considered indispensable for effective natural resource management.
The distribution of the key actors by age groups, as il- lustrated in Figure 6, indicates that the key actor’s age ranged from 10 to 44. The general trends in variations in age groups demonstrated an increase in the numbers of key actors with increasing age from lower age groups towards the age group 15 - 24.
From the above findings, we may, therefore, strongly argue on the existence of positive relationship between one’s age and his/her involvement in the activity of fel- ling trees for domestic firewood. It is the emphasis of the author, at this point, profoundly arguing that since not all household members had homogeneous type of interface with natural resources, taking on board demographic analysis of the population-resources relationship for sus- tainable resources use remains both significant and ne- cessary for the effective planning of sustainable conser- vation activities.
2) Involvement by Sex Categories
Table 5. Households’ members involvement in collecting firewood by sex.
Sex Numbers Percentage
Male 258 19.1
Female 1092 80.9
Total 1350 100
Source: Field Survey, 2005.
Source: Field Survey, 2005.
Figure 6. Distribution of key actors (Females) in felling trees for chopping firewood by age groups and sex composi-tion (2005).
wood collectors. A similar observation is experienced and reported over vast parts of the developing world [14].
PRA results revealed a similar pattern of division of labour whereby the conspicuous role of females in fire- wood collection was observed and noted. This was mainly attributed to the fact that females were the ones socially responsible for cooking. They are the members who implicitly knew the right types of wood species needed, based on vast experiences acquired through gen- erations. Females know about the right type of trees for firewood regarding wood type and related characteristics such as amount of heat and/or smoke it produced; the duration of burning and many others; experienced in the kitchen where women were predominantly responsible for cooking.
In rural areas of Songea, firewood was not a commod- ity and that it took between 2.6 to 10 hours walk to col- lect it; a task normally done by women and small child- ren [6,15]. The same fact was echoed by Johnsen, who argued that in most of the tribes of Tanzania, firewood gathering belonged to women’s duties [16]. The observa- tion implied that the social division of labour has been a long term customary practice. Establishing reasons be- hind long term continuity of such customary practices forms another area of enquiry.
General trends, as demonstrated in Table 6, indicated that only a small proportion of the population, i.e. about 40% that was actually engaged in the activity. The fact is that majority of the respondents, i.e. 69% obtained fire-
Table 6. People’s involvement/non involvement in collecting firewood by sex.
Sex
Involvement in Collecting Firewood
Total
Yes No Not Applicable
Male 258 1429 3 1690
Female 1092 587 2 1681
Total 1350 2016 5 3371
Source: Field Survey, 2005.
wood from the neighbouring forests implying that they caused the observed forest cover change within their re- spective localities.
Farm expansion was a more general activity which cleared almost all vegetation in the cultivated area, at the same time and by the very process. The trees which were slashed while clearing for farming were as well used for firewood. Huge tree logs were normally burnt in the farms or used as firewood in other activities like being used for boiling water during brewing and/or brick bak- ing. Thus separating the impact of deforestation by spe- cific activity was in the real situation observed to be practically impossible.
4. Conclusions
The generalization that population growth leads into en- vironmental degradation is the reality that cannot be contested; however, the assertion is still at the level of generality that calls for more specificity when formulat- ing more pragmatic measures to environmental conserva- tion.
The finding that people of different age groups and sex categories were involved differently in activities that lead to forest cover change is of great significance in the fo- cusing of the planning for sustainable conservation.
The differential involvement of people of different de- mographic characteristics implicitly translates into diffe- rential contribution of the same population sub-groups to both deforestation and conservation processes. This dif- ferential involvement is in this study context considered as a significant factor and the locus of population-re- source interface. Articulation of this fact in the PDE analysis and its utility in conservation process provide the baseline understanding of the mechanism by which deforestation actually operates. It is a generative aspect of primary knowledge hereby considered critical for de- velopment of effective and sustainable forest conserva- tion undertakings.
[image:8.595.56.289.110.326.2]vegetation resources differently in terms of their roles, types of products and the “how” part of it, calls for a dif- ferential approach and content of extension packages when intervening during forest conservation undertak- ings. The tested reality is that men and women may par- ticipate in forest conservation, but for different reasons and deviant expectations.
The author therefore point out the need to effectively engage people of different sex in activities that would maximize their participation and enhance conservation outcome. Thus, it is not only the question of tree planting, without establishing a tree for what purpose and who stands to be the right person to plant and hence care for it. The socially assigned roles that lead into one to pursue certain types of activities should be harnessed to enhance sustainability of location-specific forest conservation in- itiatives.
Further studies are recommended on the people’s dif- ferential involvement in activities resulting to deforesta- tion based on age, sex and levels of education so as to refine ways and means whereby deforestation actually taking place. Such studies may as well identify the most vulnerable groups of the subsequent negative impact of deforestation and how they engage in conservation to mitigate difficulties caused by environmental degradation. In our understanding, both the causers of deforestation and the most affected have the duty to collaborate in re- solving the ailing environmental degradation process of the time.
5. Recommendations
As one’s age has relationship with one’s involvement in activities that lead to forest cover decrease, there is a need to study the age structure of the population of a par- ticular area where forest conservation initiatives have to intervene.
Different conservation packages and initiatives have to be tailor-made to the in situ population and directed to different age groups and sex categories according to their role in deforestation process. Those yet involving them- selves in the activities, the potential destroyers of the forest cover, should be educated on the negative impact of deforestation. Those in the environmentally active age groups, should be educated on the consequences of de- forestation and encouraged to replace the already lost and the currently forest cover which is still being lost.
We hereby urge for “let the destroyer repair”. This philosophy is supported by two sets of reasons. One is the social responsibility and accountability to be repla- ced by the one who destroyed it. The other is the reality that the destroyer destroys while actually using and gaining from it, so as the forest dwindles, the business is threatened. The most affected sector of the population is
hereby considered as the possible active member in rep- lenishment of the forest cover.
As sex is found to be associated with forest destruction activities, we recommend that conservation is initiative to have a gender dimension. Such gender sensitive envi- ronmental conservation programmes will have a long terms impact as they address reality of the situation. While females are better placed and eager to plant trees meant for boosting firewood supplies, males may be quick to adopt the planting trees for timber and construc- tion purposes.
REFERENCES
[1] World Resources Institute, “Climate, Biodiversity and Forests,” 2006. www.wri.org
[2] C. Orians and M. Skumanich, “Population- Environment Connection: What Does It Mean for Environmental Poli-cy?” US Environmental Protection Agency, 2003. www.seatle.battelle.org
[3] URT, “The 1978 Population Census Report Volume II. Population by Age and Sex for Villages/wards and Urban,” Ministry of Planning and Economic Affairs, Dar es Sa- laam, 1981.
[4] URT, “The 1988 Population Census-Ruvuma regional Profile,” President’s of fice-Planning Commission, Dar es Salaam, 1990.
[5] URT, “Population and Housing Census General Report,” President’s Office, Planning Commission, Dar es Salaam, 2002.
[6] UNFPA, “Women and Environment,” Beijing Platform for Action, Paragraphs, 2001.
[7] URT, “Ruvuma Regional Socio-Economic Profile,” Gov- ernment Printers, Dar es Salaam, 1997.
[8] URT, “The 2002 Population and Housing Census Report Vol. II. 2003. Age and Sex Distribution,” President’s Of-fice-Planning and Privatization, Dar es Salaam, 2003.
[9] URT, “Baseline Study on Biomass Energy Conservation in Tanzania,” Dar Es Salaam, 2005, pp. 246-250.
[10] M. Haule, “Population Dynamics and Sustainable Forest Conservation: A Case Study of the West Matogoro Cat-chment Area in Songea,” PhD Thesis, University of KwaZulu-Natal, Tanzania, 2010.
[11] M. Mbilinyi, “The End of Smallholder Farming? Gender and Structural Adjustment,” TGNP Gender and Devel-opment Seminar Series, Dar es Salaam, 1997.
[12] S. Punch, “Household Division of Labour: Generation, Gender, Age, Birth Order and Sibling Composition,” Work, Employment and Society, Vol. 15, No. 4, 2001, pp. 800-823.http://dx.doi.org/10.1177/095001701400438215 [13] Sherbinin, “Rural Household Micro-Demographics,
Live-lihoods and the Environment,” Background Paper Popu-lation-Environment Research Network Cyber Seminar, 2006, pp. 10-24.
www.populationenvironmentresearch.org
Policies,” UNESCAP Project on Capacity Building on Integration of Energy and Rural Development Planning. Background Paper for Expert Group Meeting. 2003. [15] T. Huvisa, “Deforestation, The Rural Energy Crisis and
the Impacts on Women in Songea District,” Dissertation for Masters of Arts (Development Studies) (Mimeo),
University of Dar es Salaam, Dar es Salaam, 1997.
[16] F. Johnsen, “Burning with Enthusiasm: Fuel wood Scar-city in Tanzania in Terms of Severity, Impacts and Re-medies,” Forum for Development Studies, 2007. www.umb.no/noragric/publications