Egypt’s Image as a Tourist Destination:
A Perspective of Foreign Tourists
Ghada Abdalla, Mohamed
Suez Canal University
27 April 2007
Online at
https://mpra.ub.uni-muenchen.de/25374/
EGYPT'S IMAGE AS A TOURIST DESTINATION – A
PERSPECTIVE OF FOREIGN TOURISTS
Ghada Abdalla Mohamed1 Suez Canal University
The influence of tourism image on consumer behaviour was studied by many researches. Others have pointed out the effect of tourism image on quality perceived by tourists and on the satisfaction of them. This study was conducted with the purpose of studying the relationship between the image of a destination and tourist's behavioural intentions, and between that same image and the post-purchase evaluation of the quality of the whole destination and the tour. This study also examined the relationship between quality and satisfaction and between quality and the tourist’s behaviour variables. In addition, the relationship between promotion tools and image were also examined. The empirical study was conducted in two cities: Hurrahed representing recreational tourism and Cairo for cultural tourism .A self field questionnaire was used to collect information. Path analysis used to study the causal relationships among variables. The findings indicated that for recreation tourism image had effective role on behavioural variables and satisfaction. Perceived quality of the destination had a positive influence on satisfaction as well as willingness to return. On the contrary, for cultural tourism image affected the quality of both the destination and the tour. Whereas, image had no effect on willingness to return, satisfaction or recommendation.
Keywords: Tourism image; quality; satisfaction; Intention to return; willingness to recommend.
INTRODUCTION
The most common used definition of tourism product image was that of Reynolds (1965), his definition is: The mental construct developed by the consumer on the basis of a few selected impressions among the flood of total impressions; it comes into being through a creative process in which these selected impressions are elaborated , embellished and ordered. Whereas, Kotler et al. (1993), defined place image as “The sum
of beliefs, ideas and impressions that people have of a place. It represents simplification of a large number of associations and pieces of information connected with the place. They are a product of the mind trying to process and ‘essentials’ huge amounts of data about a place. Tourists destination image has been one of the more frequently investigated topics studied by tourism researchers (Calantone, di Benedetto, Hakam & Bojanic, 1989; Echtner & Richie, 1993; Goodrich, 1977; Milman & Pizam, 1995, Pearce, 1982; Phelps, 1986).
Tourism image is defined as an individual’s overall perception or total set of impressions of a place (Fakeye&Crompton, 1991; Hunt, 1975; Phelps, 1986). The writers concluded that potential travellers might translate their perceptions of destinations’ attributes in formulating their destination choice decision.
Many authors assured the influence of tourism image on the behaviour of tourists (Ashworth & Goodall 1988; Mansfeld, 1992. Cooper, Fletcher, Gilbert & Wanhill, 1993).
Image will influence a tourist's decision of choosing a destination or a trip, the subsequent evaluation of that trip and his/her future decisions.
Thus this study was conducted to examine the relationship between destination image and tourist behaviour, on the one hand, and between image and the post consumption evaluation of stay on the other. Decision to return and desire to recommend the destination were considered as behavioural variables and "perceived quality" for the trip and for the whole destination and “satisfaction” were the evaluative variables. Moreover, the relationship between promotion tools and Image and between these and the behavioural variables were also examined. Besides, the relationship between perceived quality and satisfaction and between these and the behavioural variables was examined. All the relationships were tested using a structural equation model. The empirical investigation was examined in two major tourism towns in Egypt, Cairo representing cultural tourism and Hurghada indicating recreation tourism.
STUDY HYPOTHESES
The following two hypotheses were postulated:
2. There is a direct causative effect of mental image, tourist service marketing, quality of tourist service and quality of tourist experience, as independent variables on satisfaction about tourist visit, willingness of tourists to come back and their recommendation to others to visit Egypt, as dependent variables, within the context of cultural tourism in Egypt.
Image
Image has been proven to be a pivotal factor in travellers’ decision process and destination selection behaviour (Gartner, 1993; Goodrich, 1978; Woodside & Lysonski, 1989; Um & Crompton, 1990, Calantone et al., 1989; Court and Lupton, 1997; Echtner & Ritchie, 1993; Gartner & Hunt 1987; Good rich, 1977, Milman & Pizam, 1995, Chen & Hsu, 2000).
Tourism image is defined by many authors as an individual's overall perception or total set of impressions of a place (Fakeye & Crompton, 1991; Hunt, 1975, Phelps, 1986), others defined it as the mental portrayal of a destination (Alhemoud & Armstrong, 1996; Crompton, 1979, Kotler, Haider & Rein, 1993; Middleton, 1994, Milman & Pizam, 1995, Seaton & Benett, 1996). Gunn (1972) first articulated that tourist’s destination image is distinguished by two dimensions (1) organic image which deals with tourist’s impression of a destination without physically having visited the place, and (2) induced image which is forged through promotional materials or actual visitation.
Fakeye and Crompton (1991), applying Gunn's theory, augmented the categorization by listing three factors: organic, induced, and complex. Gartner (1993), in his study of the image formation process subdivided tourists’ image into eight domains, which included Overt Induced I, Overt Induced II, Covert Induced I, Covert Induced II, Autonomous, unsolicited organic, Solicited Organic, and Organic. All the relationships are tested jointly using a structural equation model.
To assess the magnitude of tourists’ image of places (e.g.) cities, states, and countries, two sets of attributes in regard to designative and evaluative images have been used frequently by researchers (Baloglu & Brinberg, 1997; Walmsley & Jenkins, 1992; Walmsley & Young, 1998).
Post purchase behaviour
Many authors in marketing has pointed out that there is a positive relationship between perceived quality and intentions after the purchase (Boulding et al., 1993; Cronin & Taylor, 1992; Keaveney, 1995, Ruyter De, Wetzels & Bloemer, 1996; Zeithmal et al., 1996; Zeithaml, 2000).
It seems reasonable that Satisfaction has a positive influence on post-purchase behaviour (Anderson & Sullivan, 1990; Cronin & Taylor, 1992, Fornell, 1992; Keaveney, 1995; Oliver, 1980, Oliver & Swan, 1989).
Appiah-Adu et al. (2000) stated that the greater satisfaction the more likely it is that the tourist will return to the destination and recommend it.
Customer loyalty measures how likely customers are to return and their willingness to perform partner shipping activities for the organization (Kotler et al., 2006).
Besides, beyond the market positioning studies, tourist image attributes were in corporate into behavioural research cent rating on the relationship between tourist image and other types of behaviours. Chen and HSU (2000) found that tourists’ cognitive image of travel destinations influenced their choice behaviours.
Tourists’ behaviour can be expected to be partly conditioned by the image that they have of destinations (Bigné et al., 2001). This influence begins at the stage of choosing the holiday destination, so holiday choice cannot be explained exclusively in terms of the objective environment (Johnson & Thomas, 1992). The influence of tourism image on the choice of holiday destination has been considered by various authors in decision models (Crompton & Ankomah, 1993; Kent, 1990; Mathieson & Wall, 1982; Moutinho, 1987; Schmoll, 1977; Stabler, 1990).
The influence of image does not only affect selecting the destination, but also affects the behaviour of tourists in general (Ashworth & Goodall, 1988; Bordas & Rubio, 1993; Cooper et al., 1993; Mansfeld, 1992).
Satisfaction versus quality
The variables relating to the evaluation of the stay used in this study are perceived quality and satisfaction.
As Oliver (1993) points out, the word ‘satisfaction’ comes from the Latin satis (enough) and facere (to do or to make). Thus the original meaning of satisfaction is linked to an adequacy construct.
According to zeithmal and Bitner (2003), “satisfaction is the consumer fulfilment response. It is a judgment that a product or service feature, or the product or service itself, provide a pleasurable level of consumption - related fulfilment”.
Giese and cote (2000), pointed out conceptual and operational definitions for consumer satisfaction. These definitions included three components which are (1) consumer satisfaction is a response, an emotional or cognitive judgment (the emotional response predominating); (2) the response refers to a specific focus (the object of the consumer satisfaction); (3) the response is linked to a particular moment (prior to purchase, after purchase, after consumption, etc.). Besides, consumer satisfaction is distinguished from overall satisfaction with individual attributes. Attribute-specific satisfaction is not the only antecedent of overall satisfaction (Spreng, Mankenzie, & Olshavsky, 1996). According to Fornell (1992) & Gnoth (1994), overall satisfaction is a much broader concept implying holistic evaluation after purchase, and not the sum of the individual assessments of each attribute.
Satisfying the consumer in tourism is important for three main reasons (Swarbrooke&Horner, 1999).
It leads to positive word- of – mouth recommendation of the product to friends and relatives, which in turn brings in new customers.
Creating repeat customer by satisfying them with their first use of the product brings a steady source of income with no need for extra marketing expenditure.
Dealing with complaints is expensive, time – consuming and bad for the organization’s reputation. Furthermore, it can bring direct costs through compensation payments.
situational (e.g., the weather) or personal (e.g., personal expectations) (Alexandries et al., 2004). A number of studies in the services marketing literature have reported that these two constructs are strongly related (Alexandris et al., 2001; Caruana, 2002; Cronin & Taylor, 1992; Spreng & Chiou, 2002; Spreng and Mckoy, 1996; Woodside et al., 1989). Some authors suggested a set of differences between service quality and customer satisfaction such as the expectations referred to in each case is different. On one hand satisfaction expectations are interpreted as predictions; on the other hand, quality expectation are interpreted as wishes or an ideal result. Besides, Oliver (1997) stated that service quality expectations are based on perceptions of excellence, whereas expectations of satisfaction refer to need or equity. Oliver (1997) added that service quality judgments are more specific referring to particular attributes, while customer satisfaction judgments are more holistic. Another two differences between satisfaction and quality pointed out by Anderson, Fornell and Lehmann (1994) that in order to determine a customer’s satisfaction, the tourist must have visited the destination this is not necessary in order to evaluate quality. The last difference is that satisfaction depends on price but quality does not.
Perceived quality will in turn determine the satisfaction of consumers (Fornell, Johnson, Anderson, Cha, & Bryant, 1996), because the latter is the result of the assessment by the customer of the perceived quality (Anderson et al., 1994; Gnoth, 1994; Kotler et al., 1996).
Parasuramen et al. (1985, 1988) pointed out that perceived quality is a comparison between expectations and the performance perceived by the consumer. Parasurman et al. (1988) added that, quality is the overall judgement made by the consumer regarding the excellence of a service. Moreover, it is a type of attitude, related but not equivalent to satisfaction, which is described as the degree and direction of the discrepancies between the perceptions of the performance and the consumer's expectations of the service.
disconfirmation model, whereas some authors have stated that there are situations where perceived performance can be used as a good approach to consumer satisfaction and to service quality as well.
Kozak and Rimmington (2000) in their articles studied customer satisfaction; they concerned different fields in the tourism industry such as travel agencies, tour guides, specific tours, hotels, restaurants, recreation facilities and destinations. In tourism, Appliah – Adu, Fyall, and Singh (2000); Heung and Cheng (2000) and Kozak and Rimmington (2000) suggested that perceived quality is antecedent of satisfaction. Besides, they mention some studies measured tourist’s satisfaction in specific destinations using different approaches.
In this research, tourists evaluated perceived quality and satisfaction referring to their evaluation of the holiday experience including the tour and the destination. Both are based on post purchase judgements of the stay. The researcher focused on overall evaluation for satisfaction. On the other hand, she focused on analyzing the individual components of the construct to evaluate quality of the trip or of the whole destination.
Tourism Image, quality and satisfaction
Tourism image exercises a positive influence on perceived quality and satisfaction because it moulds the expectations that the individual forms before the visit, and these variable depends on the comparison of such expectations with experience (Font, 1997; Phelps, 1986, Grönroos, 1984). Moreover, the evaluation of the experience at the destination will also affect the image and modify it. (Chon, 1991; Echtner & Richie, 1991; Fakey & Crompton, 1991; Ross, 1993).
The following sequence was considered by kotler, Bowen, and Makens (1996): Image quality satisfaction post purchase behaviour. Additionally the Nordic school of service quality reflects the idea in the Image model, this model considers that the quality perceived by the consumer is influenced by three-factors which are: technical quality, functional quality, and corporate image (Grönroos, 1990).
METHODOLOGY
The purpose of this study is to clarify the interrelationships among destination image, perceived quality, satisfaction, promotional tools, intention to return and willingness to recommend the destination. In order to accomplish this main objective, the two hypotheses will be tested.
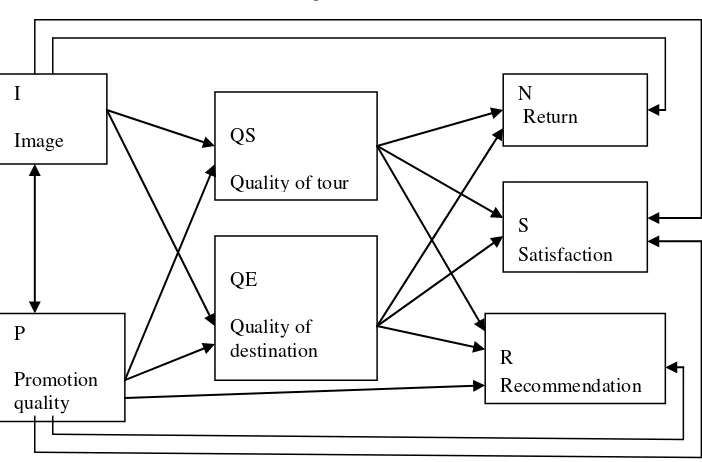
[image:9.420.45.396.207.438.2]Path analysis was used to study the causal relationships among variables. This approach allows the analysis of relations between independent and dependent variables. The following diagram illustrates the proposed interaction model.
Figure 1.
Both “Image “ and “Promotion “ may affect the perceived quality of tour and quality of destination, as well as willingness to return , satisfaction and recommending tourism in Egypt to others.
Study sample and data collection
The field study was carried out in two important Egyptian tourist cities. The study sample included two basic groups:
N Return
S
Satisfaction
R
Recommendation QS
Quality of tour
QE
Quality of destination I
Image
P
1) Group I of 180 tourists at Hurghada city. 2) Group II of 178 tourists in Cairo city.
The first group represented tourism in Hurghada, whereas the second one represented tourism in Cairo. The data were gathered during December 2005 and January 2006. The questionnaire was administered personally to the respondents. The survey sites were chosen at random at five star hotels in both cities. The questionnaire included asking for descriptive data including: age, gender, marital status, education level, annual income, purpose of visit, country of origin, occupation, and household size.
Questionnaire design and operationalisation of constructs
The questionnaire was distributed in both destinations. It included seven questions concentrate on socio-demographic properties of the respondents. opinion of the quality of the tour; overall image and quality , respondents perceptions and expectations, evaluation the promotion tools, willingness to revisit and return, and intention to recommend the destination to others.
Variables of the study
The study includes seven variables which are: Promotion quality.
Image.
Quality of tour. Quality of destination. Intention to return.
Willingness to recommend the destination. Satisfaction.
Operationalisation of Promotion
Operationalisation of Image
Most researches of destination image have used either a multiattribute test (Echtner & Ritchie, 1991, 1993). And non-structured techniques. In this study, image was measured by using the multi-attribute method; image is assessed by means of a Likert scale or a semantic differential scale. The responses can range from very unfavourable (1) to highly favourable (5). The attributes included standard hygiene and cleanliness, personal safety, infrastructure, entertainments, appealing local foods, friendly people unpolluted environment, good value of money, good climate, the availability of tourism information, low trip cost, and inexpensive goods and services. Baloglu and Mc clearly (1999) measured overall destination image by means of a single- item rating scale. The purpose of their study being to test a model of destination image formation using path analysis .In this research, the overall score for image was the mean of scores for different items. Path analysis was conducted to study the causal relationships among different variables by proposing an interaction model as well.
Operationalisation of quality
Asking for quality was divided into two sections:
Quality of the tour contains asking for: meet & assist and transfer, domestic transportation, comfort ability, driver, traffic, park places, punctuality, tourist programs, guidance, interesting cultural attractions, interesting historical attractions, beautiful scenery and accommodation.
Quality of the whole experience (the destination) includes: standard hygiene and cleanliness, personal safety, quality of infrastructure, good entertainment, appealing local food, friendly people, unpolluted environment, good value of money, good climate, the availability of tourism information, low trip cost and inexpensive goods and services.
Quality of the tour and the destination were measured by asking respondents about their opinion for the quality of these attributes post-visit using likert scale. The responses can range from very unfavourable (1) to highly favourable (5).
Operationalisation of satisfaction
Satisfaction may be measured by multi-item scales or by using a single measure of overall satisfaction. In this study, the researcher evaluated overall satisfaction. The tourist’s satisfaction with the holiday experience, was tested by a single – item five point rating scale by asking the guest ‘How would you evaluate your trip, unsatisfactory at all= 1 to very satisfactory=5. Most authors have used a single measure of overall satisfaction (Fornell et al., 1996; Bloemer & Ruyter, 1998; Bolton &Lemon, 1999).
Operationalisation of behavioural variables
Willingness to return and to recommend the destination to others were measured by using a single five – point rating question for each, like Bigné et al.(2001) &Boulding et al.(1993). The respondents were asked if they would return and recommend it to others, responses were rated from surely yes (1) to surely no (5).
RESULTS AND DISCUSSION
Demographic factors
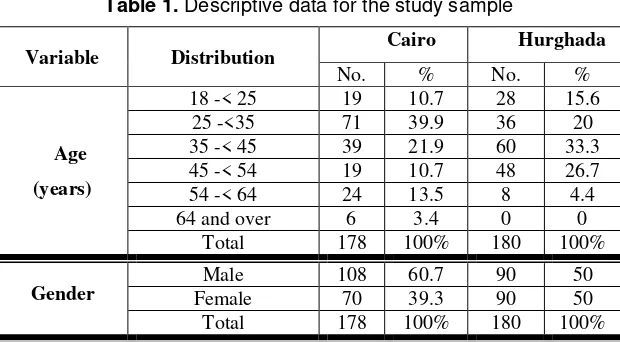
[image:12.420.57.367.372.543.2]Table (1) shows the descriptive data for both groups.
Table 1. Descriptive data for the study sample
Hurghada Cairo 0B Distribution Variable % No. % No. 15.6 28 10.7 19
18 -< 25
Age (years) 20 36 39.9 71 25 -<35 33.3 60 21.9 39
35 -< 45
26.7 48
10.7 19
45 -< 54
4.4 8
13.5 24
54 -< 64
0 0
3.4 6
64 and over
100% 180 100% 178 Total 50 90 60.7 108 Male 4B
Gender Female 70 39.3 90 50
100% 180
100% 178
35.6 64 36 64 Single Marital status 63.3 114 59 105 Married 1.1 2 1.7 3 Divorced - - 3.4 6 Separated 100 180 100 178 Total 60 108 20.8 37
High school or less
Education level 34.4 62 30.9 55 Intermediate College 5.6 10 48.3 86 University 100% 180 100% 178 Total 48.9 88 10.7 19
Under 25.000 $
Annual income 30 54 9 16 25.000-<34.000 $ 7.8 14 20.8 37 34.000-<49.000 $ 7.8 14 25.3 45 49.000-<75.000$ 3.3 6 21.3 38 75.000-<100.000$ 2.2 4 12.9 23
100.000 $ and over
100% 180 100% 178 Total 68.9 124 32 57 Recreation 5B Purpose of Visit 17.8 32 32.6 58 Cultural visit 11.1 20 15.2 27 Sports - 0 2.2 4 Conference and Meetings 1.1 2 6.7 12 Therapeutic visit 1.1 2 11.2 20 Others 100% 180 100% 178 Total 2.2 140 34.8 62 Italy 6B Country of Origin 77.8 4 33.1 59 Germany 17.8 32 2.2 4 Russia 2.2 4 29.9 53 Others 100% 180 100% 178 Total 11.1 20 11.8 21 Student Occupation 2.2 4 1.1 2 Housewife 14.4 26 1.7 3 Skilled worker 36.7 66 7.3 13 Semi-skilled worker 4.4 8 4.5 8 Clerical worker 7.8 14 1.7 3 Self-employed worker 4.4 8 15.7 28 Professional 12.2 22 9 16
- - 3.9 7 Retired - - 0.6 1 Unemployed 7.6 12 42.7 76 Others 100 180 100 178 Total 27.8 50 23 41 One Person 7B Household Size 7.8 14 32.6 58 Two Persons 31.1 56 21.9 39 Three Persons 32.3 85 19.7 35 Four Persons 1.1 2 2.8 5 Five Persons 100% 180 100% 178 Total 62.2 112 65.2 116 First 8B Visiting
frequency Repeated 62 34.8 68 37.8
100% 180 100% 178 Total
The majority of respondents’ tourists are married in both Cairo and Hurghada. The educational level of respondents in Cairo was higher compared with those in Hurghada. In Cairo, the largest category was university graduates (48.3%), whereas the majority or Hurghada’s tourists (60%) were high school or less.
The Largest age group of tourists were from (25-<35) in Cairo, and from (35- 45 years) in Hurghada. For annual income the largest group of respondents were belonging to low income in Hurghada (below 25.000$), whereas in Cairo the largest group had higher income, (49.000-<75000$). Gender of the respondents was almost evenly distributed between males and females in Hurghada; on the other hand males are more frequent (60.7%) in Cairo sample. Purpose of visit in Cairo is distributed mainly between cultural visit (32.6%) and recreation (32%) , whereas , in Hurghada, recreation occupied the first rank (68.9%).Tourists from Germany (34.8%) and from Italy (33.1%) were the majority in Cairo , In Hurghada, the majority was from Germany (77.8%). Unskilled workers occupied the first rank in Hurghada (36.7), whereas professionals occupied the second rank in Cairo (15.7%).
The majority of respondents for the household size were two persons in Cairo (32.6%), whereas it was four persons (32.3%) in Hurghada.
Hypotheses Testing
To test the truth of the two study hypotheses, the Path analysis method was adopted, using LISREL 8 program. Correlation coefficients were also used to determine their significance
Studying the First Hypothesis
[image:15.420.57.367.218.355.2]For the first hypothesis, the correlation coefficients among the seven chosen adopted coefficients were calculated by the researcher.
Table 2. Matrix of Correlation Coefficients in Hurghada
Promoti on Quality of Destinat ion Quali ty of Tour Ima ge Satisfact ion Recommend ation Retu rn Variable 0.21 0.44 0.51 0.47 0.94 0.83 1.00 Return 0.31 0.27 0.30 0.39 0.72 1.00 - Recommend ation 0.15 0.40 0.53 0.49 1.00 - - Satisfaction 0.33 0.12 0.26 1.00 - - - Image 0.31 0.83 1.00 - - - - Quality of tour 0.25 1.00 - - - - - Quality of Destination 1.00 - - - - - - Promotion
The result of the correlation matrix was as follows:
The correlation Matrix derived from the above table was used to develop a diagram showing the relationships between the study variables and the significance of correlation coefficients among study variables to measure the significance of differences, the Student t test was used. The significance level was set at p ‹ 0.05, Corresponding to a T-test value of 1.96.
1. The Image score was significantly correlated with Return, Satisfaction and Recommendation scores. On the other hand, it was not significantly correlated with: Quality of tour and Quality of Destination scores.
significantly correlated with Return, Satisfaction and Recommendation scores.
3. The Quality of Tour score was significantly correlated with Return and Satisfaction scores. On the other hand, it was not significantly correlated with Recommendation scores.
This result may refer to the fact that visiting Hurghada means enjoying the Red Sea and the sun with some water sports, in the tourist resorts regardless tours or destinations. This means that Hurghada tours means joining a package almost by charter flight including accommodation and meals arrangements which is all needed , on the contrary , Cairo means joining a tour including sightseeing and entertainment which are more expensive and needs higher education levels for visiting different attractions.
In Hurghada, it is clear that, in order to a chive the loyalty of a tourist, image is very important. This result was concluded by Bigné et al. (2001), who pointed out that, destination image plays an essential role and the relationship with the tourist must be handled proactively to develop it into a lasting relationship beneficial to both parties.
Thus, tourism organizations must pay much more attention to Hurghada’s image, promotion campaigns and the quality of destination as these factors affect tourists’ satisfaction, intention to return and willingness to recommend Hurghada to others.
Thus, the strength of the model has been proved and the first hypothesis has been proved to be true with regard to certain relationships.
1. The Quality of Destination score was not significantly correlated with Return, Satisfaction and Recommendation scores.
Image → Return Promotion →Quality of tour Image → Satisfaction Promotion→ Quality of destination Image → Recommendation
Quality of Destination→ Return
Quality of Destination→ Satisfaction Path coefficients and their significance was determined using LISREL 8 program as shown in figure (2). If we compare these results with Kotler et al. (1996): Image → Quality → Satisfaction →Post purchase behaviour.
tour and quality of the destination has been proved obviously, but definite conclusions cannot be drawn for the satisfaction, the willingness to recommend the destination or the desire to return for recreational tourism whereas, for cultural tourism promotion tools affect quality of destination, but have no effects on willingness to return, satisfaction, recommendation or quality of the tour. Quality of destination is a determinant of satisfaction and return. On the contrast, Quality of destination is not a determinant of recommendation for recreational tourism. For cultural tourism, quality of destination has no effects on willingness to return, satisfaction or recommendation. Bigné et al. (2001) stated in their research that quality would affect the satisfaction and recommendation as well.
Quality of the tour does not influence willingness to return, satisfaction, or recommendation for recreational tourism. On the other hand, quality of the tour influences satisfaction, but has no effects on willingness to return, and recommendation for cultural tourism.
Figure 2. Path Analysis for tourism in Cairo
N.B.:
N Return
S
Satisfaction
R
Recommendation
QS
Quality of tour
QE
Quality of destination
I Image
P
* The t value was considered significant at p < 0.05 if exceeding 1.96 (irrespective of + or –signs).
*Values between parentheses are calculated path coefficients.
*Values outside parentheses are t values corresponding to path coefficients *path is statistically significant at p < 0.05.
[image:18.420.54.369.191.535.2]From the above model, path correlation coefficients and their significance were determined as shown in Table (3) below:
Table 3. Path analysis values of Hurghada
t Path coefficient value Effect Not significant at p < 0.05
1.67 0.18
Image → Quality of tour
Not significant at p < 0.05
0.35 0.38
Image → Quality of destination
significant at p < 0.05
√ *
4.68 0.41
Image → Return
significant at p < 0.05
√ *
4.31 0.39
9B
Image → Satisfaction
significant at p < 0.05
√ *
3.04 0.31
Image→Recommendation
significant at p < 0.05
√ *
2.32 0.25
Promotion → Quality of tour
significant at p < 0.05
√ *
2.2 0.24
Promotion → Quality of destination
Not significant at p < 0.05
-1.34 0.12
Promotion → Return
Not significant at p < 0.05 -0.56
0.05
10B
Promotion → Satisfaction
Not significant at p < 0.05 1.39
0.15 Promotion→Recommendation
significant at p < 0.05
√ *
5.22 0.45
Quality of tour → Return
significant at p < 0.05
√ *
3.31 0.30
11B
Quality of tour → Satisfaction
Not significant at p < 0.05 0.43
13B
0.04 Quality of tour→Recommendation
Not significant at p < 0.05 0.03
0.002 Quality of destination → Return
Not significant at p < 0.05 1.85
0.16
12B
Quality of destination → Satisfaction
Not significant at p < 0.05 1.63
It is noteworthy that the goodness of fit criteria, were achieved for the model, showing its power to explain the causative relation between the included variables. Thus
1. The X² value for goodness of fit index was 353.26(statistically significant at p < 0.01).
2. The Roots Means Square Residual (RMSR) value was 0.025. Its value could vary between 0 and 1, the nearer it is to zero value, the better would be the fit of the model to sample data.
3. The goodness of fit index (GDI) value was 0.57. Its value could vary between 0 and 1. The nearer it is to 1, the better would be the fit of the model to sample data.
Studying the second hypothesis
For the second Hypothesis the correlation coefficients among the seven chosen adopted coefficients were calculated by the researcher.
Variables of the study
The study included seven variables which are: 1. Promotion tools.
2. Image.
3. Quality of tour. 4. Quality of destination. 5. Intention to return.
6. Willingness to recommend the destination. 7. Satisfaction.
The result of the correlation matrix was as follows:
[image:19.420.25.403.443.547.2]A correlation matrix for all independent and dependent studied variables was established (Table 4)
Table 4. Matrix of Correlation Coefficient in Cairo
Promotion Quality of destination Quality of tour Image Return Recommendation Satisfaction Variable 0.02 0.12 0.08 0.24 0.73 0.28 1.00 Return 0.15 0.14 0.10 0.23 0.39 1.00 - Recommendation 0.03 0.13 0.09 0.22 1.00 - - Satisfaction 0.08 0.38 0.24 1.00 - - - Image 0.23 0.26 1.00 - - - - Quality of tour
1.00 -
- - - -
- Promotion
The correlation Matrix derived from the above table was used to develop a diagram showing the relationships between the study variables and the significance of correlation coefficient to among study variables to measure the significance of differences, the Student t test was used. The significance level was set at p ‹ 0.05, Cassesranding to a T-test value of 1.96. It was found that:
1. The Image score was significantly correlated with quality of tour and quality of destination scores; on the other hand, it was not significantly correlated with return, satisfaction and recommendation scores
.
2. The Promotion score was significantly correlated with quality of destination, on the other hand, it was not significantly correlated with return, satisfaction, recommendation and quality of tour score.
3. The Quality of tour score was significantly correlated with satisfaction, on the other hand, it was not significant with return and recommendation scores.
4. The Quality of destination score was not significantly correlated with return, satisfaction and recommendation scores.
The structural equation model confirms the following causal relationships
Cultural tourism Recreation tourism
Image→ Quality of tour Image →Quality of destination Promotion → Quality of destination
Quality of tour →Satisfaction
Image → Return Image → Satisfaction Image → Recommendation
Promotion →Quality of tour
Promotion→ Quality of destination Quality of destination→
Return
Quality of destination→ Satisfaction
Figure 3. Path Analysis for tourism in Hurghada
N.B.:
*Values between parentheses are calculated path coefficients.
*Values outside parentheses are t values corresponding to path coefficients *means that the path is statistically significant at p < 0.05.
From the above model ,path correlation coefficients and their significance were determined as shown in table (5) below: The t value was considered significant at p < 0.05 if exceeding 1.96 (irrespective of + or –signs).
N Return
S
Satisfaction
R
Recommendation
QS
Quality of tour
QE
Quality of destination
I Image
P
Table 5. Path analysis value of Cairo
Effect
Path coefficient
value
t
14B
Significance
Image → Quality of tour 0.38 √ * 3.85 significant at p < 0.05 Image → Quality of destination 0.26 √ * 2.54 significant at p < 0.05
Image → Return 0.05 0.43 Not significant at p < 0.05
Image → Satisfaction 0.03 0.28 Not significant at p < 0.05
Image→Recommendation 0.06 0.57 Not significant at p < 0.05
Promotion → Quality of tour 0.07 0.80 Not significant at p < 0.05 Promotion → Quality of destination 0.23 √ * 2.28 significant at p < 0.05
Promotion → Return 0.008 0.08 Not significant at p < 0.05
Promotion → Satisfaction 0.002 0.02 Not significant at p < 0.05
Promotion→Recommendation 0.13 1.2 Not significant at p < 0.05
Quality of tour → Return 0.20 1.74 Not significant at p < 0.05
Quality of tour → Satisfaction 0.23 √ * 2.02 significant at p < 0.05
Quality of tour→Recommendation 0.19 1.69 Not significant at p < 0.05
Quality of destination → Return 0.02 0.21 Not significant at p < 0.05
Quality of destination → Satisfaction 0.01 0.15 Not significant at p < 0.05 Quality of destination →Recommendation 0.01 0.12 Not significant at p < 0.05
It is noteworthy, that the goodness of fit criteria, were achieved for the model, showing its power to explain the causative relation between included variables. Thus:
1. The X² value for goodness of fit index was 63.77(statistically significant at p < 0.01).
2. The Roots Means Square Residual (RMSR) value was 0.15. Its value could vary between 0 and 1, the nearer it is to zero value, the better would be the fit of the model to sample data.
3. The goodness of fit index (GDI) value was 0.83. Its value could vary between 0 and 1. The nearer it is to 1, the better would be the fit of the model to sample data.
Thus, the strength of the model has been proved and the second hypothesis has been proved to be true with regard to certain relationships.
Bigné et al (2001) confirmed the following causal relationships: Image→ Quality Quality →Satisfaction
Image → Recommendation Satisfaction→Recommendation Image → Return
In Cairo, it seems to be a special trip to the tourist including its tours for visiting pyramids, Sphinx, Sakkara, Coptic and Moslem monuments.
Thus, Quality of tour, by which includes: sightseeing, Transfers, accommodation transportation, etc. leads to Satisfaction. Return was not affected by quality of tour or any other factors, it may be because Cairo is full of monuments of different eras so when one visits it once, he does not need to visit it again, but he prefers to watch other civilizations. Sirakay, Mclellan &uysal (1996) agree with this result, they pointed out that tourists may seek variety or be availability. Thus, the quality of tour or destination does not guarantee their return. Moreover, quality of the tour as well as quality of the destination do not influence the intention to return more the willingness to recommend the city to others , Thus, marketers of Cairo , particularly national tourism offices(NTOs) must take special intention in verifying the willingness to recommend and intention to return as well as satisfaction.
In Cairo the most significant causal relationship was gained between image and quality of tour. This result refers to that Cairo consists of many historic sightseeing.
This result approved by Baloglu and Mangaloglu (2001) in their research concerning tourism destination images of Turkey, Egypt, Greece, and Italy as perceived by tour operators pointed out that the first rank for Egypt image was given to Historic ancient ruins, archaeology , old. Baloglu (1997 ab) , after investigating US travellers’ perceptions of the same Mediterranean tourist destinations , suggested that tour operators and travel agents operating in US market should be encouraged to develop and sell alternative and specialized tours that would help these destinations preserve the heritage attractions and create a more favourable perception.
Consequently, the model outlined in the conceptual framework is confirmed for the most part.
CONCLUSION
influence on satisfaction and willingness to return, its influence on willingness to recommend the destination did not satisfactorily proved .On the other hand, perceived quality of the destination affects willingness to return and Satisfaction. This result indicates that the quality of the destination in recreation tourism is more effective than the quality of the tour. With regard to the sequence: image → quality → satisfaction → post purchase behaviour suggested by the review of the literature, the analysis of the interrelationships as a whole confirms this model to a large extent , although satisfaction does not affect behavioural variables. Furthermore these results approved the suggested matrix by the present study regardless of the relationship between the quality of the whole experience and behavioural variables. Besides, promotional tools affect perceived quality of destination & quality of the tour, but it does not affect the willingness to return, to recommend the destination or satisfaction
.
For cultural tourism in Cairo, image affects the quality of both the tour and the whole trip. On the contrary, image does not affect willingness to return, satisfaction, or recommendation to visit the destination. Furthermore, quality of tour affects satisfaction, but does not affect willingness to return or recommendation and promotional tools affect quality of the destination.
The findings should be interpreted under several limitations. The sample population of this study was chosen randomly among tourists who were visiting Cairo and Hurghada in a specific time of the year. Despite the practical significant of the sample, there may be other tourists visiting these destinations and their perceptions may differ from those included in this study. Second, the sample size was small. Thus, the findings can not be generalizable over all tourists who are visiting Cairo and Hurghada.
Further researches may focus on a larger sample including tourists who visited these destinations more than one time. This would provide valuable remarks on the Causal relationships between behavioural variables consisting loyality including willingness to return, intention to recommend and other variables.
Similarly, tourists in different cities in Egypt such as Luxor, Aswan, and Sharm Elsheikh should also be surveyed to get a boarder picture for the international image of these cities.
Alexandris, K., Dimitriatdis, D. & Kasiara, A. (2001). Behavioural consequences of perceived service quality: An exploratory study in the context of private fitness clubs in Greece. European Sport Management Quarterly, Vol. 1, pp. 251-280.
Alhemoud, A.M. & Armstrong, E. G. (1996). Image of tourism attractions in Kuwait. Journal of Travel Research, Vol. 34, No. 4, pp. 67-80.
Anderson, E. W. & Sullivan, M. W. (1990). Customer satisfaction and retention across firms. In Zeithaml, Berry & Parasuraman (Eds.), Paper Presented at TIMS College of marketing special interest conference on service marketing Nashville, T. N. September, 1996.
Anderson, E. W., Fornell, C. & Lehmann, D. (1994). Customer satisfaction. Market share and profitability: findings from Sweden. Journal of Marketing, Vol. 58, pp. 53-66.
Andreasen, A. R. (1984). Life status changes and changes in consumer preferences and satisfaction. Journal of Consumer Research, Vol. II, pp. 784-794.
Appiah-Adu, K., Fyall, A., & Singh, S. (2000). Marketing culture and customers retention in the tourism industry. The Service Industries Journal, Vol. 20, No. 2, pp. 95-113.
Ashworth, G. & Goodall, B. (1988). Tourist images: marketing considerations. In B. Goodall, & G. Ashworth (Eds.), Marketing in the tourism industry the promotion of destination regions (pp.213-238). London: Rout ledge. Baloglu, S. (1997a). The Relationship between destination images and
sociodemographic and trip characteristics of international travellers.
Journal of Vacation Marketing, Vol. 3, No. 3, pp. 221-233.
Baloglu, S. (2001). Image variations of Turkey by familiarity index: informational and experiential dimensions. Tourism Management, Vol. 22, pp. 127-133. Baloglu, S. & Brinberg, D. (1997). Affective images of tourism destinations.
Journal of Travel Research, Vol. 35, No. 4, pp. 11-15.
Baloglu , S. & Mangaloglu, M. (2001). Tourism destination images of Turkey, Egypt, Greece, and Italy as perceived by Us- based tour operators and travel agents. Tourism Management, Vol. 22, pp. 1-9.
Baloglu, S. & McCleary, K. W. (1999). A model of destination image formation.
Annals of Tourism Research, Vol. 26, No. 4, pp. 868-897.
Bigné, E. (1997). Perspectivas Actuales de la Investigación Contenido del Marketing: Bases de Futuro. XI Congreso Nacional y VII Congreso Hispano- Francés. Asociación Europea de Dirección y Economia de la Empresa, L1eida, pp. 69-80.
Bigné, E., Sanchez, I., & Snchz J. (2001), Tourism image, evaluation variables and after purchase behaviour: inter relationship. Tourism Management PERGAMON, Vol. 22, pp. 607-616.
Bolton, R. N. & Lemon, K. N. (1999). A dynamic model of customers’ usage of services: usage as an antecedent and consequence of satisfaction. Journal of Marketing Research, Vol.36, No.2, pp.171-186.
Bordas, E. & Rubio, M. L. (1993). La Imagen Turistica de España: Un Modelo de Gestión a Largo Plazo. Información aComercial Española, Vol. 722, pp. 107-118.
Boulding, W., Kalra, A., Staelin, R. & Zeithaml, V. A. (1993). A dynamic process model of service quality: from expectations to behavioural intentions.
Journal of Marketing Research, Vol. 30, pp. 7-27.
Calantone , R. J., di Benedetto, C. A., Hakam, A. & Bojanic, D. C. (1989). Multiple multinational tourism positioning using correspondence analysis. Journal of travel Research, Vol. 28, No. 2, pp. 25-32.
Carman, J. M. (1990). Consumer perceptions of service quality: an assessment of the SERVQUAL dimensions. Journal of Retailing, Vol. 66, No. 1, pp. 33-55.
Caruana, A. (2002), the effects of service quality and the mediating role of customer satisfaction. European Journal of Marketing, Vol. 36, No. 7, pp. 1-14.
Chen, J. S. & Hsu, C. H. C. (2000). Measurement of Korean tourists’ perceived images of overseas destinations. Journal of Travel Research, Vol.38, No.4, pp.410-415.
Chon, K. (1991), Tourism destination image modification process. Marketing implications. Tourism Management, Vol. 12, No. 1, pp. 68-72.
Churchill, G. A. & Suprenant, C. (1982), an investigation into the determinants of customer satisfaction. Journal of Marketing Research, Vol. 19, pp. 491-504.
Cooper, C., Fletcher, J., Gilbert, D. & Wanhill, S. (1993). Tourism Principles & practice. UK: Pitman Publishing.
Court, B. & Lupton, R. A. (1997). Customer portfolio development: modelling destination adopters, in actives and rejecters. Journal of Travel Research,
Vol. 36, No. 1, pp. 35-43.
Crompton, J. L. (1979). An assessment of the image of Mexico as a vacation destination and the influence of geographical location upon that image.
Journal of Travel Research, Vol. 17, pp. 18-23.
Crompton, J. L. & Ankomah, P. K. (1993). Choice set propositions in destination decisions. Annals of Tourism Research, Vol. 20, pp. 461-476.
Crompton, J., Mackay, K. & Fesenmaier, D. (1991). Identifying dimensions of service quality in public recreation. Journal of Park and Recreation Administration, Vol. 9, pp. 15-27.
Cronin, J. & Taylor, S. (1992). Measuring service quality: a re-examination and extension. Journal of Marketing, Vol. 56, pp. 55-68.
Cronin, J. J. & Taylor, S. A. (1992). Measuring service quality: a re-examination and extension. Journal of Marketing, Vol. 56, pp. 55-68.
Crosby, L. A. & Taylor, J. R. (1982). Consumer satisfaction with Michigan’s container deposit law: an ecological perspective. Journal of Marketing,
De Ruyter, K., Wetzels, M. & Bloemer, J. (1996). On the relationship between perceived service quality and behavioural intentions. Paper Presented at the 25th European marketing academy conference. Budapest, pp. 273-292. De Ruyter, K., Wetzels, M. & Bloemer, J. M. N. On the relationship between
perceived service quality and behavioural intentions: a cross-sectional perspective, Paper Presented at EMAC-conference. Budapest, pp. 273-312, 1255-1270.
Echtner, C. M. & Ritchie, J. R. B. (1991). The meaning and measurement of destination image. The Journal of Tourism Studies, Vol. 2, No. 2, pp. 2-12. Echtner, C. & Ritchie, M. B. (1993). The measurement of destination image: An
empirical assessment. Journal of Travel Research, Vol. 22, No. 4, pp. 3-13.
Echtner, C. & Ritchie, M. B. (1993). The measurement of destination image: An empirical assessment. Journal of Travel Research, Vol. 31, No. 4, pp. 3-13.
Fakeye, P. & Crompton. (1991). Image differences between prospective, first- time, and repeat visitors to the lower Rio Grande valley. Journal of Travel Research, Vol. 29, No. 2, pp. 10-16.
Fakeye, P.C. & Crompton, J. L. (1991). Image differences between prospective, first-time and repeat visitors to the lower Rio Grande valley. Journal of Travel Research, Vol. 30, No. 2, pp. 10-16.
Font, X. (1997). Managing the tourist destination’s image. Journal of Vacation Marketing, Vol. 3, No. 2, pp. 123-131.
Fornell, C. (1992). A national customer satisfaction barometer: the Swedish experience. Journal of Marketing, Vol. 56, pp. 6-21.
Fornell, C., Johanson, M. D., Anderson, E. W., Cha, J. & Bryant, B. E. (1996). The American customer satisfaction index: nature, purpose, and findings. Journal of Marketing, Vol. 60, pp. 7-18.
Gartner, W. C. (1989). Tourism image: attribute measurement of state tourism products using multidimensional scaling techniques. Journal of Travel Research, Vol. 28, No. 2, pp. 16-20.
Gartner, W. C. (1993). Image formation process. Journal of Travel and Tourism Marketing, Vol. 2, No. 3, pp. 199-212.
Gartner, W. C. (1993). Image formation process. In M. Uysal, & D. R. Fesenmaier (Eds.), Communication and channel systems in tourism marketing (pp. 191-215). New York: The Haworth press, Inc.
Gartner, W. C., & Hunt, J. (1987). An analysis of state image change over a twelve- year period (1971-1983). Journal of Travel Research, Vol. 26, No. 2, pp. 15-19.
Giese, J. L. & Cote, J. A. (2000). Defining consumer satisfaction. Academy of
Marketing Science Review (online). Http://www.amsreview.org/amsrev/theory/giese00-01.html.
Goodall, B. (1988). How tourists choose their holidays: an analytical framework. In B. Goodall, & G. Ashworth (Eds.), Marketing in the tourism industry. The promotion of destination regions (pp. 1-17). London: Routledge. Goodrich, J. N. (1977). A new approach to image analysis through
multidimensional scaling. Journal of Travel Research, Vol. 16, No. 3, pp. 3-7.
Goodrich, J. N. (1978). The relationship between preferences for and perceptions of vacation destinations. Journal of Travel Research, Vol. 17, No. 2, pp. 8-13.
Grönroos, C. (1984). Strategic management and marketing in the service sector. Bromley Chartwell-Brat.
Grönroos, C. (1990). Service management and marketing. Managing the moments of truth in service competition. Lexington, MA: Lexington Books and MacMillan.
Gunn, C. (1972). Vacationscape.Austin. TX: Bureau of Business Research, University of Texas.
Gunn, C. (1972). Vacations cape: Designing tourist regions. Austin: Bureau of Business Research, University of Texas.
Herberlein, T. A., Linz, D. & Ortiz, B. P. (1998). Satisfaction, commitment and knowledge of customers on a mandatory participation time-of-day electricity pricing experiment. Journal of consumer Research, Vol. 9, pp. 106-114.
Heung, V. & Cheng, E. (2000). Assessing tourists’ satisfaction with shopping in the Hong Kong special administrative region of China. Journal of Travel Research, Vol.34, No.2, pp.396-404.
Hunt, J. D. (1975). Image as a factor in tourism development. Journal of Travel Research, Vol. 13, No. 3, pp. 1-7.
Hurley, R. F. & Estelami, H. (1998). Alternative indexes for monitoring customer perceptions of service quality: a comparative evaluation in a retail context.
Journal of the Academy of Marketing Science, Vol. 26, No. 3, pp. 209-221. Jonson, P. & Thomas, B. (1992). The analysis of choice and demand in tourism. In P. Johnson, & B. Thomas (Eds.), Choice and demand in tourism (pp.1-2). London: Man sell.
Keaveney, S. M. (1995). Customer switching behaviour in service industries: an exploratory study. Journal of Marketing, Vol. 59, pp. 71-82.
Kent, P. (1990). People, places and priorities: opportunity sets and consumers holiday choice. In G. Ashworth, & B. Goodall (Eds.), Marketing tourism places (pp.42-62). London: Routledge.
Kotler, O., Haider, D. H., & Rein, Y. (1993). Marketing places: Attracting investment, industry and tourism to cities, states and nations. New York: The free press.
Kotler, P., Bowen, J. & Makens, J. (1996). Marketing for hospitality and tourism. New Jersey: Prentice Hall.
Mansfeld, Y. (1992). From motivation to actual travel. Annals of Tourism Research, Vol. 19, pp. 399-419.
Mathieson, A. & Wall, G. (1982). In Cooper, Fletcher, Gilbert, & Wanhill (Eds.),
Tourism: economic.physical and social impacts. London: Longman. Middleton, V. T. C. (1994). Tourist product. In S. Witt, & L. Moutinho (Eds.),
Tourism marketing and management handbook (pp.573-576). Hempel Hempstead: Prentice-Hall.
Milman, A., & Pizam, A. (1995). The role of awareness and familiarity with a destination: the central Florida case. Journal of Travel Research, Vol. 33, No. 3, pp. 21-27.
Mountinho, L. (1987). Consumer behaviour in tourism. European Journal of Marketing, Vol. 21, No. 10, pp. 5-44.
Oliver, R. (1997). Satisfaction: A behavioural perspective on the consumer. New York: McGraw Hill.
Oliver, R. L. (1980). A cognitive model of the antecedents and consequences of satisfaction decisions. Journal of Marketing Research, Vol. 17, pp. 460-469.
Oliver, R. L. & Swan, J. E. (1989). Consumer perceptions of interpersonal equity and satisfaction in transactions: a field survey approach. Journal of Marketing, Vol. 53, pp. 21-35.
Oliver, R. L. (1993). Congnivitive, Affective and attribute Bases of the satisfaction Response. Journal of Consumer Research, Vol. 20(December), pp. 418-430.
Parasurman, A., Zeithmal, V. & Berry, L. (1985). A conceptual model of service quality and its implications for future research. Journal of Marketing, Vol. 49, pp. 41-50.
Parasuraman, A., Zeithaml, V. & Berry, L. (1988). SERVQUAL: a Multiple- item scale for measuring consumer perceptions of service quality. Journal of Retailing, Vol. 64, pp. 12-40.
Pearce, P. L. (1982). Perceived changes in holiday destinations. Annals of Tourism research, Vol. 9, No. 2, pp. 145-164.
Phelps, A. (1986). Holiday destination image –the problems of assessment: An example developed in Menorca. Tourism Management, Vol. 7, No. 3, pp. 168-180.
Reynolds, W. (1965). The Role of the consumer in image Building. California Management Review, spring, pp. 69-76.
Ross, G. F. (1993). Ideal and actual images of back packer visitors to Northern Australia. Journal of Travel Research, Vol. 32, No. 2, pp. 54-57.
Schmoll, G. A. (1977). In Cooper, Fletcher, Gilbert, & Wanhill (Eds.), Tourism promotion. London: Tourism International press.
Seaton, A. V. & Benett, M. M. (1996). Marketing tourism products. Concepts, issues, cases. London: International Thomson Business Press.
Sirakaya, E., Mclellan, R. W. & Uysal, M. (1996). Modelling vacation destination decisions behavioural approach relationship marketing consumer markets: antecedents and consequences. Journal of travel &Tourism marketing,
Spreng, R. A., Mankenzie, S. B. & Olshavsky, R. W. (1996). A Re-examination of the determinants of consumer satisfaction. Journal of Marketing, Vol. 60, No. 3, pp. 15-32.
Spreng, R. & Chiou, J. (2002). A cross-cultural assessment of the satisfaction formation process. European Journal of Marketing, Vol. 38, No. 7/8, pp. 1-8.
Spreng, R. & Mckoy, J. (1996). An empirical examination of a model of perceived service quality and satisfaction. Journal of Retailing, Vol. 72, pp. 201-214.
Stabler, M. (1990). The concept of opportunity sets as a methodological framework for the analysis of selling tourism places: the Industry view. In G. Ashworth, & B. Goodall (Eds.), Marketing tourism places (pp.23-41). London: Routledge,
Swarbrooke, J. & Horner, S. (1999). Butter-worth Heinemann. Oxford, pp.453. Tian-Cole, S. & Crompton, J. L. (2003). A conceptualization of relationships
between Service quality and visitor satisfaction, and their links to destination selection. Leisure studies, Vol. 22, pp. 65-80.
Tse, D. K. & Wilton, P. C. (1988). Models of consumer satisfaction formation: An extension. Journal of Marketing Research, Vol. 25, pp. 204-212.
Um, S. & Crompton, J. L. (1990). Attitude determinants in tourism destination choice. Annals of Tourism Research, Vol. 17, pp. 432-448.
Walmsley, D. J. & Jenkins, J. M. (1992). Tourism cognitive mapping of unfamiliar environments. Annals of Tourism Research, Vol. 19, No. 2, pp. 268-286.
Walmsley, D. J. & Young, M. (1998). Evaluative image and tourism: The use of personal constructs to describe the structure of destination images. Journal of Travel Research, Vol. 36, No. 3, pp. 65-69.
Woodside, A., Frey, L. & Daly, R. (1989). Linking service quality, customer satisfaction and behavioural intention. Journal of Health Care Marketing,
Vol. 9, pp. 5-17.
Woodside, A. G. & Lysonski, S. (1989). A general model of traveller destination choice. Journal of Travel Research, Vol. 27, pp. 8-14.
Zeithmal, V. A. (2000). Service quality, Profitability, and the economic worth of customers: what we know and what we need to learn. Journal of the Academy of Marketing Science, Vol. 28, No. 1, pp. 67-85.
Zeithmal, V. A., Berry, L. L. & Parasuraman, A. (1996). The behavioural consequences of service quality. Journal of Marketing, Vol. 60, No. 2, pp. 31-46.
Zeithmal, V. A. & Bitner, M. (2003). Services marketing. Boston, MA: Irwin-McGraw Hill.
SUBMITTED: APRIL 2007
REFEREED ANONYMOUSLY