MODEL PREDICTIVE CONTROL FOR THE PROTON
EXCHANGE MEMBRANE FUEL CELL
LIPING FAN, JUN ZHANG
College of Environment and Safety Engineering, Shenyang University of Chemical Technology, Shenyang 110142, China
College of Information Engineering, Shenyang University of Chemical Technology, Shenyang 110142, China
ABSTRACT
Proton exchange membrane fuel cells are promising energy sources that produce electrical currents with almost null pollutant emissions, and they have been received growing attention in recent years. Maintaining a fuel cell system in correct operating conditions requires good system control. Based on the mathematical model of proton exchange membrane fuel cells, model linearization is carried out and a model predictive controller is designed for the proton exchange membrane fuel cell to keep constant voltage output. Simulation results show that the use of this model predictive controller can achieve a good control effect. Keywords: Fuel Cell, Model Predictive Control, Linearization Techniques
1. INTRODUCTION
The world is facing an energy crisis as well as significant environmental problems. It is known that fossil fuels such as petroleum, natural gas and coal are the main resources for generating electricity. However, they also have made a great contribution to environmental problems. Major efforts to reduce greenhouse gas emission have increased the demand for pollution-free energy sources. Non-polluting energy generation and other environmental issues have been driving during the last few years an increasing demand for new energy conversion technologies. Renewable bio-energy is viewed as one of the ways to alleviate the current global warming crisis. Major efforts are devoted to develope alternative electricity production methods (Das and Mangwani, 2010; Logan, 2010).
Fuel cells are promising energy sources that produce electrical currents with almost null pollutant emissions. Proton exchange membrane (PEM) fuel cells are the most popular type of fuel cell (Rezazadeh et al., 2011). PEMFC can be used as emergency power supply and small mobile power supply for outdoors power supply and high reliable and high stable power supply. Besides, in contrast to centralized power supply, PEMFC can be considered as distribution power supply and be gridded into power supply system for peak modulation.
The performance of PEMFC is influenced by many parameters such as operating temperatures both fuel cell and humidifiers, pressure, flow rates and relative humidity of fuel and oxidant gases (Kaytakoglu and Akyalm, 2007). Significant improvements in proton exchange membrane fuel cell technology have been achieved over the past decades. However, the performance, stability, reliability, and cost for the present fuel cell technology are not good enough to replace internal combustion engines. A number of problems must be overcome to improve their performance and reduce their cost (Riascos and Pereira, 2010).
A single proton exchange membrane fuel cell model was built in this paper and a model predictive controller for PEMFC was designed. 2. MATHEMATICAL MODEL OF PEMFC
As an electrochemical energy conversion device, the fuel cell produces electricity from external supplies of fuel (on the anode side) and oxidant (on the cathode side). The outline of a typical PEMFC is illustrated in Fig.1.
In the original hydrogen-oxygen proton exchange membrane fuel cell design, a proton-conducting polymer membrane, which only can be transfered through the proton, and the separation of the anode and cathode sides. On the anode side, hydrogen diffuses to the anode catalyst and then it will be dissociated into protons and electrons. The protons are transfered through the membrane to the cathode, meanwhile, the electrons are forced to travel in an external circuit since the membrane is electrically insulated. On the Cathode catalyst, oxygen molecules react with the electrons (which have traveled through the external circuit) and protons to form water.
Fig.1 Basic PEMFC Operation
The electric current is produced which is not thermochemical, but electrochemical. Based on the fact that no combustion reactions are involved in there process, there are two obvious advantages over the combustion engines: on the one hand, because of the PEMFC system do not operate with a thermal cycle, their operation is not constrained by the maximum Carnot cycle efficiency as combustion engines are. On the other hand, the PEMFC system run in a clean environment, they do not produce any undesirable products that normally associated with the oxidation of fossil fuels such as CO2, SO2, oxides of nitrogen, or particulate matter, water is the only product.
Mathematical models and simulation are needed as tools for designing the optimization of fuel cells, stacks, and fuel cell power systems. In system studies, it is important to have an adequate model to estimate overall performance of a PEM fuel cell in terms of operating conditions without extensive calculations (Carnes and Djilal, 2005).
PEM fuel cell electrochemical process starts on the anode side where H2 molecules are brought by
flow plate channels. Anode catalyst divides hydrogen on protons H+ that travel to cathode through membrane and electrons e- that travel to cathode over external electrical circuit. At the cathode hydrogen protons H+ and electrons e- combine with oxygen O2 by use of catalyst, to form
water H2O and heat. Described reactions can be
expressed by the following equations (Moreira and Silva, 2009; Rezazadeh et al., 2010; Youssef et al., 2010):
Anode: H2 2H 2e
+ −
→ + (1)
Cathode: 1 2 2 2
2O H e H O
+ −
+ + → (2)
The output voltage Vfc of a single cell can be defined as the result of the following expression
con ohmic act
nernst
fc
E
V
V
V
V
=
−
−
−
(3) in which Enernst is the thermodynamic potential of
the cell representing its reversible voltage,
2 2
3 nernst fc
-5 fc
1.229 0.85 10 ( 298.15) 1
4.31 10 ln( ) ln( )
2
H O
E T
T P P
−
= − × −
+ × +
(4)
where 2
H P and
2
O
P are the hydrogen and oxygen pressures, respectively, and Tfc is the operating
temperature. Vact is the voltage drop due to the
activation of the anode and the cathode:
2
3
act fc
5 4
fc O fc
0.9514-3.12 10
-7.4
10
ln(
)+1.87 10
ln( )
V
T
T
C
T
i
−
− −
=
×
×
×
(5)where i is the electrical current, and CO2 is the
oxygen concentration. Vohmic is the ohmic voltage drop associated with the conduction of protons through the solid electrolyte, and electrons through the internal electronic resistance:
Vohmic =i(RM +RC) (6) where RC is the contact resistance to electron flow,
and RM is the resistance to proton transfer through
M M
2 2.5
fc
M
fc
fc
181.6 1 0.03 0.062 303
-303 0.634 3 exp 4.18
l R
A
T
i i
A A
T i
A T
ρ
ρ
ψ
⋅ =
+ +
=
− −
(7) where
ρ
Mis the membrane specific resistivity, l is the membrane thickness, A is the membrane active area, and ψ is a specific coefficient for every type of membrane; Vcon represents the voltage drop resulting from the mass transportation effects, which affects the concentration of the reacting gases and can be described by the following expression:) 1 ( ln
max con
i i B
V =− − (8)
where B is a constant depending on the type of fuel cell, imax is the maximum electrical current.
Based on the above described mathematical model, a Matlab/simulink simulation model of the PEMFC can be set up (Fan, 2012). Parameters of the Ballard Mark V fuel cell are used in the simulation model (Correa et al., 2004).
3. MODEL LINEARIZATION
The model built above is strongly nonlinear. The high nonlinearity and parameter uncertainty exist in system models make it rather difficult to design a control scheme by using the non-linear model directly. In order to make the controller designed easy, model linearization is an alternative method (Nikolaou and Misra, 2003; Tyner and Lewis, 2010).
The temperature significantly affects the performance of a fuel cell by influencing the water removal and reactants activity, etc (Shan and Choe, 2005; Kirubakaran et al., 2009). It can be seen from Fig.2 that the output voltage decreases as the temperature decreased.
Considering the real work status of PEMFC, the temperature which has powerful effect on the dynamic process, which has been choosen as control variable and other inputs are supposed as constants when linear treatment is done. Then the PEMFC system is linearized to a linear model.
0 1 2 3 4 5 6
295 300 305 310 315 320 325 330 335 340 345
t/s
T
fc
/K
0 1 2 3 4 5 6
0.8 0.85 0.9 0.95 1 1.05 1.1 1.15
t/s
V
fc
/V
Fig.2. Voltage Changes With Temperature
The PEMFC system has a strong coupling characteristics, so it is difficult to get the linearize model. MATLAB system identification toolbox is used to linearize the model of the PEMFC, and the following linearization model can be derived as:
3.0949 ( )
0.001
G s s
=
+ (9) Simulation responding results of both the linearization model and the nonlinear model to ramp signal Tfc=298+4.5t is shown in Fig.3, in
which the broken line denotes the linearized model and the solid line stands for the nonlinear model.
Fig. 3. Simulation Results Of Linearization Model And The Nonlinear Model
4. DESIGN A MPC CONTROLLER
MPC is a form of control in which the current control action is obtained by solving on-line, at each sampling instant, a finite horizon open-loop optimal control problem, using the current state of the plant as the initial state; the optimization yields an optimal control sequence and the first control in this sequence is applied to the plant.
As the unique advanced algorithm model predictive control has been successfully used in industrial areas. The following make contribution to its success:
a) It handles multivariable control problems naturally.
b) It can take account of actuator limitations. c) It allows operation closer to constraints, hence increased profit.
d) It has plenty of time for on-line computations.
e) It can handle non-minimal phase and unstable processes.
f) It is a regulating convenient way.
The main idea of MPC algorithms is to solve an optimization problem in order to find the control vector trajectory that optimizes the cost function over a future prediction horizon (Jadlovska et al., 2008; Gondhalekar and Jones, 2011; Wang, 2001; Ghasemi, 2011).
Different from the traditional optimal control strategy, the model predictive control uses the non-parametric model based on impulse response as its internal model.
For a given discrete-time systems:
(
1)
( )
( )
( )
( )
m m m m
m m
x k
A x k
B u k
y k
C x k
+ =
+
=
(10)The MPC state space model can be expressed as follows:
( 1) ( )
(
1)
( )
(
1)
1
( )
( )
x k A x k
T
m m m
m m
B
m
m m
x k
A
O
x k
y k
C A
y k
B
u k
C B
+∆
+
∆
=
+
+
∆
(11)
( )
[
1]
( )
( )
Cm m
x k
y k
O
y k
∆
=
(12)which subject to:
( )
R , ( )
nR
mm
x k
∈ ⊂
X
u k
∈ ⊂
U
where
x k
m( )
、u k
( )
、y k
( )
are state, input and output vectors, respectively.Then the predicted expression of x and y can be obtained (suppose in the sampling ki (ki >0) :
1 2
(
)
( )
( )
(
1
(
1)
P P P P C N Ni P i i i
N
i
N N
i C
x k
N k
A x k
A
B u k
B
u k
A
B u k
N
− − −
+
=
+
∆
+
∆
+
+ +
∆
+
−
)
(13) 1 2(
)
( )
( )
(
1
(
1)
P P P P C N Ni P i i i
N
i
N N
i C
y k
N k
CA x k
CA
B u k
CB
u k
CA
B u k
N
− − −
+
=
+
∆
+
∆
+ +
+
∆
+
−
)
(14)According to the historical information and the future input, the future control action can be decided and the future output can be predicted by finding the optimal solution of the performance indicator described in the following equation:
2 1 T = =1
ˆ
, =
( +
)
( +
)
+
( + -1)
( + -1)
C N j N N T j
J u k
x k
j k Qx k
j k
u k j
Ru k j
∑
∑
(
)
(15)
in which x kˆ( +j k) is the prediction of
x( + )
k j
,u k
( )
is the process control signal, NP is theminimum cost-horizon, N2 is the prediction
horizon, Q is the state weighting matrix, Nc is the
Based on the knowledge up to time k, the increment input signal is
( )= ( )- ( -1)
u k
u k u k
∆
(16)Constraints: If there is more than one input, then the constraints are specified for each input independently. In the multi-input case, suppose that the constraints are given for the upper limits as
[
∆
u
1max,
∆
u
2max...,
∆
u
mmax]
(17) and lower limits asmin min min
1 2
[
∆
u
,
∆
u
...,
∆
u
m]
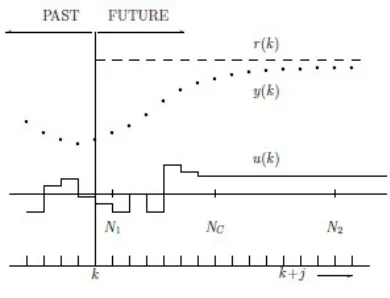
(18)Figure 4 explains the idea of receding horizon. At time k, the future control sequence
{
u k( ),...,u( +k NC-1)}
is optimized so that the performance-index J(u, k) is minimized subject to constraints.At time k the first element of the optimal sequence (u(k)) is applied to the real process.
[image:5.612.313.529.298.380.2]At the next time instant, the horizon is shifted and a new optimization at time k+1 is solved.
Fig.4. Moving Horizon In Predictive Control
The specific optimization process of predictive control is: each time when samples, it corrects predictive output based on model via output voltage actually measured and then conducts new optimization. It forms a closed loop optimization which not only used model information but also feedback information.
5. SIMULATION AND RESULTS ANALYSIS
The Simulink simulation model of the MPC control based on the linear model of the PEMFC is shown in Fig.5. The blcok “PEMFC” consists of a series functions according Equ. 3 to Equ. 8. Firstly, the PEMFC system is established to run and
analyze. Secondly, the model predictive controller is designed and debugged. At last, the model predictive applied to the PEMFC for debugging and runing.
[image:5.612.98.293.392.541.2]Control parameters of MPC are confirmed by trial and error. The control time interval is Tint=0.01s, the predictive region length is NP=20, the control region length is Nc=4, the robustness and rapidity are 0.8, the input weight is 0.0001, the weight change rate is 0.01, the output weight is 1, the measurable disturbance v=0, and the input constrain is [293, 380], the output constraints value is [0, 2]. Output noise interference is not considered for the time being. In order to get the final accurate answer, every parameter should be analyzed and compared according to the output voltage curve.
Fig. 5. Simulation Model Of MPC Control
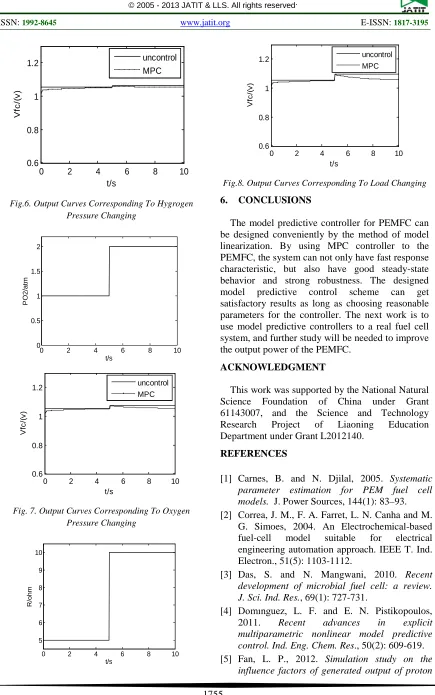
Simulation results are shown in Fig.6 to Fig.8, in which hygrogen pressure, oxygen pressure and load has a sudden change at 5s respectively. The given output voltage is 1.05V. It can be seen from these figures that MPC can make the output voltage of PEMFC follow the given output voltage signal well, no matter how the hydrogen pressure, oxygen pressure or the load changes.
0 2 4 6 8 10 0
0.5 1 1.5 2
t/s
P
H
2/
at
[image:5.612.328.496.512.656.2]0 2 4 6 8 10 0.6
0.8 1 1.2
t/s
V
fc
/(
v
)
uncontrol MPC
Fig.6. Output Curves Corresponding To Hygrogen Pressure Changing
0 2 4 6 8 10 0
0.5 1 1.5 2
t/s
P
O2
/a
tm
0 2 4 6 8 10 0.6
0.8 1 1.2
t/s
V
fc
/(
v
)
uncontrol MPC
Fig. 7. Output Curves Corresponding To Oxygen Pressure Changing
0 2 4 6 8 10 5
6 7 8 9 10
t/s
R
/ohm
0 2 4 6 8 10 0.6
0.8 1 1.2
t/s
V
fc
/(
v
)
[image:6.612.93.528.59.754.2]uncontrol MPC
Fig.8. Output Curves Corresponding To Load Changing
6. CONCLUSIONS
The model predictive controller for PEMFC can be designed conveniently by the method of model linearization. By using MPC controller to the PEMFC, the system can not only have fast response characteristic, but also have good steady-state behavior and strong robustness. The designed model predictive control scheme can get satisfactory results as long as choosing reasonable parameters for the controller. The next work is to use model predictive controllers to a real fuel cell system, and further study will be needed to improve the output power of the PEMFC.
ACKNOWLEDGMENT
This work was supported by the National Natural Science Foundation of China under Grant 61143007, and the Science and Technology Research Project of Liaoning Education Department under Grant L2012140.
REFERENCES
[1] Carnes, B. and N. Djilal, 2005. Systematic parameter estimation for PEM fuel cell
models. J. Power Sources, 144(1): 83–93.
[2] Correa, J. M., F. A. Farret, L. N. Canha and M. G. Simoes, 2004. An Electrochemical-based fuel-cell model suitable for electrical engineering automation approach. IEEE T. Ind. Electron., 51(5): 1103-1112.
[3] Das, S. and N. Mangwani, 2010. Recent development of microbial fuel cell: a review.
J. Sci. Ind. Res., 69(1): 727-731.
[4] Domınguez, L. F. and E. N. Pistikopoulos, 2011. Recent advances in explicit multiparametric nonlinear model predictive
control. Ind. Eng. Chem. Res., 50(2): 609-619.
exchange membrane fuel cell. AMM, 121-126: 2887-2891.
[6] Ghasemi, A., 2011. Application of linear model predictive control and input-output linearization to constrained control of 3D cable
robots. Mod. Mech. Eng., 1(2): 69-76.
[7] Gondhalekar, R. and C. N. Jones, 2011. MPC of constrained discrete-time linear periodic
systems - a framework for asynchronous
control: strong feasibility, stability and optimality via periodic invariance. Automatica, 47(2): 326-333.
[8] Holkar, K. S. and L. M. Waghmare, 2010. An overview of model predictive control. SERSC.
Int. J. Contr. Auto., 3(4): 47-63.
[9] Jadlovska, A., N. Kabakov and J. Sarnovsky, 2008. Predictive control design based on neural model of a non-linear system. ACTA Polytech. Hung., 5(4): 93-109.
[10]Kaytakoglu, S., and L. Akyalm, 2007.
Optimization of parametric performance of a
PEMFC. Int. J. Hydrogen. Energ., 32(17):
4418-4423.
[11]Kirubakaran, A., S. Jain and R.K. Nema, 2009.
The PEM fuel cell system with DC/DC boost
converter: design, modeling and simulation.
IJRTE, 1(3): 157-160.
[12]Lee, J., 2011. Model predictive control: review
of the three decades of development. Int. J.
Control. Autom., 9(3): 415-424.
[13]Logan, B. E., 2010. Scaling up microbial fuel cells and other bioelectrochemical systems.
Appl. Microbiol. Biot.,85(6):1665–1671, 2010. [14]Moreira, M. V. and G. E. Silva, 2009. A
Practical Model for Evaluating the Performance of Proton Exchange Membrane
Fuel Cells, Renewable Energy, 34(7):
1734-1741.
[15]Nikolaou, M. and P. Misra, 2003. Linear control of nonlinear processes: recent
developments and future directions. Comput.
Chem. Eng., 27(8-9): 1043-1059.
[16]Rezazadeh, A., A. Askarzadeh and M. Sedighizadeh,2011. Adaptive inverse control of proton exchange membrane fuel cell using RBF
neural network, Int. J. Electrochem. Sci., 6:
3105-3117.
[17]Rezazadeh, A., M. Sedighizadeh and M. Karimi, 2010, Proton Exchange Membrane Fuel Cell Control Using a Predictive Control
Based on Neural Network, International Journal
of Computer and Electrical Engineering, 2(1): 81-85.
[18]Riascos, L. A. M. and D. D. Pereira, 2010.
Controlling operating temperature in PEM Fuel
Cells. ABCM Sym. Ser. in Mech., 4: 137-146.
[19]Shan, Y. S. and Y. Choe, 2005. A high dynamic PEM fuel cell model with temperature effects. J.
Power Sources, 145(1): 30–39.
[20]Tyner, D. R. and A. D. Lewis, 2010. Geometric
Jacobian linearization and LQR theory. J.
Geom. Mech., 2(4): 397–440.
[21]Wang, L., 2001. Continuous time model predictive control design using orthonormal
functions. Int. J. Contr, 74(16): 1588-1600.
[22]Youssef, M. E., K. E. NAdi and M. H. Khalil, 2010. Lumped Model for Proton Exchange
Membrane Fuel Cell (PEMFC), International