ISSN: 1992-8645 www.jatit.org E-ISSN: 1817-3195
34
A NEW STRUCTURAL SIMILARITY MEASURE FOR
CLUSTERING MULTI-STRUCTURED DOCUMENTS
1
ALI IDARROU, 1DRISS MAMMASS
1
IRF-SIC, IBN ZOHR University Agadir, Morocco
E-mail: [email protected]
ABSTRACT
Traditional methods of document comparison are based on the similarities called "surfaces": a model of similarity based on descriptive properties of objects without considering the relationships between these
properties. We have proposed a new structural measure, based on sub-graph isomorphism, taking into
account the distribution (order, position, etc) of components of the documents compared and the relationships between these components (preserve more sense). Our measure reflects both the contextual and structural aspects of documents compared. In this work, we will show in detail our similarity measure
and study the impact of the similarity threshold (a parameter fixed previously) on generated clusters. We
evaluate our approach on a corpus of multimedia documents extracted randomly from the INEX 2007 corpus and the corpus of descriptive records of books in XML format from the library of the University of Toulouse 1 Capitole.
Keywords: Multimedia Document, Clustering, Sub-Graph Isomorphism, Structural Similarity
1. INTRODUCTION
Automatic classification is a solution that allows organizing a large collection of documents. This allows reducing the search space and thus improves the performance of the information access processing in a large mass of data: increasing the
accuracy and reducing noise.
Documents can be grouped together according to their structure and/or their content. We consider that
the document structure is a sufficiently
discriminating factor for classification. Thus, the structural classification in the sense that we understand [7] allows creating, in a documentary warehouse, clusters called generic views. A generic view is a superposition of trees representing document structures. It can be enriched (addition of fragments: transformation of the generic views) along with the classification. This tree superposition creates a rooted graph structure (example Figure 1). It is not a simple summary, as is the case of the works using the summary trees to represent documents, but rather a rich description (without losing information) representing a set of specific structures structurally similar.
Comparing two documents requires modeling these documents in a formal manner and using (or defining) an appropriate measure to evaluate the similarity between these documents. We are
interested in representing multi-structured
multimedia documents using graphs. To compare
two documents is, therefore, to compare the graphs
that represent them. The graph theory could be of great interest in the evaluation of the structural similarity. The induced sub-graph isomorphism allows showing that a graph is included in another, one, while the partial sub-graph isomorphism determines the intersection of the two graphs.
To evaluate the proximity between two graphs, we have proposed a new structural similarity measure based on sub-graph isomorphism that relies on a graph weighting function that we have introduced. The latter allows expressing hierarchical and contextual aspects of components (nodes and arcs), insofar as it takes into account the distribution of these components in the graph and the nature of the relationships between these components. Our graph weighting function allows reflecting both the structure and sense of the compared documents.
ISSN: 1992-8645 www.jatit.org E-ISSN: 1817-3195
35 impact of the similarity threshold (a parameter fixed a priori) of the resulting clusters.
In the next section we will give an overview, not exhaustive but representative, of the works which have used trees or graphs to represent documents. First we will begin this section with some basic notions on graphs. In the third section we will present the MVDM model "Multi Views Document Model" [4]. We will describe in the fourth section our similarity measure. In the fifth section, we will give a brief overview of our structural clustering process of multi-structured multimedia documents. Before concluding, we will present in the sixth section our experimental results.
2. RELATED WORKS
2.1 Basic notions on graphs
Let G=(V,E) and G’=(V’,E’) two graphs are defined by its set of nodes V (resp. V’) and its set of edges E (resp. E’).
Definition 1
G is a sub-graph of G’ V⊂V’ and E⊂E’.
Definition 2
G is isomorphic to a sub-graph of G’ if and only
if there is an injection f from V to V’ such:
∀(u,v)∈V2; (u,v)∈E ⇒ (f(u),f(v))∈E’
2.2 Document representation
Several works have used trees to represent the documents to compare. In their approach of structural classification of documents, the authors of
[3] use the tree summary obtained by
transformations of trees (depth reduction,
elimination of repeated nodes, etc). However, these transformations can cause a loss of semantic and contextual information. For example, the depth
reduction involves the elimination of components
and relations between these components.
The works of [2,10,13,15,17] have used the frequent sub-trees (sub-trees that appear frequently in the collections of trees considered) to classify documents. In their approach to semantic classification of XML documents [14] have proposed a model of data representation that exploits the notion of tree-tuple to identify the
semantically coherent sub-structures in XML
documents. In [16], XML documents are
represented as a tree, which is considered as a set of paths. Thus, the classification is based on the calculation of the frequency of these paths. Thus, the classification is based on the calculation of the frequency of these paths. The idea of linearization of trees proposed in these works is very interesting. In the approach of [11], the semantic and logical
structures of XML documents to be classified are represented as tree forms. [11] has proposed a measure to evaluate the degree of inclusion between two trees T and T’ :
Sim T, T′ 1 ∑∑ (1)
-
Danc(vj): represents the alignment distance of ancestors of node vj.-
Panc(vj): represents the weight of the ancestors of node vj.Other works have used graphs to represent documents. In fact, graphs are data structures having the capacity to represent complex and structured objects. The mathematical theory of graphs could be of great interest to the evaluation of the similarity of documents, both in retrieval information and the documentary classification. In [18], the sub-graph isomorphism can be used to show the inclusion or equivalence of two graphs. In the works of [6], the graphs were used to represent images segmented to classify them. In [1], graphs have been used to represent objects for computer assisted design. The nodes of the graph represent the components of the object and the edges of the graph represent binary relations between these components. In [4] the graphs were used to represent the multi-structured documents within a documentary warehouse. He has proposed the
MVDM model to describe the multi-structured
documents.
In the next section, we present the MVDM
model.
3. PRESENTATION OF THE MODEL
MVDM
The MVDM model introduced the concept of
view: a set of structural nodes and relations between
these nodes. A node can be simple or complex (for
example, a fragment multimedia image). In this last case, the node can be considered as a sub-document itself can be fragmented into a set of nodes and relations between these nodes. There may be more
than one possible relationship between two same
components of a document. A document view allows materializing several organizations of this document. According to this model, the notion of document structure can be encompassed within a wider notion which is the view. A specific view corresponds to a particular organization of a document or a viewpoint on this document. It reflects one of the structures of a multi-structured
document [4]. The MVDM model is composed of
ISSN: 1992-8645 www.jatit.org E-ISSN: 1817-3195
36 specific view, characterizing the organization of a particular document, is represented in tree form and
(2) a generic level (DWg) where each generic view
(cluster) represents a collection of the specific views structurally similar. The generic views are represented in graph forms (Figure 1).
We can write: DW = DWg∪DWsp (Figure 1)
where DWg represents the generic level (clusters) of DW and DWsp represents the specific level of
DW: the specific characteristics of each document
(structure+content). Access to the cluster
representative (Vgi) allows targeted access to a sub-collection of documents of DWsp represented by it (by Vgi).
Figure.1: Architecture of the documentary warehouse
Formally, we can define as follows:
-
DWg=⋃ is the set of generic views,where each generic view Vgi consists of a set of generic paths. We can write : Vgi=⋃" !" where each generic path pathj is a set of generic
relationships: pathj=⋃$ #$ ;
-
DWsp=⋃& % & is a set of specific views,where each specific view Vspk is composed of a
set of specific paths. We can write:
Vspk=⋃( !( where each specific path
pathc is a set of specific relationships: pathc
=⋃) #) .
In the next section, we introduce a new structural similarity measure.
4. DEFINITION OF A STRUCTURAL
SIMILARITY MEASURE
4.1 Weighting of a Graph
In a multimedia document, the
relationships between the structural elements are additional information that can’t be neglected. For example, in a television newscast, the audio and
video must be synchronized (temporal
relationships, special relationships, etc) to ensure consistency of the information.
In a process of structural comparison of documents, we think that the structural information is essential and that two documents composed of the same components doesn’t imply they are similar. For example, the same image in two different documents may not express the same context.
According to the mapping theory developed by [5], good analogies are those based on relationships between entities rather than their descriptive properties. In that vein, we have defined a weighting model of graph on which will be based our similarity measure. According to this measure the weight of an arc must reflect the importance of a structural viewpoint of this arc in the graph. It must therefore take into account the relationships between different components of a graph and the position of each of these components; position in a path and order relative to the brother components.
We have chosen to consider a graph as a set of paths. This allows reducing the cost generated by combinatorial search of graph isomorphism; known problem in graph theory [8]. The comparison of two graphs is therefore the comparison of the paths that compose them.
Let G = (V,E) a directed, labeled and ordered graph. The weighting function Pe of a given arc is defined by:
Pe: E → ]0,1[ (u,v) aPe(u,v)
where
1 - α
& if prof(v)=1
Pe(u,v) =
(2)
Pe(x,u) - α
&+,-. / otherewise; x∈ father(u)
-
x ∈father(u): u can have multiple parent nodes (Figure 2, in graph G, father(H) = {C,A});-
prof(v): profoundness of v: position in a path;-
k (a power of 10) a fixed parameter indicating the maximum number of son nodes (number of son nodes< k) for each node of the manipulated graphs depending on the nature of the document collection treated (profoundness of root node =0);
-
α is a parameter that depends on the type of node v:1 if v an attribute or metadata α = (3)
order(v) otherwise
In the formula (2), the number of digits of the fractional part of Pe(u,v), which depends on k,
indicates the profoundness of the arc (u,v)
ISSN: 1992-8645 www.jatit.org E-ISSN: 1817-3195
37
Figure 2: Example of the graph weighting
In the example (Figure 2), the graph G is composed
of paths: "A/B", "A/C/H" and "A/H". We have:
Pe(A,B) = 1 - 01 1 1 0.9,
Pe(C,H) = Pe(A,C) – 011 = 0.8
-
4$56$ 711 0.8 11= 0.79.
To classify documents, it is necessary to have an appropriate operator to evaluate the proximity between two documents. When the documents are represented in graph forms, to compare two documents structurally is therefore to compare the graphs that represent them. In graph theory, the problem of comparing graphs is reduced to the problem of looking for an isomorphism of (sub) graphs. The isomorphism of (sub) graphs allows showing that two graphs are structurally identical or one is included in the other. We situate our works in the framework of looking for an isomorphism of sub-graphs and we propose a new measure of structural similarity.
4.2 Sub-graph Isomorphism
We consider a graph as a set of paths and a path of a graph is a sub-graph of this graph. In the example of the Figure 2, G = (V,E) where V is a set of nodes of G and E is a set of its arcs. The path denoted path2 ="A/C/H " is a sub-graph of G. in fact, we can write path2 = (V2,E2) with V2 = {A,C,H}and E2 = {(A,C), (C,H)}. We have V2 ⊂ V and E2⊂E therefore path2is a sub-graph of G.
Before defining our structural similarity
measure, we first define the measure dInc which
evaluates the inclusion degree of a given path in a given graph G’:
9:;< !, =′ =? @& ∈B ,;CD
E
∑ #H ∈ !FG# #H IH,JF
∑ #H ∈ !G# #H
K
(4)where
Pe(e’h) if ∃ e’h ∈path’k / ϕe(ej) = e’h (path’k ⊂G’)
wj,k= (5)
0 otherewise
-
n': the number of G’ paths;-
ϕe: an alignment function bidirectionalfrom E (resp. E’) to E’ (resp. E) which allows aligning two similar arcs:
ϕe : E→ E’
a a ϕe(a) =a’ ; where the arcs a and a’ arestructurally similar.
Figure 3: The inclusion of a path in a graph
In this example (Figure 3), the graph G’ is composed of 7 paths:
-
path’1 = "article/writer/name";-
path’2 = "article/writer/address/number";-
path’3 = "article/writer/address/street";-
path’4 = "article/writer/address/city";-
path’5 = "article/editor/address/number";-
path’6 = "article/editor/address/street";-
path’7 = "article/editor/address/city".The graph G is composed of two paths:
-
path1 = "article/writer/tel";-
path2 = "article/writer/address/number".Let G and G’ two given graphs and path a path of G.
Theorem1
dInc(path,G’) = 0 if and only if path is isomorphic to a sub-graph of G’ (path is structurally similar to a path of G’: path⊂G’).
In fact:
9:;< !, =′ L FG# #H IH,JF
#H ∈ !
0
⇔∀ej∈path; ∃k∈[1,n’] ; Pe(ej)=wj,k
⇔∀ej ∈ path; ∃ e’h ∈ path’k /ϕe(ej)= e’h
ISSN: 1992-8645 www.jatit.org E-ISSN: 1817-3195
38 In Figure 3, path2=" article/writer/address/number" of G and path’2="article/writer/address/number" of
G’ are isomorphic.
In fact:
9:;<M
!
2, =′O =? @& ∈B ,PDQ∑ #H ∈ !2RG# #H IH,JR ∑ #H ∈ !2G# #H S=0
Theorem 2
dInc(path,G’) = 1 if and only if path ∩ G’=∅
In fact:
9:;< !, =T 1
⇔? @& ∈B ,;CD Q
∑ #H ∈ !RG# #H IH,JR ∑ #H ∈ !G# #H S = 1
⇔∀ej∈path ; ∀k∈ [1,n’], wj,k = 0
⇔ path∩G’ = ∅
Theorem 3
Let G be a graph composed of n paths {path1, path2,
..., pathn}.
∑ ∈B ,;D9:;< ! , =′ 0⇔G isomorphic to a
sub-graph of G’
In fact:
L 9:;< ! , =′
∈B ,;D
0
⇔ ∀i ∈ [1,n] ; dInc (pathi,G’) = 0 ⇔∀i ∈ [1,n] ; pathi isomorphic to a sub-graph of G’(theorem 1)
⇔G isomorphic to a sub-graph of G’.
In this example (Figure 2), G is composed of 3
paths: path1 = "A/B", path2 = "A/C/H", and path3 = "A/H".
L 9:;< ! , =′ ∈B ,UD
9:;< ! , =T V 9:;< !W, =T V 9:;< !U, =′
X1.YZ1.Y
1.Y V
1.PYZ1.PY [ 1.\Z1.\
.]Y V
1.PZ1.P
1.P ^ 0
Therefore the graph G (Figure 2) is isomorphic to
a sub-graph of G’.
4.3 A new Structural Similarity Measure
Conventional comparison systems return a value indicating that the two objects being compared are similar or not. However, in most applications, it is interesting to have more details on the proximity of objects compared. We are interested in the category of systems allowing evaluating the proximity between two objects from a continuous value to quantify the similarity and difference between these two objects.
We have proposed a new structural similarity measure based on sub-graph isomorphism. This measure reflects the structure of graphs compared in the sense that we compare the paths of graphs taking into account both the position of the nodes, the order of the brother nodes and the relationships between these nodes (example Figure 4). In our context, we consider that the position of nodes and the relationships between these nodes are two essential parameters in a process of structural comparison of multimedia documents.
To evaluate the structural similarity between two graphs G and G’ noted Sim(G,G’), we have defined the following measure:
_ ? =, =T 1 ` % =, =T (6)
where
` % M=, =′ O 5aa′ [5a′a
W (7)
and 9bbC
;∑∈B ,;D9:;< ! , =′ (8)
and
9bCb ;C∑∈B ,;CD9:;< !′ , = (9)Where dGG’ (rep. dG’G) is the alignment distance between G and G’ (resp. G’ and G) and n and n’ are respectively the number of pathsof G and G’. The division by n (rep. n’) allows normalizing the value of dGG’ (rep. dG’G) between 0 and 1.
Corollary 1
dGG’ = 0 ⇔G is isomorphic to a sub-graph of
G’(theorem 1).
Corollary 2
dGG’ = 0 and dG’G = 0 ⇔G and G’ are isomorphic
.
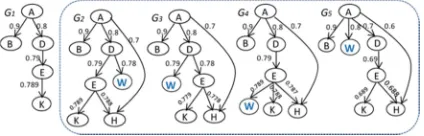
The similarity measure proposed is based on path matching of the graphs to compare. We show through the example of Figure 4, that it takes into
account the distribution (profoundness, order,
hierarchy) of the components (nodes and arcs) of
[image:5.612.316.528.593.661.2]the graphs compared.
Figure 4: Example of similarity calculation between graphs
ISSN: 1992-8645 www.jatit.org E-ISSN: 1817-3195
39
Sim(G1,G2) = 0.82, Sim(G1,G3) = 0.81, Sim(G1,G4) = 0.83 and Sim(G1,G5) = 0.71.
The difference between Sim(G1,G2), Sim(G1,G3),
Sim(G1,G4) and Sim(G1,G5) can be explained by the fact that the proposed measure takes into account the distribution of structural elements in the graphs compared. We observe a difference, which becomes important in the case of Sim(G1,G4), between the similarity values due to differences in positioning some nodes, in particular the node "W" (different
order or different profoundness). This shows that
the proposed similarity measure takes into account the profoundness and order, penalizing differences of the profoundness.
[image:6.612.313.528.311.395.2]To compare the proposed measure with the existing measures, we have chosen two types of measures: a type based on the descriptive characteristics (Jaccard’s measure) regardless of the relationship between the components of the objects compared and a type based on the structural alignment [11].
Table 1: Comparison between our measure, Jaccard’s measure and [11]’s measure
Jaccard’s measure [11]’s measure Our measure
Sim(G1,G2)= 0.63 Sim(G1,G2)=1 Sim(G1,G2)=0.82
Sim(G1,G3)=0.63 Sim(G1,G3)=1 Sim(G1,G3)=0.81
Sim(G1,G4)=0.63 Sim(G1,G4)=0.99 Sim(G1,G4)=0.83
Sim(G1,G5)=0.63 Sim(G1,G4)=0.93 Sim(G1,G4)=0.71
The graphs G2, G3, G4, and G5 consist of the same nodes. However, these nodes don’t have the same distribution on 5 graphs. Specifically, these graphs aren’t identical from a structural point of view. We note that the values shown by the lines in column 1 of Table 1 are the same. They don’t depend on the organization of nodes of graphs G1, G2, G3, G4, and
G5. Unlike Jaccard’s measure, our measure is
structural and not a "surface measure", it takes into account the structural aspect of compared objects, which is clearly reflected through the values of the third column of Table 1. Indeed, our measure is
based on a weighting function (2) taking into
account the hierarchical and contextual aspects. Measuring of [11] calculates the degree of inclusion of a given graph in another. It doesn’t evaluate the
similarity between two graphs. The weighting
function proposed by the author favors the son node (level n + 1) on the parent node (level n). We note that according to this measure, the similarity
between a graph G and a graph G’ which contains it
is equals 1 and that whatever G’ is (e.g, lines 1 and 2 in column 2 of Table 1. In fact, it is difficult to interpret the result as Sim (G,G’) = 1. Unlike the measure of [11], our measure penalizes the non-matching components (nodes and arcs) of the graph
G’. Specifically, our measure allows evaluating the
inclusion in either direction (G ⊆G’ and G’ ⊆G).
5. STRUCTURAL CLUSTERING OF
MULTI-STRUCTURED DOCUMENTS
In [12], the model MVDM allows a rich
representation of the mutli-structured documents and that this wealth can be exploited to classify multi-structured documents. Within the framework of MVDM, the problem of classification results in the problem of attachment (example, Figure 1) of a
specific view of a given document to the generic
view the most structurally similar. The choice of the
generic view, of the documentary warehouse the
most structurally similar to which specific view must be attached, is based on the comparison of the
latter with all the generic views of the documentary
[image:6.612.90.298.370.424.2]warehouse.
Figure 5: Example of extracting a specific view then the document representative
-
Vsp: is a specific view of the document"labo.xml",
-
Rep_d: ageneric representative of Vsp,-
"?": cardinality; means optional component,-
"+": cardinality; means one or more.In our previous works [7], we have presented the steps of our document integration process in the documentary warehouse. Due to the lack of space, we couldn’t show in detail our approach to structural clustering, but we refer the reader to these works. The basic idea of our integration process of a new multimedia document is to extract the specific view Vsp of this document then its representative, which materializes the generic representation of
Vsp. The representative Rep_d (e.g Figure 5) thus obtained is subsequently used in the comparison process. The comparison process consists of calculating the similarity between Rep_d and each
generic view Vg of Dwg (e.g Figure 1). Then,
ISSN: 1992-8645 www.jatit.org E-ISSN: 1817-3195
40 created automatically along with the integration of documents.
Definition 3
Let G and G’ be two directed labeled and
ordered graphs. G and G’ are structurally similar (according to our measure) if and only if: Sim(G,G’) >= Sim_thresh; where Sim_thresh is a similarity
threshold(parameter fixed previously).
For example (Figure 2), with Sim_thresh = 0.82 the
graphs G1 and G4 are similar.
6. EXPERIMENTAL RESULTS
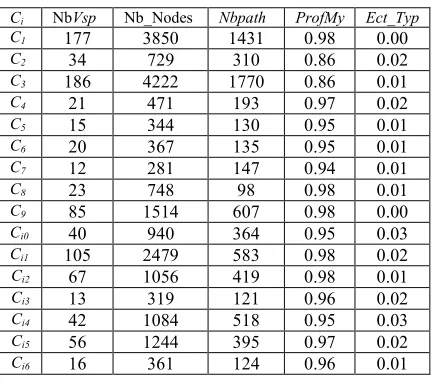
[image:7.612.104.291.365.445.2]We have studied the impact of the similarity threshold on the quality of classes generated by our clustering process. To do this, we conducted three series of tests on the same corpus of 1606 documents extracted randomly from the INEX 2007 corpus and the corpus of descriptive records of books in XML format from the library of the University of Toulouse 1 Capitole.
Table 2: Description of the used corpus.
Number of documents 1606
Total number of nodes 38138
Total number of elements 21814 Total number of attributes 16324 Average number of nodes/Vsp 23.75 Average number of paths /Vsp 8.86 Average profoundness / Vsp 6.06
In the three series of tests, we varied the
similarity threshold to 78%, 80% and 82%. The
tables in each of our experiences will show the following:
-
NbVsp: the number of specific views attachedper cluster;
-
Nb_Nodes: the number of nodes of typeelements per cluster;
-
Nbpath: the number of paths per cluster;-
ProfMy: average of profoundness of the specificviews attached;
-
SimMy: average of
theintra-clustersimilarity;-
Ect_Typ: the
standard deviationintra-cluster.
With a similarity threshold of 78% (classif78), the 1606 documents are grouped into 40 clusters (Table 3).
Table 3: Clustering results (classif78)
Ci NbVsp Nb_Nodes Nbpath ProfMy Ect_Typ
C1 177 3850 1431 0.98 0.00
C2 34 729 310 0.86 0.02
C3 186 4222 1770 0.86 0.01
C4 21 471 193 0.97 0.02
C5 30 621 246 0.88 0.06
C6 20 367 135 0.95 0.01
C7 22 436 218 0.83 0.03
C8 23 748 98 0.98 0.01
C9 85 1514 607 0.98 0.00
Ci0 40 940 364 0.95 0.03
Ci1 105 2479 583 0.98 0.02
Ci2 67 1056 419 0.98 0.01
Ci3 13 319 121 0.96 0.02
Ci4 42 1084 518 0.95 0.03
Ci5 56 1244 395 0.97 0.02
Ci6 30 654 251 0.83 0.03
Ci7 18 467 181 0.89 0.02
Ci8 6 143 70 0.91 0.01
Ci9 33 810 327 0.95 0.02
C20 29 523 194 0.98 0.02
C21 26 478 174 0.98 0.01
C22 18 425 186 0.95 0.01
C23 34 827 248 0.99 0.01
C24 30 539 216 0.99 0.02
C25 29 529 189 0.98 0.01
C26 7 133 63 0.98 0.01
C27 13 281 86 0.99 0.00
C28 22 474 156 0.98 0.01
C29 8 191 53 0.98 0.01
C30 29 645 220 0.98 0.00
C31 42 1028 305 0.98 0.00
C32 72 1399 508 0.96 0.02
C33 145 3339 1273 0.96 0.02
C34 10 232 124 0.91 0.01
C35 12 255 130 0.95 0.02
C36 44 1257 242 0.98 0.01
C37 17 2170 991 0.98 0.01
C38 5 546 288 0.97 0.02
C39 2 204 115 0.99 0.01
C40 4 509 241 0.95 0.01
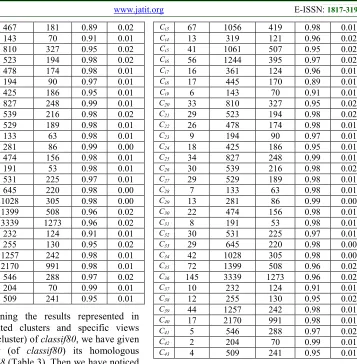
[image:7.612.315.531.548.740.2]With a similarity threshold of 80% (classif80), the 1606 documents of the corpus are grouped into 42 clusters (Table 4).
Table 4: Clustering results (classif80)
Ci NbVsp Nb_Nodes Nbpath ProfMy Ect_Typ
C1 177 3850 1431 0.98 0.00
C2 34 729 310 0.86 0.02
C3 186 4222 1770 0.86 0.01
C4 21 471 193 0.97 0.02
C5 15 344 130 0.95 0.01
C6 20 367 135 0.95 0.01
C7 12 281 147 0.94 0.01
C8 23 748 98 0.98 0.01
C9 85 1514 607 0.98 0.00
Ci0 40 940 364 0.95 0.03
Ci1 105 2479 583 0.98 0.02
Ci2 67 1056 419 0.98 0.01
Ci3 13 319 121 0.96 0.02
Ci4 42 1084 518 0.95 0.03
Ci5 56 1244 395 0.97 0.02
ISSN: 1992-8645 www.jatit.org E-ISSN: 1817-3195
41
Ci7 18 467 181 0.89 0.02
Ci8 6 143 70 0.91 0.01
Ci9 33 810 327 0.95 0.02
C20 29 523 194 0.98 0.02
C21 26 478 174 0.98 0.01
C22 9 194 90 0.97 0.01
C23 18 425 186 0.95 0.01
C24 34 827 248 0.99 0.01
C25 30 539 216 0.98 0.02
C26 29 529 189 0.98 0.01
C27 7 133 63 0.98 0.01
C28 13 281 86 0.99 0.00
C29 22 474 156 0.98 0.01
C30 8 191 53 0.98 0.01
C31 30 531 225 0.97 0.01
C32 29 645 220 0.98 0.00
C33 42 1028 305 0.98 0.00
C34 72 1399 508 0.96 0.02
C35 145 3339 1273 0.96 0.02
C36 10 232 124 0.91 0.01
C37 12 255 130 0.95 0.02
C38 44 1257 242 0.98 0.01
C39 17 2170 991 0.98 0.01
C40 5 546 288 0.97 0.02
C41 2 204 70 0.99 0.01
C42 4 509 241 0.95 0.01
After examining the results represented in Table 4 (generated clusters and specific views
component each cluster) of classif80, we have given
for each cluster (of classif80) its homologous
cluster of classif78 (Table 3). Then we have noticed
the emergence of two new clusters. In comparison with the results of classif78, we have noticed an improvement of the average similarity intra-cluster and a considerable optimization of the standard deviation (Ect_Typ) of intra-cluster of clusters which have undergone changes: lines 5, 7 and 16 of Table 4. In return, the number of generated clusters increases.
With a similarity threshold of 82% (classif82), the 1606 documents are grouped into 43 clusters (Table 5).
Table 5: Clustering results (classif82)
Ci NbVsp Nb_Nodes Nbpath ProfMy Ect_Typ
C1 177 3850 1431 0.98 0.00
C2 32 678 293 0.86 0.01
C3 185 4198 1763 0.97 0.02
C4 21 471 193 0.97 0.02
C5 15 344 130 0.95 0.01
C6 20 367 135 0.95 0.01
C7 12 281 147 0.94 0.01
C8 23 748 98 0.98 0.01
C9 85 1514 607 0.98 0.00
Ci0 5 120 46 0.86 0.04
Ci1 40 940 364 0.95 0.03
Ci2 105 2479 583 0.98 0.02
Ci3 67 1056 419 0.98 0.01
Ci4 13 319 121 0.96 0.02
Ci5 41 1061 507 0.95 0.02
Ci6 56 1244 395 0.97 0.02
Ci7 16 361 124 0.96 0.01
Ci8 17 445 170 0.89 0.01
Ci9 6 143 70 0.91 0.01
C20 33 810 327 0.95 0.02
C21 29 523 194 0.98 0.02
C22 26 478 174 0.98 0.01
C23 9 194 90 0.97 0.01
C24 18 425 186 0.95 0.01
C25 34 827 248 0.99 0.01
C26 30 539 216 0.98 0.02
C27 29 529 189 0.98 0.01
C28 7 133 63 0.98 0.01
C29 13 281 86 0.99 0.00
C30 22 474 156 0.98 0.01
C31 8 191 53 0.98 0.01
C32 30 531 225 0.97 0.01
C33 29 645 220 0.98 0.00
C34 42 1028 305 0.98 0.00
C35 72 1399 508 0.96 0.02
C36 145 3339 1273 0.96 0.02
C37 10 232 124 0.91 0.01
C38 12 255 130 0.95 0.02
C39 44 1257 242 0.98 0.01
C40 17 2170 991 0.98 0.01
C41 5 546 288 0.97 0.02
C42 2 204 70 0.99 0.01
C43 4 509 241 0.95 0.01
After examining the results in Table 5 (generated clusters and specific views component
each cluster) of each clustering classif80 and
classif82, we have given for each cluster its
homologous cluster of classif80 (Table 4). Then we
noticed the emergence of a new cluster that grouping 5 specific views (Table 5).
7. CONLUSION
This paper is a continuation of our works on the structural clustering of multi-structured multimedia documents. In this work, we have presented in detail our similarity measure and we have studied the impact of the similarity threshold (a parameter fixed a priori) on the resulting clusters.
Our clustering approach is not based on a "surface similarity", it’s based on a structural similarity taking into account the relationships
(supplementary information) between the
[image:8.612.161.518.72.436.2]ISSN: 1992-8645 www.jatit.org E-ISSN: 1817-3195
42 based on a sub-graph isomorphism that relies on the path matching. This allows keeping the contextual
and hierarchical aspects of the matched
components.
Along with the construction of clusters, generic
views may be transformed [7]. These
transformations may lead to an approximation of those clusters or even to their overlapping. To maintain the discriminating power of clusters
(generic views), we must ensure that they are
sufficiently distant. In this context, we have proposed to use an inter-cluster threshold. This allows maintaining the cluster stability. Moreover, increasing the dissimilarity between clusters can reduce noise and increase the clustering precision.
In our future works, we will study the impact of inter-cluster threshold on clusters generated by our clustering process and we will show in detail the cost of transforming generic views (representatives of clusters).
REFRENCES:
[1] Champin P-A., Solnon C.,"Measuring the similarity of labeled graphs". Dans 5th Int. Conf. On Case-Based Reasoning (ICCBR 2003), Kevin D. Ashley and Derek G. Bridge ed. Trondheim (NO). pp. 80-95. LNAI 2689. Springer Berlin. 2003.
[2] Costa, G., G. Manco, R. Ortale, et A. Tagarelli, "A Tree-Based Approach to Clustering XML Documents by Structure". In PKDD, 2004, p
137–148.
[3] Dalamagas T., Cheng T., Winkel K-J, Sellis T.K. 2006, "A methodology for clustering XML documents by structure". Information Systems 31(3), 2006, p187-228.
[4] Djemal Karim, « De la modélisation à l’exploitation des documents à structures multiples », Thèse de Doctorat de l’Université de Paul Sabatier. - Toulouse, France, 2010. [5] Gentner D., "Structure-mapping: A theoretical
framework for analogy", Cognitive Science, 7, (Reprinted in A. Collins & E. E. Smith (Eds.), Readings in cognitive science: A perspective from psychology and artificial intelligence. Palo
Alto, CA: Kaufmann), 1983, p155-170.
[6] Harchaoui Z. et Bach F. "Image Classification with Segmentation Graph Kernels", Dans CVPR. IEEE, 2007.
[7] Idarrou, A., Mammass, D., Soulé-Dupuy, C., and Vallès-Parlangeau, N.,"A generic Approach to the Classification of Multimedia Documents: a Structures Comparison" ", In ICGST-ICISP
Special Issue on GVIP, December 2010.
[8] Idarrou A., Mammass D. 2012, "Structural
Clustering Multimedia Documents: An
Approach based on Semantic Sub-graph
Isomorphism". International Journal of
Computer Applications 51(1):14-21, August 2012. Published by Foundation of Computer Science, USA, Vol. 51 N. 1, August 2012. Accès:http://www.ijcaonline.org/archives/volum e51/number1/8005-1343.
[9] Ali Idarrou, Chantal Soulé-Dupuy, Nathalie
Vallés-Parlangeau. Classification structurelle
des documents multimédias basée sur
l’appariement des graphes (regular
paper). Dans : INFormatique des Organisations et Systemes d'Information et de Decision INFORSID, Montpellier (France), 29/05/2012-31/05/2012, Association INFORSID, 2012, p. 539-554.
[10] Kutty S., Tran, T., Nayak, R., et Li, Y. "Clustering XML Documents Using Closed Frequent Subtrees" : A Structural Similarity Approach‖. Lecture Notes In Computer Science, , 2008, p183-194.
[11] Mbarki M. 2008, Gestion de l’hétérogénéité documentaire : le cas d’un entrepôt de documents multimédias., Thèse de Doctorat de l’Université de Paul Sabatier, Toulouse 3 France, 2008.
[12] Portier P-E, « Construction des Documents Multistructurés dans le Contexte des Humanités Numériques », Thèse de Doctorat de l’INSA De Lyon France, 2010.
[13] Razo F. D., A. Laurent, et Teisseire M., « Représentation efficace des arborescences
pour la recherche des sous-structures
fréquentes », In Actes de l'atelier Fouille de données complexes, Conférence Extraction et Gestion des Connaissances (EGC 2005), pp. 113.120.
[14] Tagarelli A., Greco S., "Semantic clustering of XML documents". ACM Trans. Inf. Syst. 28(1), 2010.
[15] Termier A., Rousset, M. C., et Sebag, M., "TreeFinder: a First Step towards XML Data Mining", Proceedings of the IEEE International Conference on Data Mining (ICDM'02), IEEE
Computer Society Washington, DC, USA, 450.
[16] Vercoustre, A. M., Fegas, M., Lechevallier, Y., Despeyroux, T., et Rocquencourt, I. « Classification de documents XML à partir d'une représentation linéaire des arbres de ces documents ». Paris, France, 1006, p433–444 . [17] Saleem Khalid. "schema matching and
ISSN: 1992-8645 www.jatit.org E-ISSN: 1817-3195
43 Doctorat de L’Université Montpellier II, France, 2008.
![Table 1: Comparison between our measure, Jaccard’s measure and [11]’s measure](https://thumb-us.123doks.com/thumbv2/123dok_us/8909065.958319/6.612.313.528.311.395/table-comparison-measure-jaccard-s-measure-s-measure.webp)