ISSN: 1992-8645 www.jatit.org E-ISSN: 1817-3195
RECOGNITION OF OTOLITHS HAVING A HIGH SHAPE
SIMILARITY
1
EL HABOUZ YOUSSEF*, 1ES-SAADY YOUSSEF, 1EL YASSA MOSTAFA, 1MAMMASS DRISS, 2NOUBOUD FATHALLAH, 2CHALIFOUR ALAIN AND 3MANCHIH KHALID
1IRF-SIC Laboratory, University Ibn Zohr, Agadir, MOROCCO
2
LIRICS Laboratory, University Trois-Rivières, Québec, CANADA
3 Laboratory of biology and ecology of the National Fisheries Research Institute (INRH) MOROCCO E-mail*: [email protected]
ABSTRACT
In recent years, several approaches have been proposed in the recognition of fish species using the otolith shape. Some techniques give good recognition results when otoliths have different forms, but when we have a high shape similarity, the recognition is not completely successful. In order to ensure a sustainable exploitation of fisheries resources, and help scientists to detect the poor of certain demersal stocks in their countries, we present in this paper a new approach for recognition of fish species by image analysis based on the extraction of the median distance of otoliths contour. To show the efficiency of the approach proposed, we have tested this approach on an otoliths database which have a high similarity in external otolith form. This database of otoliths is from Moroccan Atlantic Ocean and it contains 162 otoliths image
of three species of the genus Merluccius (Merluccius merluccius, Merluccius polli and Merluccius
senegalensis). The correct classification rate obtained was 96%.
Keywords: Otoliths, Shape Analysis, High Shape Similarity, Pattern Recognition, Classification.
1. INTRODUCTION
Otoliths are located in the inner ear of bony fishes. They are composed by calcium carbonate crystals and organic materials of proteic origin (Fig. 3).The shapes of otoliths are characterized by a high morphological variability [1]. So the analysis of otolith shapes is pertinent and widely used to identify species and populations, as well as being
applied in taxonomical, phytogentical,
palaeontological, and food web studies ([1], [2]). Also in some cases, it has been used for the
discrimination of populations and other
intraspecific forms [3].
The development of image processing methods has been essential to describe otolith shapes [4]. However, the using of the shape analysis to characterize otolith outlines has become a powerful and cheap tool with increasing popularity [5]. A variety of good results has been reported in the case of otoliths which have different shapes ([5], [6], [7], [8], [9]), usually by applying classical complex Fourier Descriptors (CFD) or elliptical Fourier analysis (EFA) [10]. EFA method decomposes the contour of an otolith in a series of harmonics. EFA outperforms CFD in the classification of otoliths in the case of complex shapes.
In this study we propose a new technique to discriminate between otoliths which have a high
similarity in external form. This technique is based on the extraction of the median distance of otoliths contour.
Our approach was tested on an otoliths dataset from Moroccan Atlantic Ocean (Fig. 2) and it contains 162 otoliths image of three species of the
genus Merluccius: Merluccius merluccius,
Merluccius polli and Merluccius senegalensis (for more biological information about those species see the reference [11]). It is difficult to distinguish between the three species using the external shape of the fish (Fig 1) or otoliths (Fig 3).This makes the monitoring of these three species difficult. The method proposed proved a high performance compared to the most used approaches in this area of researches (EFDs and CFDs).
ISSN: 1992-8645 www.jatit.org E-ISSN: 1817-3195
Figure 1: Illustrations Of Three Species Of The Genus
Merluccius[11].
2. MATERIALS AND METHODS
2.1 Otoliths Datasets
[image:2.612.313.527.221.339.2]The Method presented in this paper has been tested in a local otolith dataset (DB) from the Moroccan Atlantic area (Fig. 2) which was acquired and prepared during our work. These otoliths are collected by the National Institute of Fisheries research (INRH1) scientists, from 2002 to 2014, during biological sampling operations carried out on the research vessels and trawlers commercial landing. After the collection operation, we proceed to the otolith image acquisition process using the following tools: a stereo microscope Leica S8 APO, Leica camera EC3 connected to a PC and the Leica LAS EZ software (Version 3.0.0 for windows), for a high resolution, the microscope is adjusted according to the otolith size.
Figure 2: Map Showing The Study Area Between Laarache In The North And Dakhla In The South.
1
INRH website: http://www.inrh.ma/
The DB database contains 162 images from 3 different species of the genus Merluccius.For each species, we took 54 otoliths images. Below an
abbreviation of species names: Merluccius
merluccius: (MM), Merluccius polli: (MP) and Merluccius senegalensis (MS). In the figure 3, we show an example of three otoliths images species.
[image:2.612.99.295.478.679.2]All these otoliths have almost the same shape. This similarity makes the problem more challenging and the conditions more real.
Figure 3: Examples Of Fish Otolith Images From Local Database DB: (a) Merluccius Merluccis, (b) Merluccius Polli, (c) Merluccius Senegalensis.
2.2 Otolith Image Preprocessing
Each otolith image of DB was taken against a homogeneous black background to achieve good contrast and therefore a good representation of its contour. After that, we apply a thresholding method to eliminate the noise inside of the otolith image. This noise is related to the rest of the product which used for cleaning otoliths.We showed in Figure 4 the influence of the noise in the result of contour extraction method without denoising the original image.
Figure 4: Contour Extraction without Denoising of The Original Image: (a) Original Image Of MM Species And
[image:2.612.336.504.531.689.2]ISSN: 1992-8645 www.jatit.org E-ISSN: 1817-3195 When we get the threshold image, we apply the
canny method [12] to extract the otolith contour. We presented in figure 5 an example of otolith contour.This figure contains 3 images of 3 species
of the genus Merluccius. Visually, the three otoliths
contour are almost similar.
Figure 5: Otoliths Contour Extraction: - (a) In the
Left: Otlolith Image of MM and in the Right it’s Contour Extraction. - (b) In the Left: Otlolith Image of MP and in the Right the Contour Extraction, (c) in the Left: Otlolith Image of MS and in the Right it’s Contour Extraction.
The next step after the contour extraction of otolith is to make a standard orientation of all otolith images. To do that: we rotate the otoltih shape using the angle between the main and the horizontal axes of otolith.
2.3 Features extraction
After the preprocessing of otolith images, we extract the features which will be used in the classification phase. In this paper we will propose a method based on a vector of otolith contour distances. We will explain the principle of this technique below:
We equally divide the main axis of each otolith contour to n+1 sub-segment. This sub-segment intersects the contour in two sides top and low called respectively ai and bi. Afterward, we calculate the distance Di between ai and bi for each sub-segment. From these distance values we
construct the vector . We
[image:3.612.313.535.78.156.2]normalize the vector V by dividing each component by the length of the main axis in order to make this approach invariant to the scale change. Therefore, the vector V is used for training Neural Network in the classification phase.
Figure 6:.Median Distance Contour of Otolith: Merluccius merluccius.
We show in Figure 6 a real example of the vector distances extraction: The number of subdivision in this example is n=40, in this case the length of the
vector V is 40 elements
with: .
2.4 Classification Method
The performance of the classification phase depends on the chosen classification algorithms. In this work, we chose a multi-layer perceptron architecture using the back propagation gradient network ([13], [14], [15]). This network consists of three or more neuron layers: input layer, output layer and at least one hidden layer. In most cases, a network with only one hidden layer is used to restrict the calculation time, especially when we obtained an efficient results [16]. The Figure.7 presents the Artificial Neural Networks (ANN) Architecture. The NN comprised 40 input neurons (number of features), 3 output neurons (number of classes) and the number of neurons in the hidden layer was empirically determined. Every neuron of each layer (except the neurons of the last one) is connected to the neurons of the next layer. The network was trained with the available data. The combination of output vector and known input is called learning sample. The predicted output is compared with the known value. The weights on the arcs are adjusted depending to the prediction of the actual result. The sigmoidal transfer function is used for generating an output at each stage. The results of this phase are presented in the next section.
[image:3.612.91.297.167.317.2] [image:3.612.340.503.614.695.2]ISSN: 1992-8645 www.jatit.org E-ISSN: 1817-3195
3. EXPERIMENTAL RESULTS
We presented a comparative study of our proposed method results on DB1 dataset, and the results of the most methods on fish species classification: complex Fourier descriptor, elliptic Fourier descriptor. The results present the number of otoliths correctly identified from the total otoliths number of each fish species (table 1).
Table 1: The Results of the Proposed Method and the
Most Preferment Methods on Classification of Fish Species.
Fish species
Methods Complex
Fourier descriptor
Elliptic Fourier descriptor
Our Approach
Merluccius merluccius
37/54 42/54 52/54
Merluccius polli
42/54 46/54 54/54
Merluccius senegalensis
35/54 41/54 51/54
Classification Rate
70,3 % 79.6% 96.9%
Having used our approach, we obtained a higher classifications rate (96.9%) (Tab. 1). The proposed approach recognizes all otoliths species of the experiment on DB dataset except two samples of Merluccius merluccius and three of Merluccius senegalensis, which are not correctly classified. This shows that the classification features proposed offer a significant improvement to the recognition performance.
[image:4.612.314.519.181.386.2]The details of the classification results are reported in figure 9. We have used 70% of images for training the neural network, 15% for testing and 15% for validation. Figure 8 shows an efficient validation results.
Figure 8: Validation Results after Training: the Best Validation Performance is 0.042076 at Epoch 78.
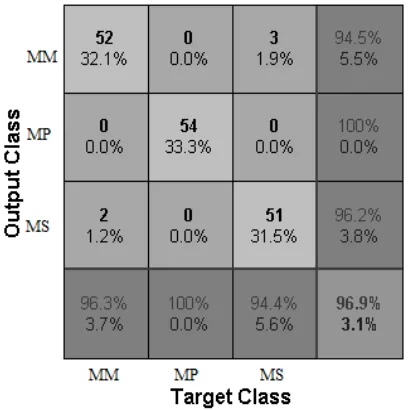
The figure 9 presents the confusion matrix of the proposed approach on DB dataset. The study of this confusion matrix showed that all otolith images of MP, 52 of MM and 51 of MS are correctly recognized, but there is confusion between MM and MS otoliths: 2 otoliths of MM are classified as MS and 3 otoliths of MS are recognized as MM.
Figure 9: Confusion Matrix of the System on Otoliths Database DB
4. CONCLUSION AND FUTURE WORK
[image:4.612.88.301.233.389.2] [image:4.612.90.301.564.670.2]ISSN: 1992-8645 www.jatit.org E-ISSN: 1817-3195 REFRENCES:
[1] C. Platt, and A.N Popper,"Fine structure and function of the ear". Hearing and sound communication in fishes. Springer New York, 1981, pp. 3-38.
[2] W. Schmidt, “The otoliths as a means for differentiation between species of fish of very similar appearance”. In: Proc. Symp. Oceanog. Fish. Res. Trop. Atl., UNESCO, FAO, OAU, 1969, pp. 393-396.
[3] M.L. Tyagun, P.N. Anoshko, and M.G. Voronov, “Otolith shape analysis to discriminate among morpho-ecological groups of Baikal omul (Coregonus migratorius Georgi)”. Advances in Limnology, Vol. 64, 2013, pp. 109-118.
[4] J. Piera, V. Parisi-Baradad, E. García-Ladona, A. Lombarte, L. Recasens, and J. Cabestany, ”Otolith shape feature extraction oriented to automatic classification with open distributed data”, Marine and Freshwater Research, Vol. 56, No. 5, 2005, pp. 805-814.
[5] A. Harbitz, O.T Albert, “Pitfalls in stock discrimination by shape analysis of otolith
contours”, ICES Journal of Marine Science,
Vol. 72,2015, pp. 2090-2097.
[6] J.P. Keating, D. Brophy, R.A. Officer, and E. Mullins,”Otolith shape analysis of blue whiting suggests a complex stock structure at their spawning grounds in the Northeast Atlantic”. Fisheries Research, 2014, V. 157, pp. 1–6. [7] R. Reig-Bolaño, P. Marti-Puig, S. Rodríguez,J.
Bajo, V. Parisi-Baradad, and A. Lombarte, “Otoliths identifiers using image contours EFD”. In Distributed Computing and Artificial Intelligence, Springer Berlin Heidelberg, 2010, pp. 9-16.
[8] C. Stransky, H. Baumann, S.E. Fevolden, A. Harbitz, H. Høie, K. Nedreaas, A.B. Salberg,, et al, ”Separation of Norwegian coastal cod and Northeast Arctic cod by outer otolith shape analysis”, Fisheries Research, Vol. 90, No. 1, 2008, pp. 26–35.
[9] I.G. Jonsdottir, S.E Campana, and G. Marteinsdottir, “Otolith shape and temporal stability of spawning groups of Icelandic cod (Gadusmorhua L.)”. ICES Journal of Marine Science, Vol. 63, 2006, pp. 1501–1512.
[10] F.P. Kuhl, and C.R. Giardina, “Elliptic features of a closed contour”, Computer Graphics and Image Processing, Vol. 18, 1982, pp. 237–258.
[11] D. Lloris, J. Matallanas, P. Oliver, “Merluzas del mundo (Familia Merlucciidae): Catálogo comentado e ilustrado de las merluzas conocidas”, Food & Agriculture Org., No. 2, 2003, pp. 57.
[12] J. Canny, “A computational approach to edge detection”. Pattern Analysis and Machine Intelligence, IEEE Transactions on, No. 6, 1986, pp. 679-698.
[13] P.R. Kumar, M.V. Murthy, D. Eashwar, and M.
Venkatdas,”Time series modeling using
artificial neural networks”, Journal of
Theoretical & Applied Information Technology, Vol. 4, No. 12, 2008.
[14] I.A. Basheer, and M. Hajmeer, "Artificial neural networks: fundamentals, computing,
design, and application", Journal of
microbiological methods, Vol. 43, No. 1, 2000, pp. 3-31.
[15] Williams, DE Rumelhart GE Hinton RJ, and G. E. Hinton. "Learning representations by back-propagating errors", Nature, Vol. 323, 1986, pp. 533-538.
![Figure 1: Illustrations Of Three Species Of The Genus Merluccius [11].](https://thumb-us.123doks.com/thumbv2/123dok_us/8909329.958443/2.612.336.504.531.689/figure-illustrations-species-genus-merluccius.webp)