LIQUID LEVEL DETECTION SYSTEM WITH A LABVIEW
BASED PC USING AN ELECTROMAGNETIC
DISPLACEMENT SENSOR
1ZAKARYAE.EZZOUINE, 2ABDELRHANI.NAKHELI
1
Laboratory Spectrometry of Materials and Archaeomaterials (LASMAR), Faculty of Science, Moulay
Ismail University, BP 11201 Zitoune, Meknes, Morocco.
2
Electrical Engineering Departments, High School of Technology, ESTM , Moulay Ismail University,
Meknes, Morocco.
E-mail: [email protected] , [email protected]
ABSTRACT
The purpose of presented paper is to demonstrate an innovative dynamic system operating in real time for low cost that allows liquid level Monitoring. The system is based on an electromagnetic sensor for detecting water level by measuring the distance between water surface and the submerged part of the displacer of sensor .The system was implemented with a PC running National Instruments via the NI-USB-6281 data acquisition device. Where we have developed a graphical user interface (GUI) by utilizing LabVIEW software, for acquire and monitor the information obtained by the sensor and displaying the liquid level accurately at distances up to 65 centimeters. By this method we can measure the variations of water ranges between 1mm and 5mm.
Keywords: Liquid Level Detection, Electromagnetic displacement Sensor, Indicator glass displacer, LabVIEW, Data Acquisition, Graphical User Interface (GUI).
1. INTRODUCTION
Liquid level measurement and monitoring systems have always pulled the attention of industry for its very important manipulated parameter of level, which finds many applications in various fields [1].
A wide range of level sensor measurement systems are made available for addressing the various parameters such as a wide range of applications, high-accuracy needs, and system
installation requirements and practices.
Measurement technologies are made available in different versions to address a wide range of measurement needs, or to address a specific application. Liquid level sensors are termed as the sensors used for detecting liquid levels or interfaces between liquids such as water and oil or solids and liquids. These sensors can also be defined as transducers or as integrated systems with instrumentation and control capabilities. This type of liquid level sensor is one of the most important sensors and plays a vital role in variety of industrial and consumer applications. Industrial applications
include liquid-level sensing in transport tanks, storage tanks and water treatment tanks, and also in the petrochemical industries for sensing liquids such as petrol, diesel and other fuels. Liquid level
measurement is significant in household
applications including electronic devices such as, water dispensers, water evaporators, steamers, monitoring system of boilers, heating systems, washing machines, steam irons, juice squeezers, automated-coffee machines, etc. Level sensors are designed for specific applications compared to general applications [2].
various techniques based on different operating principles to measure the liquid level has been implemented in industrial applications, such as, mechanical, capacitive [3], inductive, acoustic [4, 5-6], heating [7],visual [8], ultrasonic [9-10], or optical [11-14].
electrical components) , this system can allow for installation in tanks where other systems won’t fit. Most importantly, where capacitance, ultrasonics, and radar level systems will fail when there’s foam on the surface of your liquid tank, the presented level liquid will work. It also works reliably in the presence of vapors, and, unlike ultrasonics, can be used in very high media temperatures.
In the work reported here, we describe a newly
experimental setup with a computer-aided
measuring system for liquid level detection. The experimental setup based an electromagnetic displacement sensor with probe (glass displacer), conditioning circuit, and syringe pump and acquisition card. The aim of this paper is to develop
prototype experimental for liquid level
measurement with a graphical user interface for visualization, control and monitoring of liquid level data in real-time using DAQ (NI USB-6281) board and LabVIEW program software.
2. STRUCTURE AND PRINCIPLE OF DISPLACEMENT SENSOR
The proposed sensor is a displacement electromagnetic sensor. Its operating principle is based on the phenomenon of influence with magnetic induction between two flat coils of the same diameter (2cm) and having the same number of coil turns (30) made by a copper conductor wire of a section 0, 06 mm, placed in parallel. One of the flat coils (Fixed Coil) is fixed on an insulating horizontal support and the other flat coil (Moving Coil) is wound on an insulating cylinder of 2 cm in diameter, the lower extremity passes through the free surface formed by the coil fixed, and the upper extremity is connected to a spring which is itself attached to a fixed support. At the lower extremity of the cylinder that acts as a guide, we set a hook for hanging masses.
The entire system formed (fixed flat coil, guide roller, spring and moving flat coil) is aligned on the same vertical axis (See Fig. 1).
Figure1: Displacement electromagnetic sensor: 1, Guide cylinder; 2, calibred spring; 3, Receiver coil (Moving
coil); 4, Transmitter coil; 5, Hook.
The cylinder is movable vertically upwards or downwards virtually without friction, when we exert a force on its lower extremity[15-16], which has the effect of extending or compressing the spring, it bring closer or away the guide cylinder (moving coil) from the fixed coil.
The fixed coil is supplied by a low frequency generator of a frequency f0 = 16 KHz
[image:2.612.312.522.74.295.2]whose phase conditions and amplification are satisfied; therefore, it is traversed by a sinusoidal current which creates a sinusoidal magnetic induction variable along its axis (Fig. 2).
Figure 2: Illustration of coil conductivity principle.
This induction produces a variable flux Φ and a variable induced electromotive force (EMF) on the electrons of the other coil (moving coil) equal to:
dt
d
The maximum value of the EMF induced depends on the distance z between the two coils, the flux
Φ
is proportional to the magnetic induction B that changes as a function of z are given by the following relation:
2 / 3 2 2
2 0
) ( 2 ) (
z R
R I N z
B
+ ×
× × × =
µ
, (3) Where I is The maximum amplitude of the current flowing through the coil, R is the coil radius and z is the distance between the two coils. The magnetic field created by the transmitter coil is at a maximum at the center of the coil z = 0, the above formula became simple:
R
I N B
2 )
0
( = µ0 × × , (4)
More details about the electromagnetic sensor system can be found elsewhere [15-16].
3. MATERIALS AND METHODS
3.1 Experimental Set-Up
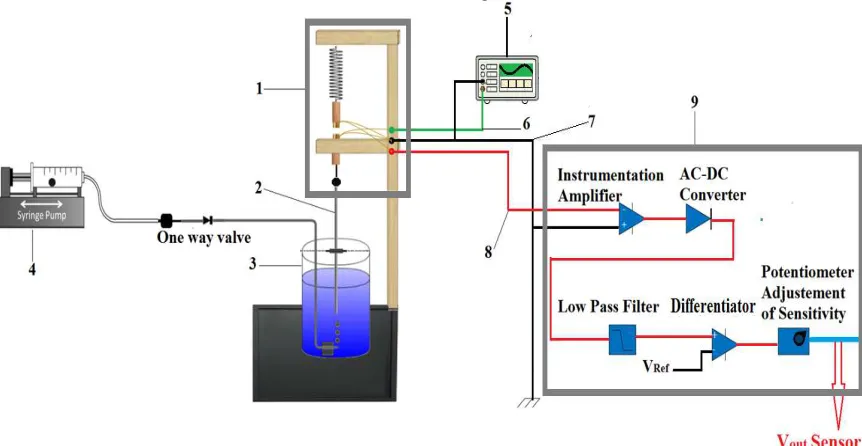
The Experimental setup can be divided into five principal parts as shown in Figure 3: the electromagnetic level sensor; probe or displacer; the conditioning circuit; the syringe pump and water tank. The water tank was constructed of a 14cm diameter vertical Plexiglas tube that is approximately 80cm high.
The water reservoir and the syringe pump for this system are connected with a manually operable valve between them via a hose that recirculated water. The water tank has a same inflow and outflow of water which is being pumped by the system we cited above.
[image:3.612.92.523.338.561.2]Glass Probe is used for water level indication by touching water level through water level sensor. The submerged surface of the glass probe will vary proportionally with the liquid level change in the water reservoir.
Figure 3: Experimental Set-Up.1,Electromagnetic Displacement Sensor;2, Glass Probe for Detection;3, Water Tank ;4, Syringe Pump;5, Low Frequency Generator ;6, Wire for The Fixed Coil ;7, Wire Connects to Ground; 8, Wire For
The Mobile Coil;9,Conditioning Circuit.
In Figure 3 two wires are connected with the conditioning circuit for adapting the out voltage of the sensor and one wire connected with the Low frequency generator for the fixed coil supply.
3.2 The Conditioning Circuit
As shown in Figure 4,5and6 the conditioning circuit of liquid-level monitoring signal path has three stages. For that reason,
stabilizing and increasing the out sensor voltage requires several processes.
The first step is finding the gain of the amplifier and multiplying this gain with the sensor voltage, finding the gain of an amplifier stage can be cumbersome.
impedance to the sensor (at VSENSOR) and produces
a positive gain from VSENSOR to V1.
(Figure 4) used in the application can be seen in equations 5 and 6.
Figure 4: Non-Inverting Gain Amplifier For High-Impedance Sensors With Voltage Output.
opAmp SENSOR
V
R
R
V
1 2
1
=
, (5)opAmp sensor
V
R
R
R
R
V
V
1 2
3 4 1
2
=
=
*
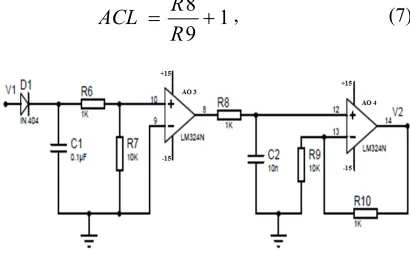
, (6)The circuit shown in Figure 5 is composed of a full-wave rectifier circuit, a low-pass RC filter followed by an operational amplifier, the closed loop gain is:
1
9
8
+
=
R
R
[image:4.612.91.527.70.417.2]ACL
, (7)Figure 5:Full-Wave Rectifier Circuit And Low Pass
Butterworth Filter
[image:4.612.91.296.440.572.2]The function of the electromagnetic sensor as described in the preceding paragraph, when the inter coil distance decreases the output voltage becomes maximum, so for detecting the ascent and descentof liquid, a differentiator is added to reverse the sensor behavior.
Figure.6 Differentiator Circuit And Potentiometer For Adjustment
The resistor values of differentiator circuit are equal; this amplifier will have a differential voltage gain of 1. The analysis of this circuit is essentially the same as that of an inverting amplifier ،Therefore:
2
V
V
V
OUTdifferentiator=
potentiometer−
, (8)The conditioning circuit also includes an adjustable control potentiometer resistor used to adjust the sensitivity of sensor.
3.3 Water Level Controller
Water pump can be controlled by connecting with a one way valve via the syringe pump. The device used is the pump that set the industry standard "The Harvard 22 syringe pump». This Water pump can be controlled by connecting with an input pin of DAQ NI USB-6281 via a cable. With this pump we have developed a panel control Unit using LabVIEW allows user to start or stop the pump, change the pumping direction, change the flow rate, pump a precise volume and stop, pause the pump and even ramp up or ramp down the flow rate at a distance from the pump.
Specifications of the syringe pump:
- Voltage Range 95 to 130 VAC, 60 Hz; 220 to 260 VAC, 50 Hz, selectable
- Accuracy ±0.35% - Reproducibility ±0.05%
- Syringes Size: Minimum 0.5 ml, Maximum 140 ml.
For complete details and specifications on this pump please see [17-18].
3.4 Measurement Procedure
support a column of glass probe (displacer) decreases by the weight of the liquid displaced. A force transducer measures the support force and converts to displacement by the transducer (calibrated spring) and the reports it as an analog signal.
The working of an electromagnetic level sensor is explained here to measure the level of liquid. The sensor constitute of a two concentric coils separated by a small distance z as we have already seen in the preceding paragraph, the glass probe is mounted vertically in water tank center and is long enough to cover the length over which level indication is required. a change of liquid level in the water reservoir causes an ultimate change in the surface submerged of a glass probe, thereby due to which the distance inter coil z changed, thereby changing the sensor out voltage.
The data experimental is interfaced to the
computer connected through the National
[image:5.612.314.524.304.506.2]Instruments multifunctional NI USB-6281 data acquisition module card which can support 16 analog inputs and 2 analog outputs channels with a voltage ranging between ±12 Volts. The sampling rate of the acquisition card module is 625Ks/S with 18 bit resolution. The graphical program written in LabVIEW is then linked to the set up through the acquisition module.
Figure 7: Block Diagram OF Electromagnetic Water Level Detector.
The physical and electrical connection between Experimental system, water Tank and DAQ is shown in figure 7. Analogue inputs
channels are configured for differential
measurements.
4. RESULTS AND DISCUSSIONS
4.1 Calibration of System
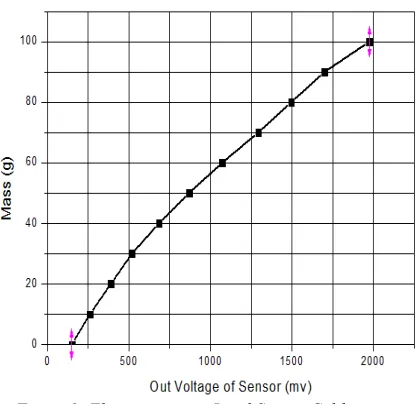
The calibration of system is very important for determining the curve characteristic of the sensor, the last one is obtained by hooking high-precision masses from 0g to 100g in steps of 10g, and we note the voltage values corresponding to each mass with a voltmeter of precision 0.01 mV. The curve response is not linear; it is rather parabolic in relation with the sensor sensitivity as a function of the distance between coils (See figure).
Figure 8: Electromagnetic Level Sensor Calibration: m=f (V).
The electromagnetic level sensor is comprised of a converter (a calibrated spring) that allows the Conversion of the masses in displacements. The curve of Determination of the displacement d=f (v) obtained by conversion the
masses in displacement while using the
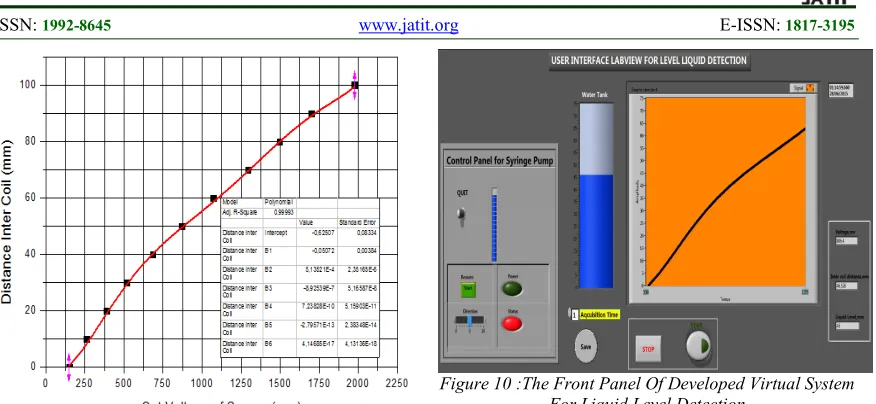
[image:5.612.92.291.457.701.2]Figure 9: Electromagnetic Dilatometer Calibration: d=f(V).
The fit polynomial to the curve shown in Figure 9 is of order 6, characterized by a standard deviation consistent with the experimental accuracy of the sensor (ΔV= ±0.01 mV), appears suitable:
∑
==
6 0*
)
(
j j i ji
B
v
mm
d
, (9)The coefficients of the polynomial fit are: B0 = -0.62507; B1 = - 0.05072; B2 = 5.14*E-4;
B3 = -8.93*E -7
; B4= -8.93*E -7
; B5= 7.24*E -10
; B6 = -2.8*E-13; B7= 4.15*E-17
The polynomial adjustment of the
displacement as a function of the voltage corresponding to the experimental accuracy of our sensor is as follows (equation 10):
0.62507
-0.05072V
-V
10
5.14
+
V
10
8.93
-V
10
7.24
+
V
10
2.8
-V
10
4.15
2 4 -3 7 -4 -10 5 -13 6 -17×
×
×
×
×
=
d
, (10)4.2 Water Level Measurement With The Experimental Setup
In order to demonstrate usability of the presented experimental set up, a virtual system for water level and measurement is developed. The system is designed to measure level in tanks up to 80 cm in height with 0.01 mm resolution.
[image:6.612.94.532.69.271.2]The implementation of the prototype of experimental set up system which consists of the electromagnetic sensor is shown in figure 10.
Figure 10 :The Front Panel Of Developed Virtual System For Liquid Level Detection
Table1 Shows the measured out voltage and distance inter coil of sensor according to liquid level during increasing time and decreasing time of liquid level. dI is the distance
inter coil when water level is increasing and dD is
the inter coil distance when water level decreasing . It can be observed that the inter coil distance between the dI and dD is below 4% for all the tested
[image:6.612.310.529.461.672.2]values.
Table 1: The Results Of Measured Inter Coil Distance Measured Out Voltage And Distance Inter Coil Of Sensor
According To Liquid Level During Increasing Time And Decreasing Time Of Water Level Acquisition.
Liquid level (mm) VI (mv) dI (mm) VD (mv) dD (mm)
[image:7.612.93.298.165.373.2]
Figure 11 and figure 12 show the resulting plots of the measured inter coil distance for different levels of water in the range 0 mm and 65mm. In operation, as the liquid level rises and falls, the measured inter coil distance decreases and increases, respectively.
Figure 11: Trend Lines For The System Of Measurement With Rising Water Level.
Equation for determining the rising water level:
-1 I
-3
d
-
14.899
*
10
10
*
922
.
9
9
×
=
I
[image:7.612.94.298.422.657.2]L
, (11)Figure 12: Trend Lines For The System Of Measurement With Lowering Water Level.
Equation for determining the lowering water level:
9
9
.
931
*
10
d
D6
6
.
5
-3+
×
−
=
D
L
, (12)The sensitivity of the system is between 0.04 mm/mv and 0.06 mm/mv. This result shows acceptable linear property for water level measurements.
5. CONCLUSION
In this study, we suggested low cost and a very simple well suited efficient measurement system to measure the level of liquid at real-time and to get accurate measurement of the maximum and minimum level of the tank. The proposed experimental set-up used an Electromagnetic displacement sensor. The sensor output was measured in the range 0 to 65 cm. The measured sensitivity was 0.06 mm/mv. In spite of the simplicity of the designed prototype, the characteristics of the sensor showed acceptable results such as sensitivity and linearity. The model identification and controller design were done using an NI-DAQmx 6281 data acquisition card and LabVIEW. Graphical programming was used to implement the whole experiment to realize the level setting, monitoring, displaying and recording in real time through the computer system. Finally, this work provides a complete solution for direct and accurate liquid level control; the presented sensor has the advantages of low energy, good repeatability, and high linearity. The major disadvantage of this method is the corrosion resistance and the movement of the displacer.
REFRENCES:
[1] M.Kalyan Chakravarthi, Nithya Venkatesan,
Labview Based Tuning of Pi Controllers For a Real Time Non Linear Process, Journal of Theoretical and Applied Information Technology, Vol. 68 No.3, October 2014, PP 579-585.
[2] http://www.efxkits.co.uk/liquid-level-sensor-and-types-of-level-sensors/
[3] H. Canbolat, A novel level measurement technique using three capacitive sensors for liquids, IEEE Transactions on Instrumentation and Measurement, vol. 58, Oct 2009, pp. 3762– 3768.
[4] D. J. Soltz, “Parasitic echo pulse rejector for ultrasonic liquid level meter,” patent, 1989. [5] E. Vargas, R. Ceres, J. Martin, and L.
[6] K. Shannon, X. Li, Z. Wang, and J. D. N. Cheeke, Mode conversion and the path of acoustic in a partially water-filled aluminum tube, Ultrasonics, vol. 37, No. 3, 1999, pp. 303-307,.
[7] M. Aoyagi, T. Hiraguri, T. Ueno, and M. Okuda, Observation of container liquid levels by dynamic heat conduction, Insight - Non-Destructive Testing and Condition Monitoring, vol. 55, January 2013, pp. 10–15. [8] C. Gaber, K. Chetehouna, H. Laurent, C.
Rosenberger, and S. Baron, “Optical sensor system using computer vision for the level measurement in oil tankers,” in IEEE International Symposium on Industrial Electronics, 2008. ISIE 2008, pp. 1120–1124, 2008.
[9] E. J. Chern and B. B. Djordjevic, “Nonintrusive ultrasonic low-liquid-level sensor”, Meterials Evaluation, vol. 48, no. 4, pp. 481-485, 1990. [10] Warsito, G. A. Pauzi, S. W. Suciyati, K.
Imaniar , Study Of Inclination Angle of Reflector Object In Simple Water Level
Instrument Using 40 Khz Ultrasonic
Transducer, Journal of Theoretical and Applied Information Technology, Vol. 42 No.1, August 2012, pp.26-30.
[11] N. B. Manik, S. C. Mukherjee, and A. N. Basu, Studies on the propagation of light from a light-emitting diode through a glass tube and development of an optosensor for the continuous detection of liquid level, Optical Engineering, vol. 40, No. 12, 2001 ,pp. 2830-2836.
[12] C. Yang, S. Chen , and G. Yang, “Fiber optical
liquid level sensor under cryogenic
environment”, Sensor and Actuators A:
Physical, vol. 94, No. 1-2, 2001, pp. 69-75. [13] D. J. Weiss, Fluorescent optical liquid-level
sensor, Optical Engineering, vol. 39, No. 8, 2000, pp. 2198-2213.
[14] D. Sengupta, M. S. Shankar, P. Reddy, R. S. Prasad, and K.Srimannarayana, A simple underground liquid level sensor using fbg, in AIP Conference Proceedings, American Institute of Physics, vol. 1391, October 2011, pp. 431 – 433.
[15] Z. Abbassi, A. Benabdellah, A. Nakheli, New Electromagnetic Force Sensor: Measuring the Density of Liquids, International Journal of Research in Engineering and Technology, Vol-03, No.09, Sep-2014, pp.83-90.
[16] Z.Ezzouine , A.Nakheli, Conception of water level detector (TIDE-GAUGE) based on a electromagnetic sensor of force, International Journal of Research in Engineering and Technology,Vol-03, No.10, Oct-2014, pp. 164-169.
[17] Available on web site:
http://academic.evergreen.edu/projects/biophysic s/files/pump22_serial.htm