SEPT-OCT 2016, VOL-4/26 www.srjis.com Page 2962 DESIGN OF AUTOMATIC COUNTING CELLS IN PHERIPHERAL BLOOD
SMEAR USING COMPUTER VISION
Cerón-Franco Aureliano & Ramírez-Torres Flor
Departamento de Metal Mecánica, Instituto Tecnológico de Hermosillo Hermosillo, México
The purpose of this study was to improve the cell counting procedure of peripheral blood smear in clinical analysis using an automatic identification system to sort Lymphocytes and Segmented Neutrophils, with the graphical programming environment LabVIEWTM. The process involves the acquisition of samples images through a digital microscope, applying color filters to locate and extract the cells of interest and a threshold process in order to obtain some parameters to determine the cell type. The software was designed to reach a predetermined number of cells. In addition, it gives the percentage of Lymphocytes and Segmented Neutrophils of the total sample.
Keywords: Computer vision, LabVIEWTM, peripheral blood smears, Lymphocyte, Segmented Neutrophils.
1. Introduction
The peripheral blood smear is a test that provides information about the number and shape of
blood cells through a visual inspection with a microscope. It is useful as a complement to the
Complete Blood Count (CBC) that helps in the diagnosis of several hematological diseases.
There are some automatic analyzers that stains blood smears according to the established
criteria; however, in many places is still used the manual preparation of the smear, Jaime &
Gómez (2009).
The automatically obtaining of results by performing blood tests (differential blood count)
has displaced citomorphological visual count of blood composition. Automatic devices record
the appearance of pathological elements. However, as qualitative identification is complicated,
this procedure must be performed manually. Today, a good morphological assessment of Scholarly Research Journal's is licensed Based on a work at www.srjis.com
SEPT-OCT 2016, VOL-4/26 www.srjis.com Page 2963 blood smears is the basis for a good hematological diagnosis. The correct valuation of cellular
findings depends largely on the quality of smear and proper staining.
Currently, it is possible to find numerous research papers on the field of computer vision
using LabVIEW™ tools. They achieved their goals in different fields of vision applications.
Therefore, some references that were a product of research projects with these characteristics
will be mentioned.
The field of medicine has used LabVIEW™ vision modules for different applications, as
example Manjula Sri et al. (2013) propose a new algorithm to detect glaucoma with images
based on color and the use of circular fitting techniques to measure the diameter of the retina.
In particular, the algorithm automatically locates and calculates the ratio between the optic
disc and the cup of the retina. Among the results presented, there is a database between normal
eyes and eyes posing glaucoma, and suggest that the system can be used in rural areas of
India, where exist a large deficit of ophthalmologists, and thus, prevent patients having to
travel long distances for diagnosis.
Regarding the analysis of peripheral blood smears for malaria diagnosis, which exist
several examples of research conducted in this field. Reni et al. (2015) describes novel
pre-processing techniques for the analysis of thin-film microscopic images of blood infected with
the malaria parasite. The system provided an accuracy of 99.5% in removing the platelets and
artifacts with a False Positive and False Negative rate of 0.3% and 0.08% respectively.
Angraaini et al. (2011) developed an accurate laboratory diagnostic tool of computerized
diagnosis of malaria and develop a novel image processing algorithm to reliably detect the
presence of malaria.
The authors use an algorithm that was designed as an expert system to process the images
that were subjected to gray-scale conversion to decrease image variability. It also was
implemented a Global thresholding to obtain Erythrocyte and other blood cell components.
Delahunt et al. (2015) designed a low-cost automated digital microscope coupled with a set of
computer vision and classification algorithms, which are able to identify and quantify parasite
load. Their prototype can accurately diagnose a variety of infectious diseases.
2. Methodology
A. Flowchart for algorithm
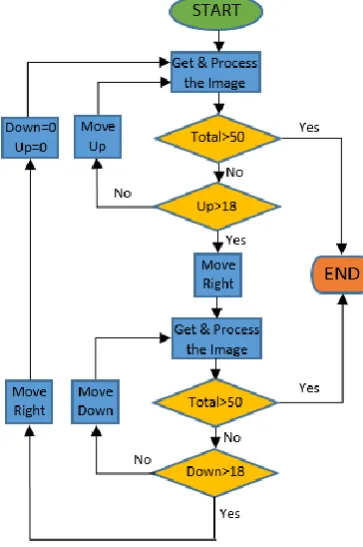
Figure 1 shows the execution of the program when an image is captured, which is
processed by the software to detect Lymphocytes or Segmented Neutrophils. Subsequently, by
SEPT-OCT 2016, VOL-4/26 www.srjis.com Page 2964 image is captured and processed. This method is repeated until the defined quantity by the user
is reached (In this case 18 images).
Once the images predefined by the user in that direction have been captured, electronic
signals are sent to the stepper motor that control the action of the axis X, inducing a movement
of the slide to the right. In that place, an image is taken, processed and the sequence of image
capturing in direction of the Y- axis starts. After capturing all the images in Y- direction, a
movement to right is executed; the counters for up and down motion are reset and the whole
process starts again. The algorithm described previously ensures a zigzag movement of the
[image:3.595.203.385.263.537.2]slide.
Fig. 1. Flowchart for the proposed algorithm to detect Lymphocytes
B. Materials and Methods
The method applied in the software basically consists in the acquisition of an image of a
blood smear through a digital microscope. A set of filters are applied to the image to locate the
color patterns of interest then submitted to a threshold process to get a cluster of parameters
which we can define the kind of cell that has been found in the processed image.
The required components to accomplish the automatic search and identification method of
the cells in a blood smear begins with a LaboMed CxL microscope, which provides an
SEPT-OCT 2016, VOL-4/26 www.srjis.com Page 2965 with magnifying power of x4, x10, x40 and x100. It also, includes a slot to insert a Dino-Eye
digital camera with USB connectivity.
In addition, we installed two unipolar stepper motors with their respective power stage
connected to a 5 VDC power supply. They are controlled by an Arduino© microcontroller,
which has digital I/O ports and a serial communication port. Finally, to make the identification
of the cells that we are searching, it is necessary that the LabVIEWTM software includes the
computer vision toolkit and the Arduino© communication module.
3. Implementation
It is intended to use the methodology for diagnosis of diseases related to blood Segmented
Neutrophils and Lymphocytes. The neutrophil is the most abundant Leukocyte on the
peripheral blood, comprising 35 to 70% of the total. Neutrophilia is called the increased
number of neutrophils in the blood, for which there are multiple causes such as the marginal
reserve mobilization generalized and localized acute infections. The lymphocyte is the second
most abundant leukocyte cell, 20 to 50%. Lymphocytosis is observed in viral infections,
mycobacteria, syphilis, toxoplasmosis and brucellosis. Jaime & Gómez (2009). If the
approximate number of Segmented Neutrophils or Lymphocytes in the blood is known, it is
possible to make an accurate diagnosis of a disease for each type of sample.
A. Model description
Control is made by a state machine with the purpose of doing zigzag movement of the
microscope stage in the whole test. The states shift between move on the two parallel axes of
the stage and with the image processing. Before start running the test, we need to put the blood
sample on the microscope and focus on their edge manually.
The first thing that software does is to take a picture of the sample, save it and make a
copy; the original will be showed on the front panel with resultant classification ROI’s
(Region of interest), and the copy will be used for the rest of the process.
The next step is to apply a Gamma and a Brightness reduction on the copy, and elevate
their Contrast; this will highlight the stained white blood cells with the background and create
a standard blue shade. Once the image is ready, a Color Location is applied to find the
coordinates of the cells; As a result, each cell deploys a group of matches because of the use of
a template four times smaller than the average Lymphocyte to include the separated nucleus in
the Segmented Neutrophils in the matches. An array of matches centers is used to define each
cell; the groups will be made based on their centers distances. If the matches are close enough,
SEPT-OCT 2016, VOL-4/26 www.srjis.com Page 2966 Each ROI created will be separated of the image copy to identify the cell type. This process
consists in a Color Plane Extraction, a Gaussian Smoothing Filter, a Threshold and a Particle
Filter. The resultant image goes through a Particle Analysis and is classified based on the
numbers of particles per ROI, the particle area and some relations of their geometry as the
Ratio of Equivalent Ellipse and their Heywood Circularity Factor.
When the cell is classified, a colored ROI will be overlayed on the original image: red for
the Lymphocyte and blue for the Segmented Neutrophils. It also, the Number of Matches will
be added to a counter on the Frontal Panel. After the whole image processing, the state
machine will change to the next frame according to the zigzag movement, or stop the program
when it reaches to the number of cells indicated.
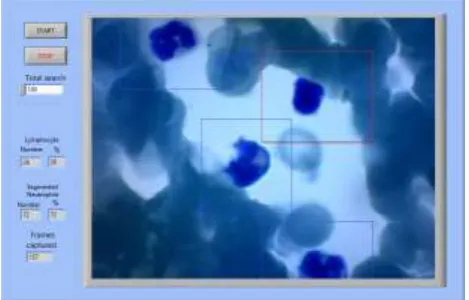
B. Front panel
The user interface has a simple design. The user only needs to specify the amount of cells
to find on the test by filling the “Total search” field and begin the test pressing the “START”
button. Once the program is running, the processed image will be shown with a color indicator
enclosing the cell. Figure 2 displays the front panel when the software detects a Lymphocyte
and Segmented Neutrophil overlaying a red and blue frame, respectively.
The numeric indicators are actualized while running, showing the number of cells found for
each type and the percentage they represent of the total. The “Frames captured” field indicates
the total of images captured by the program to reach the results. At last, the “STOP” button
[image:5.595.188.423.487.637.2]finalizes the process in case the user deems necessary.
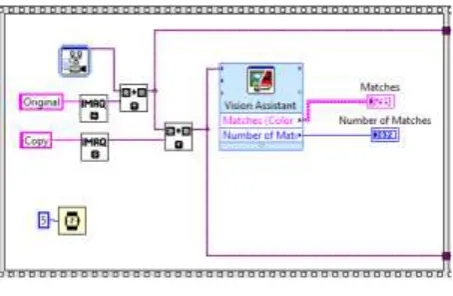
SEPT-OCT 2016, VOL-4/26 www.srjis.com Page 2967 Fig. 3. Image acquisition
C. Block diagram
The image processing is programed in a flat sequence beginning when the “START” button
is pressed; suddenly, the image acquisition occurs as represented on Figure 3, which consists
on the acquisition and storage of the image in two memory spaces, the “Original” and the
“Copy”. While the original image keeps untouched, the copy is processed by the Vision
Assistant, where a Color Location is applied after some color correction filters. The Matches
and Number of Matches obtained in the Vision Assistant are assigned on local variables.
The next frames use the Number of Matches to create an array with the coordinates of the
centers of the matches through For Loops and put them on ascending order according to the X
axis coordinate. Subsequently, each coordinate is compared with the next one and, when result
is a distance greater than 100 pixels, the group of centers is placed in a delimited section.
Every section defines the horizontal range where the cell of the match is placed, but it can hold
more than one cell, therefore, the same method is applied for every section but now using the
Y axis coordinate.
Each time a section is found, a cell counter is incremented by one. The final step of the
image processing consists in the classification of the cell; using the minimum and maximum
coordinates of each section, the ROI is calculated. Immediately, the image is cropped by that
ROI and goes into a Vision Assistant to obtain the parameters of the particle, which are used
to make a classification. According to results, a blue or red ROI is overlayed on the original
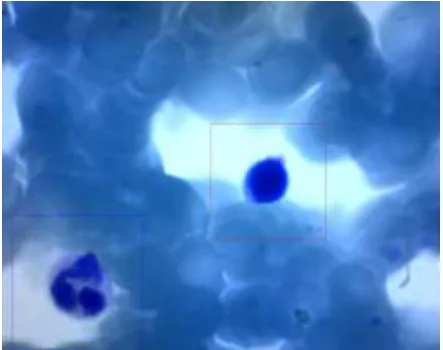
image and is displayed to the user, as shown in Figure 4. Finally, the program sends the
SEPT-OCT 2016, VOL-4/26 www.srjis.com Page 2968 Fig. 4. Cell classification.
4. Results
The test was standardized to the cells found in 50 frames randomly selected, and repeated
for 6 different blood samples. Results obtained are shown on Table 1, with accuracy above
80% for all the cases. The principal factor of the mistakes was the variability of pigment tone,
affecting the Color Location. This can be improved by automating the preparation process of
blood smears; in a lower percentage, when the distance between the cells was less than 100
pixels, the algorithm considered them as one, discarding the majority because the size of their
ROI and added to the cells ignored percentage.
Figure 5 shows the resulting detection of a Segmented Neutrophil framed with a blue
square and a Lymphocyte with a red frame. The blue tone of the Leukocytes in this image can
be easily separated from the surrounding cells, thanks to the correct application of the pigment
[image:7.595.194.416.522.697.2]in the smear preparation.
SEPT-OCT 2016, VOL-4/26 www.srjis.com Page 2969 Sample Total of
cells Right (%) Wrong (%) Ignored (%)
1 53 82.8 10.9 6.3
2 58 81.7 16.9 1.4
3 48 81.4 16.9 1.7
4 52 83.9 12.9 3.2
5 57 90.4 4.8 4.8
6 60 89.5 7.5 3.0
TABLE I. RESULTS
5. Conclusions
The implementation of an automatic counting cell tool can support an effective
development process of the Complete Blood Count (CBC) and represents a promising way to
diagnose several hematologic diseases. Due to this techniques and methods, the cost and time
invested on the performing of blood test can be reduced, obtaining an 80% accuracy on the
counting cell of the peripheral blood smear readings. Results of the diagnostic can be verified
with the conventional method.
As future work, it is planned to extend the number of cell types to identify, increasing the
database, and thus, provide a better outcome for a reliable diagnosis. In addition, the project
seeks to create an automatic and hygienic device that prepares blood smears, achieving the
same pigment tone and avoiding the presence of waste particles on each sample, reducing the
errors presented on the identification of patterns.
References
Anggraini, D., Nugrobo, A.S. Pratama, Ch. Rozi, I.E., Iskandar, A.A., (2011), Automated Status Identification of Microscopic Images Obtained from Malaria Thin Blood Smears,
International Conference on Electrical Engineering and Informatics, pp. 2-7.
Delahunt, Ch.B., Mehanian, C., Liming, H., Mcguire, S.K., Champlin, C.R., Horning, M.P., Wilson, B.K. (2015) Automated Microscopy and Machine Learning for Expert-Level Malaria Field Diagnosis, IEEE 2015 Global Humanitarian Technology Conference, pp. 393-399.
Jaime-Perez, J., Gómez-Almaguer, D. (2009), Hematología; la sangre y sus enfermedades, 2da. Edición, McGrawHill, México.
ManjulaSri, R., Madhubabu, Ch., Rao, KMM., (2013), LabVIEW based assessment of CDR for the detection of Glaucoma, International Conference on Emerging Trends in Computing, Communication and Nanotechnology (ICECCN 2013), pp. 683-686.