Some Features of Surface Air Temperature:
A Statistical Viewpoint
Partha Nath Dutta
1, Tado Karlo
2, Pallabi Dutta
3,*1Department of Physics, Silapathar Science College, India
2Department of Physics, North Eastern Regional Institute of Science and Technology (NERIST), Arunachal Pradesh, India 3Department of Botany, Silapathar Science College, India
Copyright©2017 by authors, all rights reserved. Authors agree that this article remains permanently open access under the terms of the Creative Commons Attribution License 4.0 International License
Abstract
A climatological study has been done in five weather stations viz Dhuburi, Guwahati, Silchar, Tezpur and Dibrugarh for 45 years (1969-2013), for studying and comparing maximum, minimum and mean temperatures. Coefficient of variation, skewness, kurtosis are also calculated and plotted for comparing the results of the stations. The values of period mean of annual surface air temperature are different at different stations and this value does not show homogeneous distribution in the regions. The pattern of distribution of annual mean of daily surface air temperature (maximum, minimum and mean) are asymmetrical over all the stations and have different peakedness at different stations means over all the stations that the distribution are deviates from the normal distribution from slight to significant amount. In most of the cases winter months has shown highest variation while summer month are least variable. Variation in spring and autumn months are in between these two extremes. Almost over all the stations, the patterns of distribution of monthly mean temperature (maximum, minimum and mean) are not normal. The distributions are both positively and negatively skewed and have both platykurtic and leptokurtic peakedness.Keywords
Skewness, Coefficient of Variations, Annual Mean Temperature, Kurtosis1. Introduction
The fluctuation or variation of air temperature from normal value is a well-known global phenomenon. It was first observed at the beginning of 20th century in different part of the world, which was unexpected as compared with temperature trend observed in preceding years. Earth's linearly averaged surface temperature has increased by 0.74°C during the period 1901-2005 as reported by the latest estimates by IPCC [1]. The rates of climate change are significantly different among regions [1]. That’s why;
attention of scientists was directed first of all to clear out the reality of the fluctuations.
According to Hingane et al. [2] during the last century, surface temperature over India has shown significant increasing trend which is attributed to rise in maximum temperature. Rupa Kumar and Hingane [3] investigated long-term variations of seasonal and annual surface air temperature at six Indian industrial and non-industrial cities each and have concluded that the non-industrial stations did not show significant trends and there was either a cooling tendency or cessation of warming after the late 1950s at most of the Industrial cities. Thapliyal and Kulshreshtha [4] studied on temperature trends over Indian cities and indicated a slight warming trend between 1901 and 1990. The study of Hingane [5] indicates rising trends of 0.84 and 1.3910C per 100 years in the mean surface temperature calculated for Mumbai and Kolkata, respectively. Rupa Kumar et al. [6] highlighted that the warming trends were visible during all the four seasons in all-India mean surface air temperatures during 1901-2000 from a network of 31 well-distributed representative stations over India. The research of Dhodre et al. [7] aimed at quantifying the change in surface air temperature at India's four most populated cities - Delhi, Kolkata, Mumbai and Chennai. Summarizing available information’s on climate change and on trends in the occurrence of extreme events over India, Sinha et al [8] concluded that, an increasing trend, to the order of 0.35°C, was observed in temperature records for the last 100 years.
Mukherjee [17], Mohanty and Dube [18] etc may be cited. Unfortunately, no such remarkable type of literature has been found out for current investigated regions.
The study area ‘Assam’ is located south of the eastern Himalayas. The study area Assam comprises the Brahmaputra and the Barak river valleys along with the Karbi Anglong and the Dima Hasao district. Guwahati (26° 11'N, 91° 44'E) city is between the southern bank of the Brahmaputra River and the foothills of the Shillong plateau. Tezpur (26° 38'N, 92° 48'E) is a town in the state of Assam in northeastern India. Tezpur is on the bank of the river Brahmaputra. The town of Dibrugarh (Mohanbari) (27° 48'N, 95° 02'E) is situated in the eastern part of Assam. Silchar (Kumbhirgram) (24° 49'N, 92° 48'E) town is located in the southern part of Assam [19]. It is situated on the bank of Barak River.
The local factors including geographical position, variation in elevation, continental, marine and topographic influences, etc may have considerable impact on surface air temperature over Assam.
To clear out the reality behind variation of surface air temperature in Assam, an attempt has been made here by analyzing the surface air temperature of some selected stations over Assam from statistical point of view.
2. Materials and Methods
2.1. Materials (Data)
Surface air temperature data of five stations representing different locations of the region have been used in this study. The locations of the stations, station index and the period of data utilized are presented in Table 1. The data have been collected from the Regional Meteorological Centre, Guwahati Assam. Selections of the stations are based on the availability of continuous data for the study period. Moreover the following assumptions are also kept in mind in selecting the stations:
i. The station could be taken as the representative of different parts of the region
ii. Changes in observing practices, instrumentation, and
site exposure might have some effect on the data which is supposed to be insignificant.
2.2. Methods of Analysis
Treating maximum, minimum and mean temperature separately, collected data have been subjected to few statistical analyses (mean, standard deviation, co-efficient of variation, skewness and kurtosis) by simple statistical methods in Microsoft office excel 2007, in terms of
a. Annual mean of daily surface air temperature and b. Monthly mean of daily surface air temperature.
From the monthly mean maximum and mean minimum temperature, the monthly mean temperature has been calculated separately for each month. Accordingly the yearly totals were calculated for each year. From the monthly mean maximum, mean minimum and mean temperature mean, standard deviation and coefficient of variation have been computed for each month.
Collected data were processed into monthly and annual mean values for all the studied locations on the formula-
X=∑(xi)/n (i)
The integrity of the data were determined by collecting data from each of the data source and checking for inconsistencies and missing gap using linear regression equation to estimate the missing value using the variable values [2b]. It may be written as follows:
y = a + bx(ii) Where:
b = n∑x - (∑x)/n∑x2 - (∑X)2 (iii) a = ∑y/n - b∑bx/n = y/ -bX (iv) Where:
a = intercept. b = regression coefficient.
[image:2.595.62.550.615.704.2]x = time in years. X = mean time and y/ = the mean temperature value.
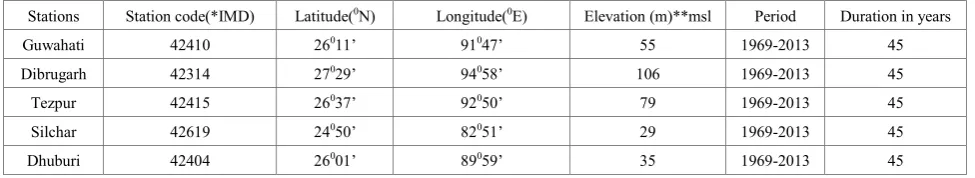
Table 1. Configuration of stations and period of data
Stations Station code(*IMD) Latitude(0N) Longitude(0E) Elevation (m)**msl Period Duration in years
Guwahati 42410 26011’ 91047’ 55 1969-2013 45
Dibrugarh 42314 27029’ 94058’ 106 1969-2013 45
Tezpur 42415 26037’ 92050’ 79 1969-2013 45
Silchar 42619 24050’ 82051’ 29 1969-2013 45
Dhuburi 42404 26001’ 89059’ 35 1969-2013 45
3. Result and Discussions
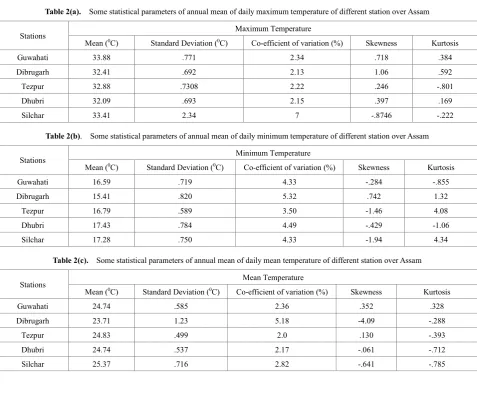
Some basic statistical parameters, like- mean, standard deviation, co-efficient of variation, skewness, kurtosis etc have been computed out for all the data series. The result for annual mean temperatures are presented in Tables 2(a), 2(b) and 2(c) and those for monthly mean temperature are illustrated in figures
3.1. Features of Annual Mean Temperature
It is obvious from table 2(a), 2(b) and 2(c) that the values of period mean of annual mean temperatures are different at different stations. Among all these stations maximum mean temperature was found to be highest at Silchar (33.410c, 25.370c) but minimum mean temperature was found to be highest in Dhuburi (17.430c). Lowest maximum temperature was found in Dhuburi (32.090c) and lowest minimum and mean temperatures were found at Dibrugarh (15.410c and 23.710c) respectively. From the observation of distribution of stations it is also apparent that the period of mean of annual mean temperature does not show homogeneous distribution.
Thus in determining the surface air temperature at any particular stations, the local factors like topography, land use pattern etc might have significant role.
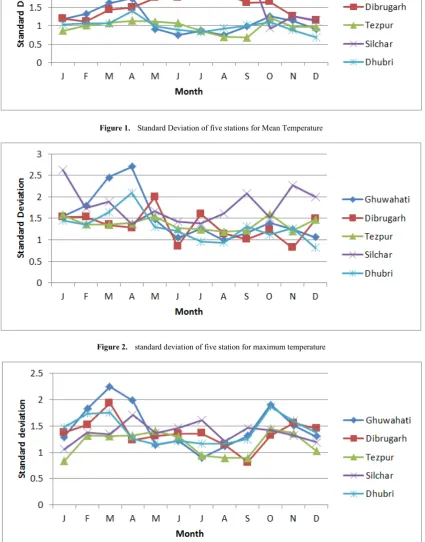
The steadiness of surface air temperature at different stations as well their area wise distribution can be well explained by the values of standard deviation and coefficient of variation, as it is known that, the lower value of these parameters corresponds to high steadiness, space homogeneity and time stationary (Guttman [20].) Here, it has been observed that the variability of annual mean of maximum temperature is small in all the stations except Silchar (Figure 2). Maximum temperature in Silchar station showed exponentially notable variation of 7% among all the stations (Figure 2).
Station wise observations of the variability of annual mean temperature showed that in all the three sets of data series (maximum, minimum and mean) the highest value of coefficient of variability is found at Silchar (7%) while its minimum value is obtained at Tezpur (2%). For minimum temperature, the co-efficient of variability is the lowest at Tezpur (3.5%) from table 2(b).
Table 2(a). Some statistical parameters of annual mean of daily maximum temperature of different station over Assam
Stations Maximum Temperature
Mean (0C) Standard Deviation (0C) Co-efficient of variation (%) Skewness Kurtosis
Guwahati 33.88 .771 2.34 .718 .384
Dibrugarh 32.41 .692 2.13 1.06 .592
Tezpur 32.88 .7308 2.22 .246 -.801
Dhubri 32.09 .693 2.15 .397 .169
Silchar 33.41 2.34 7 -.8746 -.222
Table 2(b). Some statistical parameters of annual mean of daily minimum temperature of different station over Assam
Stations Minimum Temperature
Mean (0C) Standard Deviation (0C) Co-efficient of variation (%) Skewness Kurtosis
Guwahati 16.59 .719 4.33 -.284 -.855
Dibrugarh 15.41 .820 5.32 .742 1.32
Tezpur 16.79 .589 3.50 -1.46 4.08
Dhubri 17.43 .784 4.49 -.429 -1.06
Silchar 17.28 .750 4.33 -1.94 4.34
Table 2(c). Some statistical parameters of annual mean of daily mean temperature of different station over Assam
Stations Mean Temperature
Mean (0C) Standard Deviation (0C) Co-efficient of variation (%) Skewness Kurtosis
Guwahati 24.74 .585 2.36 .352 .328
Dibrugarh 23.71 1.23 5.18 -4.09 -.288
Tezpur 24.83 .499 2.0 .130 -.393
Dhubri 24.74 .537 2.17 -.061 -.712
[image:3.595.67.545.345.738.2]Figure 1. Standard Deviation of five stations for Mean Temperature
Figure 2. standard deviation of five station for maximum temperature
A variable wise comparison reveals that the co-efficient of variability of minimum temperature is comparatively higher than that of maximum and mean temperature in most of the stations. High variability of minimum temperature may be due to the fact that the local factor including the ambient air temperature has greater influence on daily minimum temperature than on daily maximum temperature (Mukherjee [17], Coughlan [12])
The value of skewness and kurtosis exposed the pattern of distribution followed by surface air temperature as compared to the normal distribution (Mohanty and Dube [18], Guttman,[14]). Skewness of a frequency distribution indicated the degree of its departure from symmetry. A distribution, which is not symmetrical, is called asymmetrical or skewed. This skewness is said to be positive if the longer tail of the distribution is towards the higher values of the variable and negative if the longer tail is towards the lower values of the variable and zero if the
distribution is symmetrical. Kurtosis specifies the degree of peakness of a frequency distribution. A positive value of kurtosis indicates that the distribution has high concentration of the values nearer the central tendency. On the other hand, a negative value of kurtosis means that the distribution has low concentration of values in neighborhood of the central tendency. A distribution with positive kurtosis is called leptokurtic and one with negative kurtosis is known as platykurtic. A normal curve is said to be mesokurtic (Goon, et.al.[19])
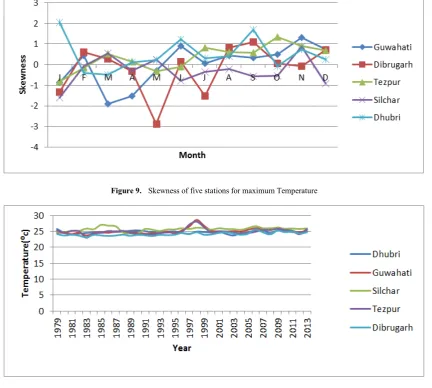
[image:5.595.91.520.309.472.2]The distribution of the annual mean of daily maximum surface air temperature data sets corresponds to the station Guwahati, Dibrugarh, Tezpur, Dhuburi found to have positive skewness with highest and lowest value of skewness at Dibrugarh(1.06) and Tezpur (0.246) respectively (Figure-8). At Silchar the distribution is found to be negatively skewed with value -0.8746 (Figure 7).
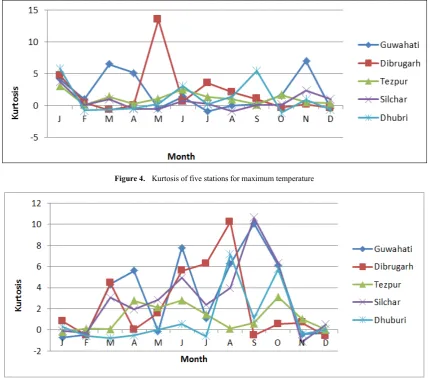
Figure 4. Kurtosis of five stations for maximum temperature
[image:5.595.90.521.310.688.2]Figure 6. Kurtosis of five Station for mean temperature
Figure 7. Skewness of five station for Minimum Temperature
Figure 8. Skewness of five station for Mean Temperature The distribution of the annual mean of daily minimum
surface air temperature has only positive skew at Dibrugarh with value 0.742(Figure-7). It has negative skewness at Guwahati, Tezpur, Dhubri and Silchar with lowest and highest value at Guwahati (-0.284) and Silchar (-1.94) respectively.
Guwahati, Dibrugarh and Dhuburi has shown leptokurtic while Tezpur and Silchar shows platykurtic distribution of annual mean of daily maximum surface air temperature. Dibrugarh shows considerable leptokurtic and Tezpur considerable platykurtic distribution that of other station.
The distribution of annual mean of daily minimum temperature is found to be leptokurtic at Dibrugarh, Tezpur and Silchar. It is found platykurtic at Guwahati and Dhubri. Among all the stations, the highest leptokurtic distribution is observed at Silchar and highest platykurtic distribution is observed at Dhuburi.(Figure. 5)
The distribution of annual mean of daily mean temperature is found to be leptokurtic at Guwahati and Dibrugarh(Figure. 6). Tezpur, Dhuburi and Silchar are found to be platykurtic in distribution .Silchar shows the highest platykurtic distribution among the representative stations. Thus the pattern of distribution of annual mean of daily surface air temperature for all three data sets (maximum,minimum and mean) are asymmetrical over all the stations and have different peakedness at different stations. So it has been found that over all the stations and for all the three sets of data, the patterns of the distribution are
found to be deviated from normal distribution (Figure.4). From the whole investigation the following points are observed;
(i) In case of the mean of annual mean temperature Silchar shows the maximum value of surface air temperature (25.670C) and Dibrugarh shows temperature (24.140C) which is the minimum across all five stations. So the range of surface air temperature of annual mean of mean temperature lies between (24.140C -25.670C). (ii) The range of annual mean temperature of Tezpur is the
highest range which is (22.980C -28.000C) and Dibrugarh shows the minimum range (24.020C -26.460C) amongst the locations, Silchar, Guwahati and Dhubri show the range (24.310C -27.030C), (23.700C -28.550C) and(23.690C -25.750C) respectively.
[image:7.595.93.518.351.533.2](iii) The annual mean temperature of all five locations shows the positive trend except the location Dhubri (Fig 10). It shows the positive trend or increment of 0.012470C in the whole locations, if taken the mean of all five locations or as a whole mean of all five locations (Figure. 10).
[image:7.595.90.523.360.748.2]Figure 9. Skewness of five stations for maximum Temperature
3.2. Features of Monthly Mean Temperature
Standard deviation, co-efficient of variation, skewness and kurtosis of Monthly mean value of daily Maximum, minimum, and mean temperature are shown in figure.
Variation of the stations viz., Dibrugarh, Silchar, and Dhuburi are almost similar. For Guwahati, the value of Co-efficient of variation is highest in the month of April and for minimum temperature the highest value is in March. Also for mean value it takes highest value in January month. The Co-efficient of variation for Tezpur station, highest variation for maximum temperature is in the month of January, for minimum temperature in the month of February and for mean temperature it takes highest variation in the month December. It has been seen that for highest variation in maximum temperature is found in the month of January.
It has been observed that, in all the stations, standard deviations were different. For Guwahati and Dhuburi station, highest standard deviation for maximum and Mean temperature are found in the month of April and the highest standard deviation for minimum temperature has been observed in the month of March. An exceptional situation was observed for Tezpur station that highest standard deviation is observed in the month of October for maximum, minimum, and mean temperature. Regarding mean temperature, highest variation has been observed in the month of July for Dibrugarh and Silchar station. In Dibrugarh station, highest variation is observed in the month May and March for Maximum and minimum temperature. In case of Silchar station highest variation for maximum and minimum temperature is observed in the month of January and July.
Least variation has been observed for maximum and minimum temperature in the month of August in Guwahati, Tezpur and Dhuburi stations. For minimum temperature, least variation has been observed in the month of September for dibrugarh and Silchar station, for mean temperature, least variation has been observed in the month of September for Tezpur and Dibrugarh station. For mean temperature, in Guwahati, Silchar and Dhuburi stations, least variation has been observed in the month of August, October and June respectively. For maximum temperature, deviation is less in the month of August for Guwahati and Tezpur stations. For minimum temperature, Guwahati, Dibrugarh,and Tezpur stations showed least variation in the month of September. For maximum and mean temperature, Dibrugarh station showed least variation in the month of November.
For Guwahati, Tezpur and Silchar the least variations observed in the month of June, September and October respectively for mean temperature. For Silchar station the least variation of maximum temperature is observed in the month of July. An exceptional case is also seen in Silchar
station that the least variation of minimum temperature is obtained in the month of January. Also in the Dhuburi station, for maximum and mean temperature, the least variation is observed in the month of December and for minimum temperature it is seen in the month of August .For all the three data sets and overall stations minimum variation of monthly mean temperature as measured by standard deviation and coefficient of variation are observed within the months from June to September .Thus it is evident that in most of the cases, winter months shows the highest variation, while summer months shows the least variation. Highest variation during the winter months may arise because of the fact that topographic factors are minimized during the winter month due to short day length and the low angle at which the sun rays strike the earth surface.(Calvo and Gregory,[15])
From the figure it is obvious that the distributions of monthly mean of daily maximum,minimum and mean temperature are not normal almost over all the stations. The distribution is both positively and negatively skewed and have platykurtic and leptokurtic peaknesses. By comparing all the stations it is seen that for maximum, minimum and mean temperatures, the stations Dhuburi, Silchar and Dibrugarh are more leptokurtic in the month of May, September and September respectively. Similarly for maximum, minimum and mean temperature the stations dhuburi ,Silchar and Dibrugarh are more platykurtic in the month of October , November and July respectively.
It has been observed that for all the stations maximum, minimum and mean temperatures the stations Dhuburi, Dibrugarh and Tezpur are more positively skewed in the month of January, August and October. Similarly, after comparing all the stations it seen that for stations Dhuburi , Silchar and Dibrugarh are more negatively skewed in the month of May, September and September respectively.
The present analysis showed the result that-
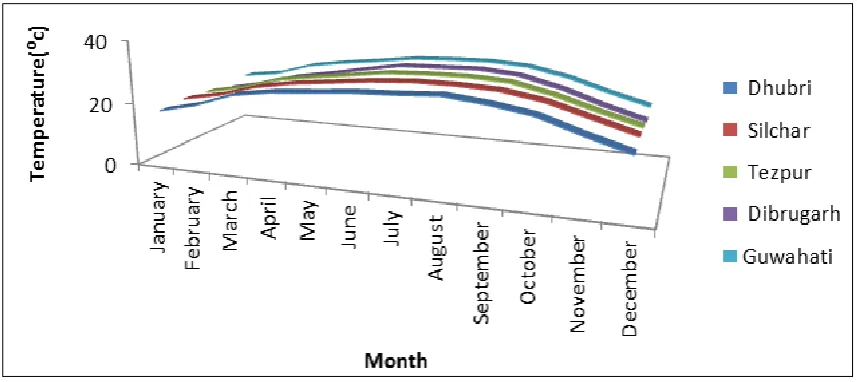
(i) The mean temperature varied in between the mean temperature range (24.220C -25.770C among locations over the months (Figure 11)
(ii) (16.060C -29.850C) is the range of monthly mean temperature of maximum and minimum temperature. Silchar and Dibrugarh show the highest mean of maximum temperature and the minimum of minimum temperature.
Figure 11. Change of pattern in change in monthly mean temperature.
Table 3. Extreme values of surface air temperature and their corresponding dates of occurrence for different stations
Stations Period of data Maximum Temperature (occurrence 0C) with date(s) Minimum Temperature (occurrence 0C) with date(s)
Guwahati 1969-2013 19 April 1996 39.9 6 January 1983 4.9
Dibrugarh 1969-2013 7 August 1984 39.8 6 January 1983 3.4
Tezpur 1969-2013 17 July & 2 August 1975 39.5 25 December 2011 6.8
Dhubri 1969-2013 17 April 1973 39.6 9 January 2013 5.8
[image:9.595.61.548.461.572.2]Silchar 1969-2013 March 199539.3 15 January 1989 6.4
Table 4. Maximum and minimum values of range of variation of daily surface air temperature for maximum and minimum temperature of different station over Assam
Station Period of data Maximum value of Maximum Termperature Minimum Temperature
range(0C) Minimum value of range(0C) Maximum value of range(0C) Minimum value of range(0C)
Guwahati 1969-2013 15.2 3.8 12.6 4.7
Dibrugarh 1969-2013 11.9 3.8 11.5 3.6
Tezpur 1969-2013 8.9 5.3 8.6 3.8
Dhubri` 1969-2013 8.1 3.1 10.8 4.5
Silchar 1969-2013 12.8 5.4 8.4 4.1
3.3. Extreme Values of Surface Air Temperature
Table 3 gives the extreme values of maximum and minimum temperature and their corresponding date of occurrence
It is clear from the table that amongst all the stations Guwahati (39.90C) shows the highest extreme value and Silchar (39.30C) shows lowest extreme value of daily maximum temperature during the whole study period and Tezpur (6.80C) shows highest extreme value for minimum temperature amongst all the station under investigation during whole study period. Extreme value of maximum temperature over different station occurs within the month of April to August except Silchar. This value occurs in the
month of March in the case of Silchar on the other hand over all the stations except Tezpur, extreme value of minimum temperature occurs within the month of January. This has been occurring in the month of December in the case of Tezpur. It implies that January is the coldest month of the year in Assam.
In determining the extreme values maximum and minimum temperature and maximum and minimum value of range of variation of daily temperature, control of local factors are more effective. Station where sizable amount of deforestation has done and land use pattern is remarkable, extreme values of maximum and minimum temperature and range of variation of daily temperature are large.
4. Conclusions
From the present study the following conclusion may be
drawn-1. The values of period mean of annual surface air temperature are different at different stations and these values does not show homogeneous distribution in the region
2. The pattern of distribution of annual mean of daily surface air temperature (maximum, minimum and mean) are asymmetrical over all the stations and have different peakedness at different stations.
3. In most of the cases winter months has shown highest variation while summer month are least variable. Variation in spring and autumn months are in between these two extremes.
4. Almost over all the stations, the patterns of distribution of monthly mean temperature (maximum, minimum and mean) are not normal. The distribution are both positively and negatively skewed and have both platykurtic and leptokurtic peakedness.
5. The extreme value of maximum temperature at different station in Assam is distributed within the month of April to August and that for minimum temperature occurs in the month of January.
6. Thus in Assam summer days are spread from the month of April to August and January is the coldest month of the year in the region.
7. The range of variation of daily surface air temperature is more over all the stations in Assam.
8. The annual mean temperature of all five locations shows the positive trend except the location Dhubri. It shows the positive trend or increment of 0.012470c in the whole locations, if taken the mean of all five locations or as a whole mean of all five locations.
REFERENCES
[1] IPCC (2007). Climate change 2007: climate change impacts, adaptation and vulnerability. Working Group II contribution to the Intergovernmental Panel on Climate Change Fourth Assessment Report. Summary for policymakers, 23.
[2] Hinhane, L.S., Rupa Kumar, Ramana Murty, V.Bh.; 1985. Long-term Temperature Trends of surface air temperature in India, Journal of climatology, 5, 521-528.
[3] Rupa Kumar, K., Hingane, L.S., 1988. Long term variations of surface air temperature at major industrial cities of India, Climatic Change 13, 287–307.
[4] Thapliyal, V., Kulshreshtha, S.M., 1991. Climate changes and trends over India, Mausam 42, 333–338.
[5] Hingane, L.S., 1996. Is a signature of socio-economic impact written on the climate?, Climatic Change, 32, 91–102. [6] Rupa Kumar, K. Krishna Kumar, R.G. Ashrit, S.K.
Patwardhan and G.B. Pant 2002, Climate change in India: Observations and model projections. A chapter in NATCOM book on Climate Change.
[7] Dhorde, A., Dhorde, A. and Gadgil, A.S., 2009. Long-term Temperature Trends at Four Largest Cities of India during the Twentieth Century, J. Ind. Geophys. Union, Vol.13, No.2, 85-97.
[8] Sinha, Ray K. C. and De U. S., 2003. Climate change in India as evidenced from instrumental records, WMO Bulletin,52(1), 53–59,
[9] Pathack,M.M.R., 1982, ‘An analysis of Mauritian Winter Rainfall’, Mausam, 33, 361-372.
[10] Angell, J.K. and Korshover, J., 1978 ‘ Estimate of Global Temerature variation in the 100-30mb Layer between 1958 and 1977’ , Monthly Weather Review ,106, 10, 1422-1432 [11] Madden, R.A. and Shea, D.J.,1978, ‘Estimate of Natural
Variability of Time- Average Temerature over the united states’, Monthly Weather Review, 106,1695-1702.
[12] Coughlan, M.J., 1979, ‘Recent variation in annual mean temperature over Australia’, Quarterly Journal of the Royal Meterology Society, 105, 707-719.
[13] Weare, B.C., 1979, ‘Temperature statistics of short term climate change’. Monthly Weather Review, 107, 2, 172-180. [14] Guttman, N.B., 1991, ‘Jannuary Singularities in the Northeast from a Statistical Viewpoint’,Journal of Applied Meterology, 30, 358-367.
[15] Calvo, J.C. and Gregory,J.D., 1994, Predicting Monthly and Annual air temperature characteristics in North Carolina’, Journal of Alied Meterology,33 490-499.
[16] Jagannathan, P. and Khembete,N.N., 1963, Seasonal oscillation of the Diurnal range of temperature in India and Neighbourhood’,Indian Journal of Meterology and Geophysics, 14, 4, 389-401.
[17] Mukherjee,A.K.,1965, ‘Local Temperature variations in Shillong area’, Indian Journal of Meterology and Geohysics,16,3,437-440.
[18] Mohanty, U.C. and Dube, S.K., 1981, ‘Statistical Structure of the meterological parameters over the Bay of Bangal during Monsoon-77 experiment’ Mausam, 32, 1, 51-54.
[19] U. D. Goswami 2000. a study on some features of surface air temperature over Assam, M. Ph. Dissertation, Gauhati University