Journal of Chemical and Pharmaceutical Research
__________________________________________________
ISSN No: 0975-7384 CODEN(USA): JCPRC5
J. Chem. Pharm. Res., 2010, 2(4):740-746
Method development and validation of Irbesartan using
LC-MS/MS: Application to pharmacokinetic studies
1
*M.Ganesan, 2S. Nanjundan, 3M. Gomathi and 1S.Muralidharan
1
Micro Therapeutic Research Labs Private Limited, Kamarajar Street, Chennai, India
2
PERI Institute of Technology, Mannivakkam, Chennai, India
3
A. J. College of Pharmacy, Chennai, India
______________________________________________________________________________
ABSTRACT
A simple, accurate liquid chromatography with tandem mass spectrometry (LC/MS-MS) method has been developed and validated in human plasma. The method employed liquid-liquid extraction. Samples containing Irbesartan were chromatographed on a Hypersil gold column (C18, 5µm, 100 x 4.6 mm) at a temperature of 40°C. The isocratic mobile phase composition was a mixture of 2 mM ammonium formate (pH 4.0) / methanol (20:80 v/v), which was pumped at a flow rate of 0.5 mL / min with split ratio of 20:80.The retention time under these chromatographic conditions was found to be 2.20 minutes with run time 2.82 minute. Ethyl acetate & n-Hexane (80:20, v/v) was found to be good extracting and produced a satisfactory chromatogram. The developed LC/MS-MS method was found to be selective, simple, sensitive, accurate and linear for the analysis of Irbesartan in human plasma. The retention time and in-turn run time was very short, hence required less mobile phase for the method, making it more economical and rapid. The method was applicable for the pharmacokinetic study of Irbesartan.
Key words: Irbesartan, LC/MS-MS, Validation, Plasma.
______________________________________________________________________________
INTRODUCTION
pharmaceuticals and biological samples [4-12]. This paper described a newly developed LC– MS/MS method for the quantitation of Irbesartan in human plasma with more sensitivity compared to other methods.
EXPERIMENTAL SECTION
Materials
Irbesartan reference standards and Telmisartan (internal standard) was obtained from the Dr.Reddy’s Laboratories Ltd, Hyderabad, India, Ethyl acetate (GR Grade), n-hexane (GR Grade), Acetonitrile (HPLC Grade), methanol (HPLC Grade), Di-Potassium hydrogen phosphate anhydrous (GR Grade) and Ammonium format (GR Grade) from Merck (India). A Milli-Q system (Millipore, Bedford, MA, USA) was used.
Instrumentation
[image:2.595.89.527.449.706.2]The system (Waters, Milford, USA) is equipped with an Acquity SM sample manager, Acquity BSM binary solvent manager and thermo stated column compartment. The chromatography was performed on a Hypersil gold column (C18, 5µm, 100 x 4.6 mm) at a temperature of 40°C. The isocratic mobile phase composition was a mixture of 2 mM ammonium formate (pH 4.0) / methanol (20:80 v/v), which was pumped at a flow rate of 0.5 mL / min with split ratio of 20:80. Mass spectrometric detection was performed on a Quattro premier XE triple quadrapole instrument (Waters, Milford, USA) using multiple reaction monitoring (MRM). A turbo electrospray interface in positive ionization mode was used. Data processing was performed using Masslynx 4.1 software.
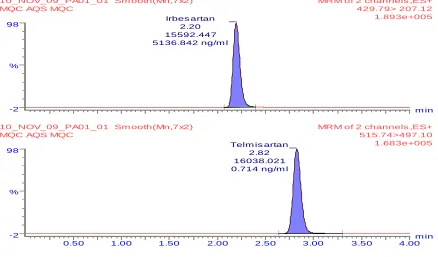
Figure 1 Representative Chromatogram of an Aqueous Standard Solution for Irbesartan
m in 0.50 1.00 1.50 2.00 2.50 3.00 3.50 4.00 %
-2 98
MRM of 2 channels ,ES+ 515.74>497.10 1.683e+005 10_NOV_09_PA01_01 Sm ooth(Mn,7x2)
MQC AQS MQC
Telm is artan 2.82 16038.021 0.714 ng/m l
m in %
-2 98
MRM of 2 channels ,ES+ 429.79> 207.12 1.893e+005 10_NOV_09_PA01_01 Sm ooth(Mn,7x2)
MQC AQS MQC
Irbes artan 2.20 15592.447 5136.842 ng/m l
Preparation of standard solution
_____________________________________________________________________________
further diluted by suitable dilution with methanol. The standard chromatogram is presented in Figure 1.
Extraction of Irbesartan from plasma
A 100 µL volume of plasma was transferred to a 4mL ria vial, and then 50 µL of IS working solution (5.0 µg/mL) was spiked. After vortexing for 30 sec, add 100 µL of 1.0 M Di-Potassium hydrogen phosphate anhydrous solution. Then 2.5 mL aliquot of the extraction solvent ethyl acetate: n-Hexane (80:20, v/v) was added. The sample was vortex-mixed for 10 min and then centrifuged at 1891 + 100 for 5 minutes at 10°C. The organic layer (2.0 mL) was quantitatively transferred to a 4 mL glass tube and evaporated to dryness at 40°C under a stream of nitrogen. Then, the dried extract was reconstituted in 500 µL of Mobile phase and a 5 µL aliquot was injected into the chromatographic system.
Preparation of calibration curve and Quality control samples
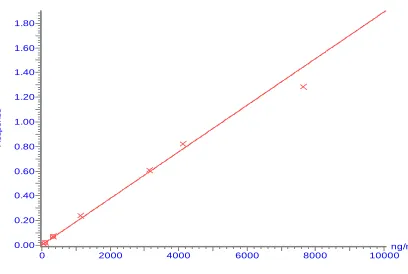
[image:3.595.99.507.479.753.2]Standard stock solution of Irbesartan (2 mg/mL) and Telmisartan ISTD (1 mg/mL) were separately prepared in methanol. Spiking solutions for calibration curve and quality controls were prepared by appropriate dilution in methanol:water (50:50). The IS working solution (5 µ g/mL) was prepared by diluting its stock solution with methanol:water (50:50). Spiking solutions (0.2 mL) were added to drug-free human plasma (9.8 mL) as a bulk, to obtain Irbesartan spiking concentration levels of 45.8280 to 10052.5460 ng/mL. The calibration curve is presented in Figure 2.
Figure 2 Representative Regression Analysis of a Calibration Curve for Irbesartan
Com pound nam e: Irbes artan
Correlation coefficient: r = 0.995757, r^2 = 0.991532 Calibration curve: 0.000189002 * x + 0.00134224
Res pons e type: Internal Std ( Ref 2 ), Area * ( IS Conc. / IS Area ) Curve type: Linear, Origin: Exclude, Weighting: 1/x^2, Axis trans : None
ng/m l
0 2000 4000 6000 8000 10000
R
e
s
p
o
n
s
e
The quality control pools were divided into aliquots and stored in the freezer at −70◦C until analysis. Each validation run consisted of a double quality control, system suitability sample, blank samples (a plasma sample processed without an IS), a zero sample (a plasma processed with IS), calibration curve consisting of eight non-zero samples covering the total range (45.8280 to 10052.5460 ng/mL) and QC samples at four concentrations (n = 6, at each concentration). Such validation runs were generated on 4 consecutive days. Calibration samples were analyzed from low to high at the beginning of each validation run and other samples were distributed randomly through the run. Linearity was assessed by a weighted (1/x2) least squares regression analysis and the calibration curve had a correlation coefficient (r2) of 0.99. The acceptance criterion for each back-calculated standard concentration was 15% deviation from the nominal value except. LLOQ.
System suitability tests
Throughout the study, the suitability of the chromatographic system was monitored by calculating the trailing/asymmetry factor, theoretical plates and relative standard deviation.
Intraday accuracy and precision
Within-batch and between-batch accuracy and precision evaluations were performed by repeated analysis of Irbesartan in human plasma. The run consisted of a calibration curve with six replicates of each LLOQ, low, medium and high quality control samples. During routine analysis, each analytical run included a set of calibration samples, a set of QC samples in duplicate and plasma samples to be determined. The overall precision of the method expressed as relative standard deviation and accuracy of the method.
RESULTS AND DISCUSSION
The mobile phase selected achieved a good resolution and symmetric peak shapes for the analyte and IS with a short run time. The high proportion of organic solvent eluted the Irbesartan and Telmisartan (IS) at retention times of 2.54 and 3.15 min, respectively. A flow rate of 0.5 mL/min produced good peak shapes and permitted a run time of 4.0 min. Liquid-liquid extraction (LLE) was used for the sample preparation in this work. A mixture of ethyl acetate & n-Hexane (80:20, v/v) was found to be optimal, which can produce a clean chromatogram for a blank plasma sample. The average recoveries of Irbesartan from spiked plasma samples at low, medium and high level are 70.76%, 54.62% and 64.66% respectively and for Telmisartan (ISTD) is 90%. Recoveries of the analytes and IS were good and it was consistent, precise and reproducible. Therefore, the method has proved to be robust in high-throughput bioanalysis. The percentage CV of matrix factor for Irbesartan and internal standard were found to be 3.44 and 4.02 respectively. The matrix effect percentage of Irbesartan and Internal Standard were found to be 89.59 and 94.99 respectively.
_____________________________________________________________________________
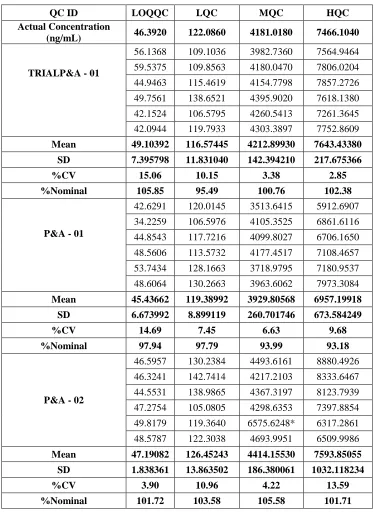
Table 1 Intra-batch Precision and Accuracy of Irbesartan
QC ID LOQQC LQC MQC HQC Actual Concentration
(ng/mL) 46.3920 122.0860 4181.0180 7466.1040
TRIALP&A - 01
56.1368 109.1036 3982.7360 7564.9464
59.5375 109.8563 4180.0470 7806.0204
44.9463 115.4619 4154.7798 7857.2726
49.7561 138.6521 4395.9020 7618.1380
42.1524 106.5795 4260.5413 7261.3645
42.0944 119.7933 4303.3897 7752.8609
Mean 49.10392 116.57445 4212.89930 7643.43380 SD 7.395798 11.831040 142.394210 217.675366 %CV 15.06 10.15 3.38 2.85 %Nominal 105.85 95.49 100.76 102.38
P&A - 01
42.6291 120.0145 3513.6415 5912.6907
34.2259 106.5976 4105.3525 6861.6116
44.8543 117.7216 4099.8027 6706.1650
48.5606 113.5732 4177.4517 7108.4657
53.7434 128.1663 3718.9795 7180.9537
48.6064 130.2663 3963.6062 7973.3084
Mean 45.43662 119.38992 3929.80568 6957.19918 SD 6.673992 8.899119 260.701746 673.584249 %CV 14.69 7.45 6.63 9.68 %Nominal 97.94 97.79 93.99 93.18
P&A - 02
46.5957 130.2384 4493.6161 8880.4926
46.3241 142.7414 4217.2103 8333.6467
44.5531 138.9865 4367.3197 8123.7939
47.2754 105.0805 4298.6353 7397.8854
49.8179 119.3640 6575.6248* 6317.2861
48.5787 122.3038 4693.9951 6509.9986
Mean 47.19082 126.45243 4414.15530 7593.85055 SD 1.838361 13.863502 186.380061 1032.118234 %CV 3.90 10.96 4.22 13.59 %Nominal 101.72 103.58 105.58 101.71
Table 2 Inter-batch or Total Precision and Accuracy of Irbesartan
QC ID LOQQC LQC MQC HQC Actual
Concentration
(ng/mL) 46.3920 122.0860 4181.0180 7466.1040 TRIALP&A -01
56.1368 109.1036 3982.7360 7564.9464
59.5375 109.8563 4180.0470 7806.0204
44.9463 115.4619 4154.7798 7857.2726
42.1524 106.5795 4260.5413 7261.3645
42.0944 119.7933 4303.3897 7752.8609
P&A -01
42.6291 120.0145 3513.6415 5912.6907
34.2259 106.5976 4105.3525 6861.6116
44.8543 117.7216 4099.8027 6706.1650
48.5606 113.5732 4177.4517 7108.4657
53.7434 128.1663 3718.9795 7180.9537
48.6064 130.2663 3963.6062 7973.3084
P&A -02
46.5957 130.2384 4493.6161 8880.4926
46.3241 142.7414 4217.2103 8333.6467
44.5531 138.9865 4367.3197 8123.7939
47.2754 105.0805 4298.6353 7397.8854
49.8179 119.3640 6575.6248 6317.2861
48.5787 122.3038 4693.9951 6509.9986
Mean 47.24378 120.80560 4305.70173 7398.16118 SD 5.705881 11.801255 627.365175 751.047684 %CV 12.08 9.77 14.57 10.15 %Nominal 101.84 98.95 102.98 99.09
CONCLUSION
A simple, sensitive, and reliable LC/MS-MS method has been developed and validated for the determination of Irbesartan in human plasma. The method is accurate, reproducible, and specific. The retention time and in-turn run time was very short, hence required less mobile phase for the method, making it more economical and rapid. The method may be applicable for pharmacokinetic studies of Irbesartan in human plasma.
Acknowledgement
This study was supported by Micro Therapeutic Research Labs Private Limited, India.
REFERENCES
[1] Ruilope, L., J. Hypertens. Suppl., 1977, 15, S15.
[2] Change, S.Y., Whigan, D.B., Vachharajani, N.N. and Patel, R., J. Chromatogr. B Biomed.
Sci. Appl., 1997, 702, 149.
[3] Gonzalez, L., Alonso, R.M. and Jimenez, R.M., Chromatographia, 2000, 52, 735. [4] Sane, R.T., Francis, M. and Pawar, S., Indian Drugs, 2002, 39, 32.
[5] Ashok k, Yusuf M, Omran M.O, liquid chromatographic determination of Irbesartan in rat plasma, J. of Chromatography B, 2007, 840,245-250.
[6] Nevin. Erk, Simultaneous determination of Irbesartan, hydrochlorthiazide in rat plasma by Liquid chromatography, J. of Chromatography B, 2003, 784,195-201.
[7] G. V. Ram Reddy; A. Praveen Kumar; B. Venkateswara Reddy; J. Sreeramulu; J. H. Park Separation and Quantification of Key Starting Materials of Irbesartan Using Liquid Chromatography–Mass Spectrometry as a Separation and Identification Tool. Analytical Letters, 1532-236X, Volume 42, Issue 13, 2009, Pages 2087 – 2095.
_____________________________________________________________________________
[9] J. Joseph-Charles; S. Brault; C. Boyer; M. -H. Langlois; L. Cabrero; J. -P. Dubost Simultaneous Determination of Irbesartan and Hydrochlorothiazide in Tablets by Derivative Spectrophotometry. Analytical Letters, 1532-236X, Volume 36, Issue 11, 2003, Pages 2485 – 2495.
[10]Najma SULTANA, M Saeed ARAYNEb, S Shahid ALI and Shahnawaz SAJID. Simultaneous determination of olmesartan medoxomil and irbesartan and hydrochlorothiazide in pharmaceutical formulations and human serum using high performance liquid chromatography.
Chinese Journal of Chromatography.Volume 26, Issue 5, September 2008, Pages 544-549.
[11]Bae SK, Kim MJ, Shim EJ, Cho DY, Shon JH, Liu KH, Kim EY, Shin JG. HPLC determination of irbesartan in human plasma: its application to pharmacokinetic studies. Biomed
Chromatogr. 2009 Jun;23(6):568-72.