Nanoscience and Nanoengineering 1(1): 71-88, 2013 http://www.hrpub.org DOI: 10.13189/nn.2013.010110
Effect of Hard Segment Molecular Weight on
Concentrated Solution and Bulk Properties of Ether
Based Thermoplastic Polyurethanes
K. W. Lem
1,4,*, J. R. Haw
2, S. Curran
3, S. E. Sund
1, C. Brumlik
4, G. S. Song
5, D. S. Lee
5,*1SuperLearning International, LLC, NJ, USA
2Department of Materials Chemistry and Engineering, Konkuk University, Seoul, South Korea 3Boston Scientific, MA, USA
4Nanobiz, LLC, NJ, USA
5Department of Chemical Engineering, Chonbuk National University, Chonju, South Korea
*Corresponding Author: [email protected], [email protected], [email protected]
Copyright © 2013 Horizon Research Publishing All rights reserved.
Abstract
A systematic study was conducted toinvestigate the effect of hard segment molecular weight on concentrated solution and bulk properties of thermoplastic ether based polyurethanes (TPUs). The molar feed was used to determine the molecular weight of the hard segment. Then the weight fraction of the hard segment is determined by calculating the ratio of the molecular weight of the hard segment to the number average molecular weight of the TPU determined by GPC. Similar to the study of dilute solution properties, it was found that thermal and mechanical properties in the bulk were significantly affected at low weight fractions of the hard segment. The critical weight fraction of the hard segment was found at about 0.4. Above critical weight fraction of hard segment there is a diminishing effect on the thermal properties and dynamical/ mechanical properties in bulk.
Keywords
Thermoplastic Polyurethanes (TPUs), A Critical Weight Fraction of the Hard Segment, Bulk Properties1. Introduction
[image:1.595.180.428.547.729.2]Many useful polyurethane devices are made from liquids, via solution,dispersion, emulsion, or suspension. When a polyurethane film forms from solution, its end-use properties depend strongly on its solution properties. We have conducted a systematic study to investigate the effect of hard segment molecular weight on the properties of thermoplastic ether based polyurethanes (TPUs). The purpose of this study is to provide a roadmap to deliver the desired end-use performance of a polyurethane product based on the optimal design of the starting materials. Such a roadmap shown in Figure 1, illustrates a bottom-up approach to study the effect of hard segment length (i.e., molecular weight) on properties of a polyurethane material from a very dilute solution to bulk [1-3].
Table 1. Molecular Weights of the TPUs and Weight Fraction of Hard Segment Prepared by Different Polymerization Procedures [1-3]
Seperately, we reported the findings of the effects of hard segment molecular weight on the properties of dilute solutions of TPUs in N, N-dimethyl formamide (DMF)in Region 1. Similar to the onset of micellization at critical micelle concentration (CMC) observed by sudden change in measured properties of solution at characteristic surfactant concentration[2], our experimental results suggest that there is a critical or limiting weight fraction (at about 0.4) of hard segment on measured properties. We found that the weight fraction of the hard segment strongly affects the weight average molecular weight, molecular weight distribution, intrinsic viscosities, critical concentration, hydrodynamic diameter, polymer-solvent interaction parameter and second virial coefficient. Once the weight fraction reaches approximately 0.4, the influence of the hard segment molecular weight on these properties becomes minimal. Above approximatly 0.4 hard segment molecular weight has little impact on number average molecular weight or the expansion parameter in Flory-Huggins analysis, at all concentrations [1-3].
In this paper, we report the highlights of our study on the effect of hard segment molecular weight on concentrated solutions and bulk properties such as rheological, thermal, and mechanical properties in Regions 2 and 3.
2. Experimental
We have used the following procedure to prepare materials and measurement to characterize their properties in concentrated solution and in bulk.
2.1. Material Preparation
A segmented di-block thermoplastic polyurethane (TPU) has been synthesized in this study, following the procedure
and the analysis described by Kim and Lee [4] and Nguyen et al. [5]. The details of the synthesis of TPU and the sample preparation were discussed in our previous papers [1-5]. The molecular weight of the hard segment was determined from the molar feed. The weight fraction of the hard segment is the ratio of the molecular weight of the hard segment to the number average molecular weight of the TPU determined by GPC [1-5]. Table 1 summarized the polyurethane compositions used in this study .
2.2. Rheological Measurement
Rheological properties of the TPU solutions were studied employing a cone-plate rheometer (Weissenberg Rheogoniometer R-21, TA Instrument) at 25 oC. The dynamic rheological properties of the 50wt % concentration of TPU in DMF solution were performed at 25 oC. The rheological properties of the melts were characterized at 190 and 200oC by standard shearing measurement.
2.3. Thermal Properties Measurement
For characterization of the bulk properties of TPUs, samples were obtained by casting TPU solutions in a silicone mold and drying at 50 oC. Thermal properties of the TPUs were studied by a differential scanning calorimeter (DSC 910 from DuPont Instruments equipped with TA 2000). In order to control the thermal history of the samples, all the samples were heated to 230 oC, maintained for 3 min, and then cooled down at -10 oC/min in DSC. Then the samples were quenched to -120 oC. After exotherms due to crystallization of the TPUs were completed the samples were reheated from -100 to 230 oC with a heating rate of 10 oC/min.
Nanoscience and Nanoengineering 1(1): 71-88, 2013 73
Dynamic mechanical properties were measured by a dynamic mechanical analyzer (DMA, DMA 983 equipped with TA2000). Temperature sweeps for the samples were done using the DMA from -100 oC to about 180 oC at 1 Hz under nitrogen gas flow.
2.5. Mechanical Testing Measurement
Tensile properties were measured using a Universal Testing Machine at room temperature with a cross head speed of 500 mm/min.
3. Results and Discussion
The dynamic rheological properties of the concentrated solutions at 50 wt% solids were characterized at room temperature. To characterize the bulk properties of TPUs in Region 3 (φ > φ
GEL) in Figure 1, samples were prepared by casting TPU solutions in a silicone mold and drying at 50 oC. We expect differences in bulk properties of TPUs investigated will not be driven by average molecular weights alone. This is because the average molecular weights of these TPU were not dramatically different than reported earlier [1-5]. The difference is attributed primarily to the nano/micro-domain structure in TPUs induced by the hard segment.
In the bulk, the polyurethane molecules reside in hard and soft segment domains with a two-phase morphology on the micro-scale. The size and nature of the nano/micro-scaled domains with a supramolecular structure from Regions 1 and 2 significantly impacts the structure-property relationship of these hard and soft segmented domains in the bulk, which in turn affects the end-use properties of the polyurethanes. Several models have been reported in the literature to account for the hard segment induced morphological structure found in segmented thermoplastic polyurethane [6-9].
The highlights of our experimental findings on the effect of hard segment molecular weight on the rheological, thermal, dynamic, and mechanical properties are described in the following sections. Our results are in agreement those reported in the literature.
3.1. Dynamic Rheological Properties of Concentrated Solutions
Figure 2 gives a plot dynamic complex viscosity (log η*) vs. frequency (log ω) at different hard segment weight fractions.
Several observations can be made from Figure 2.
[image:3.595.315.545.84.293.2] [image:3.595.317.551.563.721.2]The dynamic complex viscosity remains insensitive to frequency at low hard segment weight fraction as seen in Figure 2. We did however, observe shear thining behavior with increasing high hard segment.
Figure 2. Log η* vs. log ω for different TPU solutions at 25℃
(█)TPU HS1; (●)TPU HS2; (▲)TPU HS3; (▼)TPU HS4; (◀)TPU HS5
The dynamic complex viscosity increases with increasing hard segment weight fraction at a constant angular frequency. This behavior is primarily attributed to the morphology rather than the molecular weight since the average molecular weights of these TPUs were not significantly different as seen in Table 1.
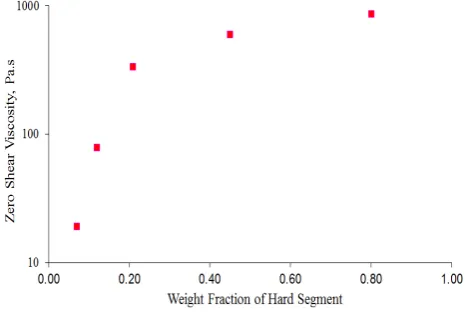
At a very low frequency, the complex viscosity approaches to zero (simple) shear viscosity. The zero shear viscosity (extrapolated dynamic viscosity at zero angular frequency) of the TPUs in DMF solution increases with increasing weight fraction of hard segment,and then levels off at about 0.4 weight fraction of the hard segment as seen in Figure 3.
The increase in zero shear viscosity is primarily due to the increase in the domain size from nano scale to micro scale due to intermolecular interactions.
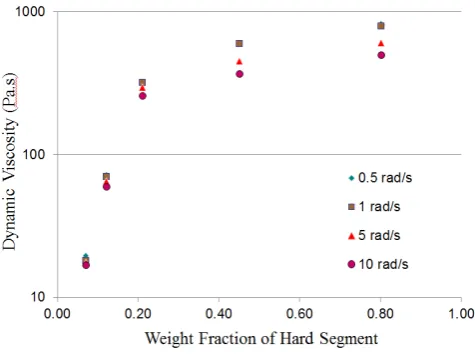
Similarly in Figures 3 and 4, the increase in the dynamic complex viscosity appears to reach a constant value at a weight fraction of hard segment higher than 0.4 for several frequencies.
Figure 4. Log η* vs. Weight fraction of Hard Segment at 25℃
[image:4.595.181.429.310.729.2]Figures 5 and 6 show a plot of storage modulus (log G’), loss modulus (log G”) vs. frequency (log ω), respectively, at different hard segment weight fraction.
Figure 5. Log G’ vs. log ω for different TPU solutions at 25℃.
(█)TPU HS1; (●)TPU HS2; (▲)TPU HS3; (▼)TPU HS4; (◀)TPU HS5
Nanoscience and Nanoengineering 1(1): 71-88, 2013 75
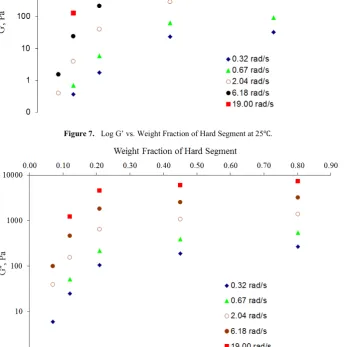
[image:5.595.136.481.163.511.2]Figure 7. Log G’ vs. Weight Fraction of Hard Segment at 25℃.
Figure 8. Log G” vs. Weight Fraction of Hard Segment at 25℃. Several interesting findings are illustrated in these figures.
As expected, log G’, and log G” increase with increasing frequency at a fixed weight fraction of hard segment. However, the shape of the curves for log G” vs. log (ω) appears to be more linear than log G’ vs. log (ω), particularly at a low weight fraction of hard segment. With increasing weight fraction of the hard segment, log G’ vs. log (ω) becomes more linear.
At a constant frequency, both G’ and G” increase with increasing hard segment weight fraction. This increase is more pronounced at low weight fraction than at high weight fraction. In fact, the increase seems to reach a constant value for G’ (Figure 7) and for G” (Figure 8) at weight fraction of hard segment higher than 0.4 for several frequencies.
These findings suggest that when weight fraction of hard segment is above 0.4, the TPUs in 50 wt% DMF solution exhibit very different structures compared to that for low
weight fractions. This structure is induced by increasing intermolecular interactions driven by chemical composition and hydrogen bonding with increasing hard segment molecular weight. Ultimately, the solution is now experiencing increased “structural” or “supramolecular ordering” due to the secondary bonding as depicted in Figure 1.
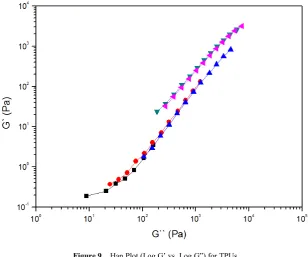
This finding of a “more structural” nature in the TPU solutions appears to be supported by a Han Plot [10], as shown in Figure 9 and in Table 2.
A Han Plot is a plot of Log (G’) vs. Log (G”) that shows virtually independence of temperature for a number linear and flexible homopolymers. The slope of the correlation in a Han Plot is 2 at the terminal region in the viscoelastic spectrum and it is usually independent of temperature and molecular weight.
“more structural” and has deviated from its random coil state. The more structured ordering occurs at a higher MWD, which results in a smaller value of the slope in a Han Plot [10, 12].
In recent decades, Han and his coworkers have demonstrated, both experimentally and theoretically, the usefulness of this type of plot to determine the structural state of a great number of polymeric fluids, especially for block copolymers and liquid crystalline polymers. A more comprehensive discussion of the use of Han Plots for other
polymer systems can be found in the two monographs recently published by Han [10].
We observe that the curves in Figure 9, instead of collapsing into one graph, have split into two sets and each set of curves has a different slope in the plots of log G’ vs. log G”.
The first set of curves, which is collapsed together as one single graph in the Han Plot, is from the data for weight fraction of hard segment from 0.07 to 0.209.
[image:6.595.149.458.205.462.2]Figure 9. Han Plot (Log G’ vs. Log G”) for TPUs (█)TPU HS1; (●)TPU HS2; (▲)TPU HS3; (▼)TPU HS4; (◀)TPU HS5
Table 2. Estimated Parameters for Han Plot by Regression in Figure 9
The slope of the Han Plot is found to be 1.5818, suggesting the structure of the fluids has been ordered on a nanoscale. Similar observations were found in the study by Yoon and Han [11] where they observed that the microstructure in TPUs depends very much on the thermal history.
The second set of data, also collapsed into one curve from weight fraction 0.450 to 0.801. The slope is 1.4051, suggesting the structure of the fluid is even more ordered. Ultimatly the Han Plot is sensitive in determining the effect of hard segment on the supramolecular structure in TPU solutions. Table 2 gives estimates of the parameters for the Han Plot by regression.
Nanoscience and Nanoengineering 1(1): 71-88, 2013 77
[image:7.595.164.446.291.506.2]Figure 10. Han Plot for Multiblock and Triblock Polyamides (Data taken from Fig. 14 of Arun and Gaymans, 2008) [13]
Figure 11. Shear Viscosity vs. Shear Rate at 190 oC (█)TPU HS1; (●)TPU HS2; (▲)TPU HS3; (▼)TPU HS4; (◀)TPU HS5 Note that even at 50 wt% polymer in DMF, the
polyurethane polymer solutions still remain in Region 1 because the tan (δ) is never less than one (i.e., G” > G’) as seen in Figures 5, 6, and 9. Because of the formation of nano-domain supremolecular structures in higher weight fraction of hard segment at above 0.4, the polymer solutions exhibit shear thinning behavior as seen in Figure 2.
3.2. Rheological Properties of Melts
3.2.1. Melt Viscosity of the TPUs at 190 and 200oC
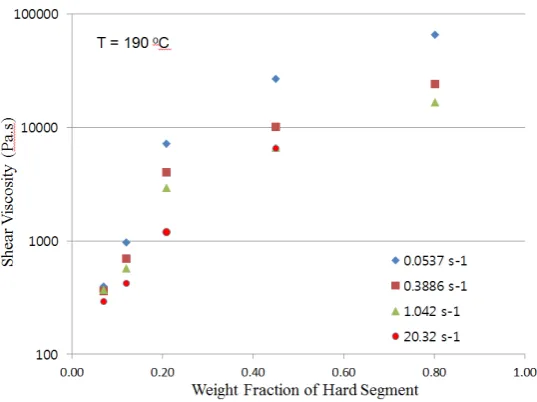
Figures 11 and 12 give plots of simple shearing viscosity, (log η) vs. shear rate (log γ), at different hard segment weight fraction, measured at 190 oC and 200 oC, respectively. Several effects are illustrated in Figures 11 and 12.
Unlike the dynamic viscosity of the concentrated solution and of the melts (see next section), the shear viscosity of the
melts is very sensitive to shear rate for both temperatures, except at 190 oC at 0.07 weight fraction of the hard segment. We observed that the melts exhibit higher shear thining with increasing high hard segment and the effect is more profound at 190 oC than at 200 oC. Since the rheological behavior is affected primarily by the morphology rather than the molecular weight, we expected the temperature will play a critical role in the determination of the flow behavior of the TPUs.
Similar to the dynamic viscosity of 50 wt% TPU in solution, the rise in shear viscosity with increasing weight fraction of the hard segment at 190 oC and 200 oC. At 200 oC, the results in Figure 13 are very similar to those found in dynamic complex viscosity of 50% TPU in DMF.
Figure 12. Shear Viscosity vs. Shear Rate at 190 oC (█)TPU HS1; (●)TPU HS2; (▲)TPU HS3; (▼)TPU HS4; (◀)TPU HS5
Figure 13. Log η vs. Weight Fraction of Hard Segment at 200 ℃
[image:8.595.171.440.541.742.2]Nanoscience and Nanoengineering 1(1): 71-88, 2013 79
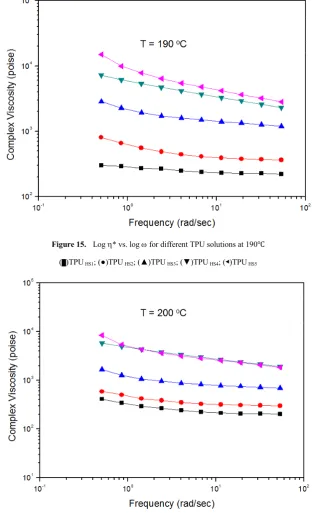
Figure 15. Log η* vs. log ω for different TPU solutions at 190℃
[image:9.595.146.459.87.601.2](█)TPU HS1; (●)TPU HS2; (▲)TPU HS3; (▼)TPU HS4; (◀)TPU HS5
Figure 16. Log η* vs. log ω for different TPU solutions at 200℃ (█)TPU HS1; (●)TPU HS2; (▲)TPU HS3; (▼)TPU HS4; (◀)TPU HS5
3.2.1. Dynamic Complex Viscosity of the TPU Melts
Figures 15 and 16 give plots of dynamic complex viscosity (log η*) vs. frequency (log ω) at different hard segment weight fraction at 190 and 200 oC, respectively.
As seen from Figures 11 and 15 at 190 oC, and Figures 12 and 16 at 200 oC, the flow behavior of the TPU melts are similar in the shear viscosity measurement and the dynamic viscosity measurement. Similar to the shear viscosity of the TPU melts, the increase in the dynamic complex viscosity
seems to reach to a constant value at a weight fraction of hard segment of 0.4 for several frequencies.
3.2.2 Han Plots of the TPU Melts
[image:9.595.153.456.335.606.2]The first set of curves collapsed together as a single curve in the Han Plot for both temperatures is from the data for weight fraction of hard segment from 0.07 to 0.209. The second set of data which also collapses to one curve is from the weight fraction 0.450 and 0.801 for both temperatures. Therefore, the Han Plot is useful for determining the effect of hard segment on the supramolecular structure in TPU solutions and in the melts. Lem et al.[14-15] have found the Han Plots are extremely useful in the development of self cracking asphats materials.
3.3. Thermal Properties
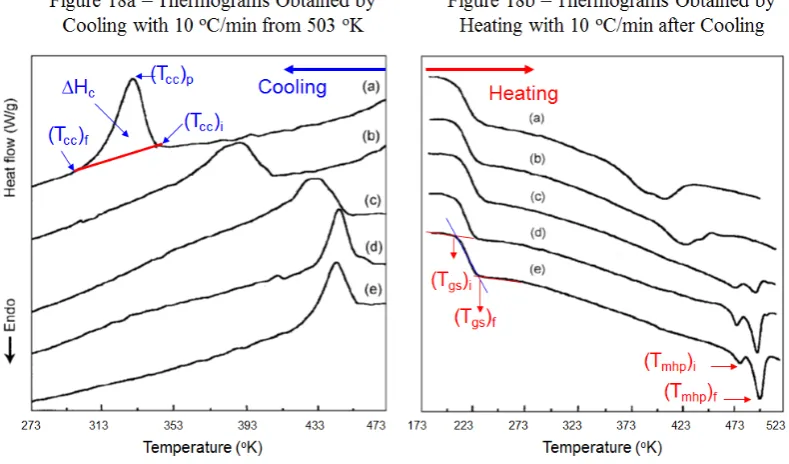
[image:10.595.148.462.216.454.2]The thermal treatment approach above is used to generate similar micro-domain structure, with a controlled thermal history without any annealing [6-9; 16-18]. The DSC cooling curves and heating curves after crystallization created by cooling with 10 oC/min for TPUs are shown in Figure 18a, and Figure 18b, respectively [4, 5].
[image:10.595.108.503.501.733.2]Figure 17. Han Plot (Log G’ vs. Log G”) for TPU Melts (Open Symbol = 200 oC; Closed Symbol = 190 oC) (█)TPU HS1; (●)TPU HS2; (▲)TPU HS3; (▼)TPU HS4; (◀)TPU HS5
Nanoscience and Nanoengineering 1(1): 71-88, 2013 81
Also, in Figure 18a, and Figure 18b, the nomenclature of the transition temperatures observed during cooling and heating of these samples was defined as follows:
In Figure 18a, ∆Hc is the heat of crystallization of the hard segment and is the area under the exotherm peak. The on-set crystallization temperature is defined as (Tcc)i, the peak temperature is (Tcc)p, and the temperature where the transition concludes is (Tcc)f.
In Figure 18b, the on-set glass transition temperature of the soft segment is defined as (Tgs)i, and the off-set glass transition temperature is (Tgs)f. Also, the first melt endotherm peak temperature for the hard segment is defined as (Tmhp)i, and the final endotherm peak temperature is
(Tmhp)f.
[image:11.595.163.450.247.454.2]Several interesting features are apparent in Figure 18. Cooling induced crystallization behavior of the hard segment in a thermoplastic polyurethane depends on chemical composition and nature of the hard and soft segments as seen in Figure 18a. As with the dilute solution measurement, the change of the crystallization behavior is very profound at low weight fraction of the hard segment. The increase of Tccof TPU implies that the crystallization of hard segments results in a crystalline order that melts at higher temperatures. This suggests greater crystalline perfection but further study is needed to substantiate this assertion.
Figure 19. Hard Segment Crystallization Temperatures vs. Weight Fraction of Hard Segment
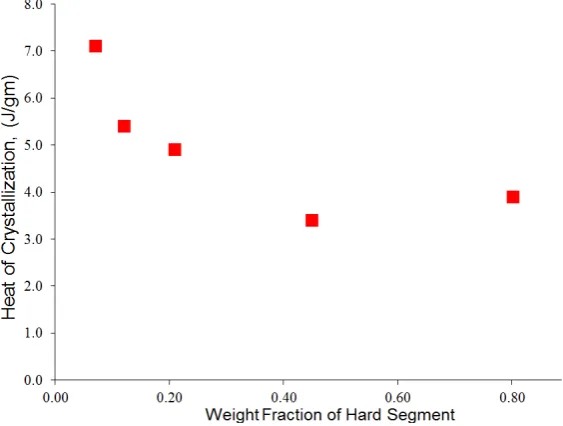
At high hard segment weight fraction (≥0.4) this change appears to approach a constant value as seen in Figure 19. However, the heat of crystallization of the hard segment dramatically decreases and levels off with increasing weight fraction of hard segment as seen in Figure 20. According to Kim and Lee [4], the decrease of ∆Hc with increasing hard segment length is attributable to the decrease of the MDI portion of the hard segment even though the overall composition of TPUs is fixed [2-5].
[image:11.595.166.448.537.750.2]DSC thermograms were obtained by heating the samples after crystallization by cooling at 10 oC/min as illustruated the process in Figures 18b. The glass transition temperatures of the soft segment (Tgs) of TPUs in Figure 21 decreased slightly and becomes almost constant with increasing hard segment molecular weight.
Figure 21. Glass Transition Temperatures of Soft Segment vs. Weight Fraction of Hard Segment
The same trend is observed with the Tgs obtained from DMA measurement using the peak value of E” (in Figure 25 and Table 4), even though their values are higher than those obtained by DSC. The slight decrease of Tgsis attributable to the lower degree of hard-soft segment micro domain mixing [4, 18].
[image:12.595.159.455.433.636.2]There are several findings that are worth noting in the melt temperature of the hard segment (Tmh ) in Figures 18b and Figure 22:
Figure 22. Melting Temperatures of Hard Segment vs. Weight Fraction of Hard Segment
There are two melting peaks, with increasing hard segment molecular weight; the resolution becomes sharper with very little overlap (see Figure 18b). As seen in Table 3 and Figure 23, it can be pointed out that the results obtained by Kim and Lee [4], and by Leung and Koberstein [18]are of the same order of magnitude even though the TPU systems were different in their studies.
The increase in the melting temperature of the hard segment crystallites is more dramatic at low weight fraction. The increase of Tmh resulted from the increase in the hard segment molecular weight. However, at about 0.2 weight fraction or greater, the melting temperature stabilizes.
Nanoscience and Nanoengineering 1(1): 71-88, 2013 83
[image:13.595.102.505.154.600.2]length sequences to crystallize preferentially. It is speculated that increasing hard segment molecular weight of TPU resulted in both extended and folded hard segment conformations which give rise to the increase in Tmh at lower weight fraction and then Tmh levels off at high weight fraction of hard segment where the intermediate length sequences are readily available.
Table 3. Melting Temperatures of Hard Segment vs. Weight Fraction of Hard Segment
Figure 24. E’ vs. Temperature of TPUs (After Kim and Lee, 2002)3 (█)TPU HS1; (●)TPU HS2; (▲)TPU HS3; (▼)TPU HS4; (◀)TPU HS5
Figure 25. E” vs. Temperature of TPUs (After Kim and Lee, 2002)3 (█)TPU HS1; (●)TPU HS2; (▲)TPU HS3; (▼)TPU HS4; (◀)TPU HS5 3.3. Dynamic Mechanical Properties
Figures 24 and 25 present the changes of storage moduli and loss moduli with temperature for the TPUs investigated. The storage modulus of TPU showed a decrease of the glass-rubbery transition temperature of soft segments around -30 oC and another decrease after the rubbery plateau region due to melting of hard segment crystallites. We observed that the rubbery plateau modulus increased with increasing hard segment molecular weight [3, 4].
The glass transition temperatures of the soft segment (Tgs) of TPUs, using the peak value of E” in Figure 25, decreased slightly and became almost constant with an increase in hard segment molecular weight of about 0.4 weight fraction
of hard segment. The same trend is observed with the Tgs obtained from DSC in Table 4.
Nanoscience and Nanoengineering 1(1): 71-88, 2013 85
Table 4. Glass Transition Temperatures of Soft Segment from DSC & DMA Measurement
Figure 26. Stress and Strain of TPUs (After Kim and Lee, 2002)3 (█)TPU HS1; (●)TPU HS2; (▲)TPU HS3; (▼)TPU HS4; (◀)TPU HS5 The increase of the rubbery plateau moduli of TPUs
indicates that the higher molecular weight of the hard segments resulted in efficient physical crosslinking as indicated in Figure 24. It is of interest to note that the rubbery plateau region becomes broader with increasing hard segment molecular weight due to the increase of Tmh, as shown in Figure 18b and Table 4. As with our other observations there is a very strong relationship at lower weight fractions, but the effect stabilizes at approximately 0.4 weight fraction hard segment.
3.4. Mechanical Properties
The mechanical properties that have been extrapolated from the stress and strain curves for TPUs and are shown in Figure 26 and are given in Table 5.
An upturn in the stress-strain curves is observed for increasing hard segment molecular weight. During the mechanical extension testing, TPU specimens exhibited
exotherms due to crystallization since extension of elastomers frequently results in crystallization and strain hardening.
TPUs with higher weight fraction of hard segment also have a longer soft segment as seen in the segment structure of Figure 1. The longer soft segment linked by urethane enables stronger secondary bonding during extension because it favors strain induced crystallizations. It is postulated that strain induced crystallization of soft segment is responsible for the upturn in stress-strain curves with increase of the hard segment molecular weight as shown in Figure 26.
Table 5. Mechanical Properties of TPUs
Figure 27. Elongation at Breaking vs. Weight Fraction of Hard Segment
[image:16.595.158.458.493.691.2]Nanoscience and Nanoengineering 1(1): 71-88, 2013 87
Figure 29. Summary of Experimental Findings The break strength of these TPU elastomers increases
with weight fraction of hard segment as shown in Figure 28. The rate of increase was higher at low weight fraction of hard segment and it was decreased at about 0.4 weight fraction of the hard segment. With the exception of Young’s modulus, the high % extension moduli decreases with weight fraction of hard segment and reaches a constant value at about 0.4 weight fraction of hard segment as shown in Table 5.
4. Concluding Remarks
The ultimate purpose of this type of study is to provide a roadmap to deliver the desired end-use performance of a thermoplastic polyurethane product based on the optimal design of the starting materials. Using a bottom-up approach to study the effect of hard segment length (i.e., molecular weight) on properties of a polyurethane material from a very dilute solution to bulk [1-5, 21], we found that the critical weight fraction of hard segment, in our study, is about 0.4 for the purposes of tuning the physical properties.
As seen in Figure 29, with exception of very few properties, most properties transition from solution to bulk and reach a constant value. This critical value may help us understand the nature and tunability of TPUs: For example;
(1) the role of the size and shape of hard segment controlled polyurethane molecules
(2) the formation of nano-domains in very dilute solution (3) the micro-domains in concentrated solutions
(4) the hard and soft segmented domains in the bulk via intermolecular interactions
(5) the polymer end-use performance
It is suggested that with the findings of this study, the
properties of a TPU can be tuned using the nature of molecular dynamics in mixing of the hard and soft segments in nano-size domains [1-5].
Acknowledgements
This study was supported by R & D Center for Valuable Recycling (Global Top Environmental Technology Development Program funded by Ministry of Environment. (Project No. 11-A04-OD).
REFERENCES
[1] K. W. Lem, J. R. Haw, S. Curran, S. Sund, C. Brumlik, G. S. Song, and D. S. Lee, “Effect of Hard Segment Molecular Weight on Diluted Solution Properties of Ether Based Thermoplastic Polyurethanes,” Nanoscience and Nanoengineering. (Submitted for publication, 2013)
[2] K. W. Lem, D.S. Lee, J. R. Haw, G. S. Song, S. Curran, S.
Sund, Z. Iqbal, and C. Brumlik, “Role of Hard Segment Induced Nanosized Domain on Dilute Solution Properties of Ether Based Thermoplastic Polyurethanes”, NSTI-Nanotech 2011 (Proceeding), (1) 624, 2011
[3] K. W. Lem, D.S. Lee, J. R. Haw, G. S. Song, S. Curran, S.
Sund, Z. Iqbal, and C. Brumlik, “Role of Hard Segment Induced Nanosized Domain on Concentrated Solution Properties of Ether Based Thermoplastic Polyurethanes”, NSTI-Nanotech 2011 (Proceeding), (1) 60, 2011
[4] S. G. Kim, D. S. Lee, “Effect of Polymerization Procedure
[5] V. K. Nguyen, M. J. Li, and M. J. Lee, “Effects of Hard Segment Length on Solution Viscosities of Ether Based Polyurethanes,” Unpublished Data, 2005.
[6] A. Saiani, A. Novak, L. Rodier, G. Eeckhaut, J.-W. Leenslag, and J. S. Higgins, “Origin of Multiple Melting Endotherms in a High Hard Block Content Polyurethane. Effect of Annealing temperature,” Macromolecules, 40, 7252-7262 (2007)
[7] A. Saiani, W. A. Daunch, H. Verbeke, J.-W. Leenslag, and J. S. Higgins, “Origin of Multiple Melting Endotherms in a High Hard Block Content Polyurethane. 1. Thermodynamic Investigation,” Macromolecules, 34, 9059-9068 (2001)
[8] A. Saiani, C. Rochas, G. Eeckhaut, W. A. Daunch, J.-W.
Leenslag, and J. S. Higgins, “Origin of Multiple Melting Endotherms in a High Hard Block Content Polyurethane. 2. Structural Investigation,” Macromolecules, 37, 1411-1421 (2004)
[9] J. T. Koberstein, A. F. Galambos, and L. M. Leung,
“Compression-Molded Polyurethane Block Copolymers. 1. Microdomain Morphology and Thermomechanical Properties,” Macromolecules 25, 6195-6204 (1992)
[10] C. D. Han, Rheology and Processing of Polymeric Materials
(Vol. 1 & 2) (Oxford University Press, 2007. page 682-684. [11] P. J. Yoon and C. D. Han, "Effect of thermal history on the
rheological behavior of thermoplastic polyurethanes,", Macromolecules, 33, 2171-2183 (2000)
[12] C. D. Han and J. K. Kim, “Molecular Theory for the
Viscoelasticity of Compatible Polymer Mixtures. 2. Tube Model with Reptation and Constraint Release Contributions,” Macromolecules, 22, 4292-4302 (1989) (Figure 10)
[13] A. Arun, R.J. Gaymans, “Tri-block copolymers with
mono-disperse crystallizable diamide segments: Synthesis,
analysis and rheological properties,” Polymer, 49, 2461–2470 (2008) (Figure 14)
[14] K. W. Lem, A. Letton, T.P. J. Izod, F. S. Lupton, and W. B. Bedwell, US Patent 6,214,908, April, 10, 2001.
[15] K. W. Lem, A. Letton, T.P. J. Izod, F. S. Lupton, and W. B. Bedwell, USP 6,414,066, July 2, 2002.
[16] L. M. Leung and J. T. Koberstein, “Small-Angle Scattering
Analysis of Hard-Microdomain Structure and Microphase Mixing in Polyurethane Elastomers,” J.Polymer Science: Polymer Physics Edition, Vol. 23, 1883-1913 (1985)
[17] J. T. Koberstein and A. F. Galambos, “Multiple Melting in
Segmented Polyurethane Block Copolymers,” Macromolecules 25, 5618-5624 (1992) J.T. Koberstein and L. M. Leung, “Compression-Molded Polyurethane Block Copolymers. 2. Evaluation of Microphase Compositions,” Macromolecules 25, 6205-6213 (1992)
[18] J.T. Koberstein and R. S. Stein, “Small-Angle X-Ray
Scattering Studies of Microdomain Structure in Segmented Polyurethane Elastomers,” Journal of Polymer Science: Polymer Physics Edition, Vol. 21,1439-1472 (1983)
[19] J.T.Koberstein and R. S. Stein, “Small-Angle Light
Scattering Studies of Macrophase Separation in Segmented Polyurethane Block Copolymers,” Polymer, 25, 171 (1984)
[20] J.T. Koberstein, Irena Gancarz, and T. C. Clarke, “The
Effects of Morphological Transitions on Hydrogen Bonding in Polyurethanes: Preliminary Results of Simultaneous DSC-FTIR Experiments,” J. Polymer Science: Part B: Polymer Physics, 24, 2487-2498 (1986)
![Figure 1. A Roadmap of the Study for the Effect of Hard Segment (After Lem et al., 2011) [1-3]](https://thumb-us.123doks.com/thumbv2/123dok_us/8787697.907761/1.595.180.428.547.729/figure-roadmap-study-effect-hard-segment-lem-et.webp)
![Figure 10. Han Plot for Multiblock and Triblock Polyamides (Data taken from Fig. 14 of Arun and Gaymans, 2008) [13]](https://thumb-us.123doks.com/thumbv2/123dok_us/8787697.907761/7.595.167.444.85.256/figure-plot-multiblock-triblock-polyamides-data-taken-gaymans.webp)