Chris A. Geiger Dennis H. Tootelian
t
The Healthy Schools Act of 2000 es-tablished right-to-know procedures for pesticide use in California public schools, and mandated using least-toxic pest management methods as state policy. In a survey conducted 2 years after the law’s passage, school districts that had integrated pest management (IPM) programs generally used more ecologically sound pest management tactics than districts that did not, and most of those said that IPM had improved their pest management effectiveness. The Healthy Schools Act requires that schools post warning signs, keep pest management records, provide notifications to parents and staff, and maintain a list of parents desir-ing further notifications. A majority of California’s school districts have implemented at least three of these four requirements, with about half reporting full compliance.
B
efore 2001, the kinds and amounts of pesticides used in public schools were mysteries to many Californians. For some parents, these mysteries were worrisome.California lawmakers aimed to ad-dress these concerns by passing the Healthy Schools Act of 2000 (HSA), which established right-to-know re-quirements for pesticide use (see side-bar, page 236) in public schools and required all school districts to designate an integrated pest management (IPM) coordinator (HSA 2000). The lawalso directed the California Department of Pesticide Regulation (DPR) to col-lect certain pesticide-use information from schools, such as the amount of pesticides used in eating areas or in classrooms, and to support schools in
RESEARCH ARTICLE t
Healthy Schools Act spurs integrated pest
management in California public schools
Pressure from the local
community is likely to be a
strong factor contributing to
a district’s adoption of IPM.
their IPM efforts, emphasizing pest prevention instead of more hazardous pesticide spraying.
To track the progress of Healthy Schools Act implementation, DPR dis-tributed surveys to all California public school districts in 2002. The results presented here reveal patterns of pest management practices used for two of the most common school pests, ants and weeds. The survey also examined the levels of adoption for various IPM- related policies (including those re-quired by the Healthy Schools Act), and compared the practices of districts that have IPM programs with those that do not. (Private schools are not covered by Healthy Schools Act mandates.)
DPR based the 2002 survey on a previous survey distributed in 2001 (DPR 2001). The 2001 survey placed more emphasis on assessing school dis-tricts’ resource needs; the 2002 survey was intended to profile schools’ pest management activities and measure their progress in adoption of IPM. The
2002 survey also began measuring the long-term progress of DPR’s School IPM Program, which is charged with organizing IPM trainings, creating an IPM guidebook, developing a Web site (www.schoolipm.info), and gen-erally assisting school districts with implementing IPM (see page 201). The 2002 survey consisted of 21 questions; copies were mailed to IPM coordina-tors at all 988 California public school districts. The response rate was 42% (Geiger and Tootelian 2002).
(question 5: “Which [pest control method] do you use most frequentlyto manage ants inside school buildings?”). Measuring progress toward IPM
The Healthy Schools Act includes its own IPM definition (see sidebar, page 237) and other general definitions of IPM abound (Bajwa and Kogan 1998). However, there is no widely accepted operational definition; that is, a defini-tion specific enough to serve as the basis for measuring IPM adoption. While attempts have been made to set up such standards, their success has been hampered by the diverse nature of pest management systems.
Therefore, we developed our own approach to defining and measuring IPM in schools. After discussions with school personnel and a review of the IPM literature (Benbrook 1996; Huffaker and Messenger 1976; Stern et al. 1959), we categorized four activitiesas central
to a successful school IPM program: (1) monitoring pest populations, (2) em-phasizing pest prevention, (3) keeping records and (4) using chemical pesti-cides only as a last resort. Referring to these categories, DPR staff classified cer-tain pest-management practices as “com-patible with” or “contrary to” IPM (see sidebar, page 237). We asked about these practices in the survey and summarized each participant’s responses as an IPM index, which was calculated by award-ing one point for each compatible prac-tice and subtracting one point for each contrary practice. This index provides a measure of school IPM adoption over time, and also helps to revealwhether self-categorization as an IPM district ac-tually translates into better practices.
To keep the survey as short as pos-sible and maximize response rates, we focused the questions on two representa-tive categories of pests: weeds and ants. We chose weeds and ants because they
The Healthy Schools Act
requirements
The Healthy Schools Act (HSA 2000) re-quires that all public school districts must:
• Provide annual written notification
to all school staff, parents and guard-ians listing all pesticide products (some products are exempt) expected to be applied by district staff or outside contractors in the upcom-ing year, and the Internet address to DPR’s School IPM Program Web site (www.schoolipm.info).
• Provide the opportunity for inter-ested staff and parents toregister
with the school district if they want to be notified of individual pesticide applications at the school before they occur.
• Post warning signs at each area of the school where pesticides will be ap-plied, posted 24 hours in advance and until 72 hours after applications.
• Maintain public records of all
pesti-cide use at the school for 4 years.
• Designate an IPM coordinator to
carry out these requirements.
For more information about these HSA re-quirements, contact Dave Hawke, California Department of Education, at (916) 322-1459, or dhawke@cde.ca.gov.
The Act requires the California Depart-ment of Pesticide Regulation (DPR) to:
• Prepare a schoolpesticide-use
report-ing form to be used by licensed pest-control businesses when they apply any pesticides at a school.
• Establish and maintain a school Web
site to provide specified information to the public on school IPM (see www. schoolipm.info).
• Promote and facilitate the voluntary
adoption of school IPM programs
through specified activities, and assist districts in complying with the law. In addition, the Act requires that:
• Licensedpest-control businesses
must report pesticide applications by
school annually to the DPR director.
For information on these requirements, con-tact Nita Davidson, DPR, at (916) 324-4100 or school-ipm@cdpr.ca.gov.
Ants, such as the adult Argentine ant, top,
were ranked by California school districts as their third-most-difficult pest to control (after weeds and gophers). Rather than spraying them with pesticides, ants can be controlled with baits, middle row, or ex-cluded by caulking cracks, left.
Jack K
elly Clark
Jack K
elly Clark
David Rosen
Jack K
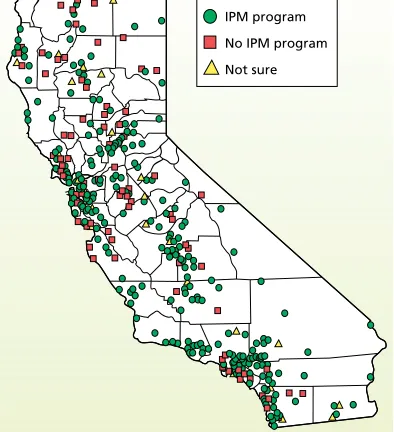
Fig. 1. Responding California school districts that reported having an IPM program in place in 2002.
represent both landscape and structural pest-management issues, and because they were ranked the first and third most serious school pests, respectively, in the 2001 survey (gophers were number two).
Weed management
Managing weeds requires a lot of la-bor, especially at rural schools with ex-tensive turf and landscape areas. School districts varied widely in their decision-making approaches for weed treatment. Nearly one-third (30%) of school dis-tricts reported using the approach that would be preferred in an IPM program, which is treating weeds “when the abundance exceeds a pre-established threshold” (see Geiger and Tootelian [2002] for survey details). About one-fifth (23%) of districts treat “when weeds are first noticed.” The single largest group (35%) reported treating weeds at regular, predetermined inter-vals. However, this result is difficult to interpret. While regular weeding is part of a sound IPM strategy, calendar-based herbicide spraying generally is not (UC
IPM 2001). One possibility is that some respondents might have misinterpreted
treating at regular intervals to mean
weeding at regular intervals, thus inflat-ing the 35% figure. Another possibility is that Healthy Schools Act notification requirements may have inadvertently increased calendar-based herbicide spraying. In phone calls to DPR staff, some schools reported that they now designate certain days of the year for pesticide treatments, thereby enabling them to send out fewer special notifica-tions to parents.
For the treatment of weed problems, respondents cited physical controls such as hand-pulling, cultivating and mow-ing most frequently (68%), followed by regular spot treatment of turf/land-scaping with herbicides (61%), use of mulches (26%), regular broadcast treat-ment of turf and/or landscaping with herbicides (23%), irrigation manage-ment (17%) and flaming — the use of special propane weed torches (7%). The use of broadcast herbicide treatments, which is considered contrary to IPM in
this analysis, may be due to the pressure to maintain aesthetically pleasing turf in athletic fields as well as the perception that other controlsare too labor-intensive for such large areas.
Ant management
It only takes a few drops of soda or a few cookie crumbs in a child’s desk to attract the familiar train of ants. For this reason, ants are the most universal indoor pest in California schools (DPR 2001) and prevention is a critical part of ant IPM. We would expect a district’s ant management ap-proach to reveal much about its overall pest-management phi-losophy, since ants are primarily an aesthetic pest that rarely jus-tify emergency pesticide spray-ing (the red imported fire ant
HSA definition of IPM
Under the Healthy Schools Act, integrated pest management (IPM) is defined as: “a pest management strategy that focuses on long-term prevention or suppression of pest problems through a combination of techniques such as monitoring for pest presence and establishing treatment threshold levels, using nonchemical practices to make the habitat less conducive to pest development, improving sanita-tion, and employing mechanical and physical controls. Pesticides that pose the least possible hazard and are effective in a manner that minimizes risks to people, prop-erty and the environment, are used only after careful monitoring in-dicates they are needed according to pre-established guidelines and treatment thresholds.”
For purposes of this survey, IPM was defined as including (or ex-cluding) the following practices:
Compatible with IPM • Keeping records of: – building inspections – pest sightings
– results of pest monitoring – pest treatments used • Treatment decisions based
on pre-established thresholds for ants and weeds
• Ant baits
• Improving sanitation for ant control
• Caulking cracks for ant control • Physical controls for weeds • Irrigation management
for weed control
• Mulches for weed control • Flaming for weed control
Contrary to IPM
• Treatment at regular time intervals
• Insecticidal sprays from aerosol cans for ants
• Regular broadcast of herbicides for turf or landscape weeds TABLE 1. Frequency of community inquiries on pest management–related issues*
Weekly Monthly < 1 per month Respondents
. . . % . . . no.
Districts with IPM programs 2.5 9.5 88.0 284
Districts with no IPM program,
or not sure 1.6 2.4 96.0 124
All respondents 2.2 7.8 90.1 413
most frequently reported the following IPM-compatible methods: improved sanitation (64%) ant baits (59%), soapy water (38%) and caulking (36%). Ant bait is considered an IPM-compatible ant management method because bait formulations kill the entire ant colony and children are not likely to be exposed to pesticides in baits (as opposed to sprays). However, many pest managers reported using baits as their sole tech-nique, suggesting a lack of integration with preventive practices.
Nearly one-tenth (9%) of responding districts most frequently used the ant con-trol method that is least compatible with an IPM program, “insecticidal spray from an aerosol can.” In addition, 17% of districts reported using spray cans either aloneor in conjunction with other methods.
How IPM stacks up
[image:4.612.170.577.338.698.2]We asked whether school districts had adopted IPM programs, realizing
TABLE 2. Inventory of IPM-compatible and non-IPM compatible pest management practices compared between districts with and without
IPM programs (self-reported)*
IPM Non-IPM
IPM-compatible practices districts districts Z . . . % . . . . . Keeping records of:
Building inspections 44 28 *
Pest sightings 27 14 *
Results of pest monitoring 20 12 *
Pest treatments used 89 79 *
Treatment decisions based on pre-established thresholds for:
Ants† 16 6 *
Weeds‡ 33 22 *
Ant baitsठ62 53
Improved sanitation for ant control† 67 55 * Caulking cracks for ant control† 38 30 Soapy water for ant control† 41 28 Physical controls for weeds‡ 71 65 Irrigation management for weed control‡ 21 8 *
Mulches for weed controlठ30 15 *
Flaming for weed control‡ 8 7
IPM Non-IPM
Non-IPM-compatible practices districts districts Z
. . . % . . . . . Treatment at regular time intervals for:
Ants† 15 19
Weedsठ40 33
Insecticidal sprays from aerosol cans for ants† 16 22 Regular broadcast of herbicides for turf or
landscape weeds† 23 21
* Districts reporting that they were not sure if they had an IPM program were pooled with non-IPM districts. When results differed by more than 5%, the higher number is shown in bold. Asterisks denote significant differences (1-tailed, Z-scores, P≤ 5%).
† Percentage of total number of respondents who treat for ants. ‡ Percentage of total number of respondents who treat for weeds. § Not included in IPM index calculation; all other factors included.
[Solenopsis invicta] is the exception). The survey asked how school pest managers decide whether treatments for ants are necessary. Only 13% of districts treated for ants “when the number of ants exceed pre-established thresholds,” a strategy that is part of a sound ant IPM program. Another 16% of the dis-tricts treated for ants “at regular time intervals,” an approach that is not con-sidered part of a sound IPM program, 31% do so “after a certain number of complaints are received” and 33% treat for ants when “first noticed.”
Improved sanitation and the use of ant baits were the most popular prac-tices for controlling ants in school build-ings. When asked to identify the “single method used most frequently” for ants in buildings, 32% of respondents identified ant baits, followed by im-proved sanitation at 22%. When asked to inventory all methods used to man-age ants inside buildings, respondents
that districts’ definitions of IPM were likely to vary widely, especially between agricultural areas (where the term is commonplace) and urban areas (where it is not). More than two-thirds (70%) of respondingCalifornia school districts reported adopting an IPM program, and 87% reported that they are aware of DPR’s School IPM Program. Regions with the largest percentage of districts report-ing IPM programs were the San Francisco Bay Area, Los Angeles Basin, southern coast, San Joaquin Valley and southeast-ern desert regions (fig. 1, page 237).
Pressure from the local community is likely to be a strong factor contrib-uting to a district’s adoption of IPM. Local concern is a driving force because the Healthy Schools Act contains no enforcement provisions. As an indirect measure of community concern about pesticides, we asked districts how fre-quently they received community in-quiries on pest management issues. We
Managing weeds can be difficult and labor intensive for schools, espe-cially those in suburban and rural areas with large turf and landscape areas. Physical controls such as mowing and hand-weeding, above,
were reported by 68% of the survey respondents, while 61% regularly sprayed with herbicides, top.
Suzanne P
aisley
Jack K
Fig. 2. IPM index scores of California school districts; higher scores indicate greater use of IPM-compatible practices for weeds and ants. IPM index calculation source: Geiger and Tootelian (2002).
compared to 4,686 for non-IPM districts (Los Angeles Unified School District, by far the largest in the state, was dropped from this analysis). There was also a weak but nonsignificantrelationship between school type and IPM adop-tion. However, this relationship could not be separated from the enrollment effect because urban districts are also significantly larger than rural ones. Surprisingly, there was no relationship between district size and reported fre-quency of inquiries.
To find out what the reported use of IPM meant in terms of pest manage-ment tactics actually used, we sum-marized pest management practices deemed compatible with and contrary to IPM principles (table 2). Then we compared both the reported and actual use of these practices in districts that did and did not have IPM programs. We would expect a higher percentage of IPM districts to use IPM-compatible practices and a higher percentage of non-IPM districts to use IPM-contrary practices.
These expectations were gener-ally confirmed, with two exceptions: a slightly higher percentage of IPM districts reported “treating at regular time intervals for weeds” and “use of regular broadcast herbicides for turf or landscape weeds,” both of which might be considered contrary to good IPM practices.Another interesting result was that even IPM districts used insecticides from aerosol cans for ants, a method clearly contrary to sound IPM. In light of this finding, further educational ef-forts should be directed at keeping these
cans out of the classroom.
We also examined differences be-tween rural and urban districts’ pest management practices. Rural residents are generally more familiar with agri-cultural pesticide use, and we might expect them to evaluate the risks of pesticide use differently than their ur-ban counterparts, which could result in fewer inquiries to school districts and different pest-management philoso-phies. Indeed, rural districtsdid receive significantly fewer inquiries than ur-ban districts. Only about 3% of rural districts reported receiving at least one inquiry per month, compared to 21%of districts in large cities and 13% of those in urban fringes of large cities.
To illustrate the geographical distri-bution of IPM-compatible practices, we constructed an unweighted IPM index using the practices listed in table 2 (fig. 2). Although it is difficult to discern a pattern, the highest-scoring districts ap-peared to be concentrated in coastal and metropolitan areas.
IPM costs and effectiveness
Pinning down a dollar figure for IPM costs and benefits can be a difficult task, especially with unknown benefits such as the long-term avoidance of new pest infestations and the reduction of hu-man health risks. However, more than half (53%) of the responding districts would expect school districts with high
levels of community concern to be more likely to adopt IPM programs.
In general, the results support this expectation. In table 1 (page 237), 8% more IPM districts than non-IPM dis-tricts received pest management inqui-ries either weekly or monthly, implying a correlation between community con-cern and the adoption of IPM. When the weekly and monthly columns are pooled (due to the skewed distribu-tion of data), the IPM districts showed significantly more frequent community inquiries (chi-squared, P < 0.01). Very few districts (about 2%) receive one or more inquiries per week, while those that reported inquiries at least once per month were most prevalent in the southeastern region (19%), Bay Area (16%) and Los Angeles Basin (12%). Region was not, however, a significant predictor of IPM adoption.
Two other interrelated factors that could contribute to school IPM adoption are school size (enrollment) and type (such as rural, suburban or urban). We might expect that larger districts or those inurban areas, with more staff, centralization and special-ization, would be better able to adopt new pest-management approaches and systems. For these analyses, we defined “urban” districts as those in medium or large cities or their urban fringes in the CDE database; all other categorieswere considered “rural.”
The data showed that enrollment was a significant predictor of IPM adop-tion (t-test, P < 0.05). The average size of IPM districts was 8,455 students,
Less-toxic practices to prevent school pests include: left, designing buildings to prevent roosting pigeons, which can carry diseases, and, right, installing mowing strips to prevent weed growth along fence lines.
Photos:
reported that their IPM programs either reduced long-term costs (28%) or had no impact on those costs (25%). In contrast, more than a quarter (28%) reported that their IPM programs increased the long-term costs of pest management.
We also asked IPM districts to evalu-ate the overall effectivenessof their programs. Two-fifths (41%) reported that their program had resulted in more-effective pest management, one-fifth (19%) were uncertain of its effects, and one-fifth (20%) reported that their program resulted in less-effective pest management; the remaining districts did not respond.
IPM policies and HSA compliance The survey listed a series of IPM-related practices and policies, and asked respondents which ones their district had officially adopted (fig. 3). The most common practices/policies reported were the four right-to-know provisions specifically required by the Healthy Schools Act: (1) posting warn-ing signs, (2) providwarn-ing annual noti-fication of expected pesticide use, (3) maintaining a list of parents wanting to be notified and (4) maintaining a list of pesticides used during the previous 4 years. Nearly three-quarters (71%) of California school districts had officially adopted at least three of these four pro-visions. However, less than half (49%) of responding districts adopted all four provisions, which means that by this measure about half (51%) are still not in full compliance.
We also asked all respondents to rate their satisfaction in the previous year with six factors that we considered important to the success of school IPM programs (fig. 4). Significantly more IPM districts rated their performance as “good” for all factors except “contract-ing procedure,” suggest“contract-ing that they are more satisfied than non-IPM districts with their pest control efforts. Schools’ progress toward IPM
[image:6.612.57.402.45.273.2]Although some questions in the 2001 and 2002 DPR surveys were not designed for direct comparison, a com-parison of the two surveys shows that California schools are making progress toward adopting more-accountable, Fig. 3. IPM practices and policies reported as “officially adopted” by California school
districts. Percentages shown may understate actual use of these practices.
TABLE 3. Comparison of 2001 and 2002 responses to survey questions regarding practices considered contrary to (red) and compatible with (green) IPM programs*
Responses 2001 2002 Z
. . . % (no.). . . Record-keeping:
Pest sightings 16 (61) 23 (94)
Results of pest monitoring 11 (44) 17 (73)
Pest treatments used 79 (312) 86 (360)
Decision to treat for ants inside buildings:†
At regular time intervals 16 (48) 16 (49)
When ants are first noticed 41 (119) 33 (101)
When number of ants exceeds pre-established thresholds 10 (29) 13 (39)
After certain number of complaints by constituents 30 (87) 31 (94)
Other 3 (9) 6 (19)
Practices used for managing ants inside buildings:†
Insecticidal spray from aerosol can (2002 wording changed
slightly)‡ 32 (127) 17 (59) Insecticides sprayed using other application method 21 (81) 25 (86)
Ant baits 37 (146) 59 (202) *
Soapy water spray 14 (53) 38 (129) *
Caulk in cracks 19 (75) 36 (123) *
Improved sanitation (question added in 2002)‡ n.a. 64 (218)
Other 13 (52) 22(76) *
Decision to treat for weeds:§
At regular time intervals 29 (104) 35 (123)
When weeds are first noticed 28 (98) 23 (81)
When weed abundance exceeds pre-established thresholds 34 (121) 30 (105)
After certain number of complaints by constituents 4 (13) 2 (7)
Other 6 (21) 10 (36)
Practices used for managing weeds:§
Regular broadcast treatments of turf/landscaping
with herbicides 27 (107) 23 (84) Regular spot treatment of turf/landscaping with herbicides 62 (246) 62 (231)
Use of mulches 23 (91) 26 (96)
Physical controls (hand-pulling, cultivating, mowing) 56 (219) 69 (257) *
Flaming 7 (29) 8 (28)
Irrigation management (question added in 2002)‡ n.a. 17 (63)
Other 9 (34) 10 (36)
* Asterisks denote significant differences (2-tailed, Z-scores, P ≤ 5%). † Percentages of total number of respondents who treat for ants.
[image:6.612.64.398.345.709.2]Fig. 4. Satisfaction (rated as “good,” “fair” and “poor”) with factors considered important to the success of IPM programs, compared between California school districts with and without IPM programs (self-reported). Respondents were asked to rate their satisfaction over the previous year. Significant differences (P < 0.05, logistic regression) are shown by asterisks (*).
less-hazardous pest-management prac-tices, in accordance with the goals of the Health Schools Act. For example, surveyed school districts kept bet-ter records in 2002 than in 2001. The percentage of districts recording pest sightings, pest monitoring data and pest control treatments all increased (table 3). Since good record-keeping is a core tenet of IPM, this appears to be a positive trend.
Comparing the 2001 and 2002 surveys also suggests a movement toward reduced-risk methods for managing ants. The use of baits, soapy water sprays and caulking in cracks to prevent entry all increased significantly between 2001 and 2002 (table 3). However, insecticidal spray use during the 2 years could not be compared directly, due to refinements in question wording. Schools’ ap-proaches to deciding when ant treat-ments are necessary did not change significantly between years.
The trends in weed management were more mixed. On the negative side, the IPM-contrary practice of treat-ing weeds at regular intervals rose in 2002, while the generally desirable practices of treating “when weeds are first noticed” or “when the abundance of weeds exceeds pre-established thresholds” both declined somewhat. On the positive side, the percentage of districts using physical controls (such as hand-pulling, cultivating and mowing)
increased significantly, and the percent-age using mulches grew slightly. Also, the percentage of respondents using the IPM-contrary practice of broadcasting herbicides on a regular schedule de-clined slightly.
In summary, California’s public schools appear to be making some prog-ress toward an IPM approach in their ant management, monitoring and record-keeping practices, although Healthy Schools Act record-keeping requirements remain a challenge for many districts. The survey’s picture of weed manage-ment practices is less clear; improving weed IPM and avoiding calendar treat-ment schedules may require additional attention. Increased training in methods such as weed flaming, and wider use of weed barrier technologies such as cloth or mulches, could improve some schools’ weed management success, as could the trend toward artificial turf in athletic fields.Generally speaking, larger, urban schools seem to be performing better than smaller, rural schools; this could be function of inadequate training or merely a lack of resources in small districts. These surveys will be invaluable in mon-itoring progress of school IPM programs in future years.
C.A. Geiger is Integrated Pest Program Manager, San Francisco Department of the Environment, San Francisco, and formerly
Associate Environmental Research Scien-tist, California Department of Pesticide Regulation, Sacramento; and D.H. Toote-lian is Professor of Marketing, College of Business Administration, California State University, Sacramento.
References
Bajwa WI, Kogan M. 1998. Compendium of IPM Definitions. www.ippc.orst.edu/IPM -definitions/defineIII.html#90’s.
Benbrook CM. 1996. Pest Management at the Crossroads. Yonkers, NY: Consumers Union.
[CDE] California Department of Education Public Schools Database. 2002. www.cde. ca.gov/ds/si/ds/fspubschls.asp.
[DPR] California Department of Pesti -cide Regulation. 2001. 2001 Integrated Pest Management Survey of California Schools. Sacramento, CA. www.schoolipm.info/over -view/24_Survey2001.pdf.
Geiger C, Tootelian D. 2002. 2002 Inte -grated Pest Management Survey of Cali -fornia Schools. Cali-fornia Department of Pesticide Regulation, Sacramento, CA. www. schoolipm.info/overview/24_Survey2002.pdf.
[HSA] Healthy Schools Act. 2000. 2000 California Education Code Part 10.5, Chapter 5, Article 4 (commencing with Section 17608) and Section 48980.3; and Food and Agricul -tural Code, Division 7, Chapter 2, Article 17 (commencing with Section 13180).
Huffaker CB, Messenger PS. 1976. Theory and Practice of Biological Control. New York: Academic Pr.
Stern VM, Smith RF, van den Bosch R, Hagen KS. 1959. The integrated control con -cept. Hilgardia 29(2):81–101.
[UC IPM] UC Statewide Integrated Pest Management Program. 2001. Pest Notes. Weed Management in Landscapes: Inte -grated Pest Management for Landscape Professionals and Home Gardeners. UC ANR Pub 7441. 6 p.
California schools are making progress in adopting less-hazardous pest management strategies. Above, effective methods are avail-able to control wasps, which pose a serious hazard to students allergic to their venom.