Performance of Classification Analysis: A Comparative
Study between PLS-DA and Integrating PCA+LDA
Nurazlina Abdul Rashid*, Wan Siti Esah Che Hussain, Abd Razak Ahmad, Fatihah Norazami Abdullah
Faculty of Computer and Mathematical Sciences, Universiti Teknologi MARA, Malaysia
Received July 1, 2019; Revised September 6, 2019; Accepted September 21, 2019
Copyright©2019 by authors, all rights reserved. Authors agree that this article remains permanently open access under the terms of the Creative Commons Attribution License 4.0 International License
Abstract
Classification methods are fundamental techniques designed to find mathematical models that are able to recognize the membership of each object to its proper class on the basis of a set of measurements. The issue of classifying objects into groups when variables in an experiment are large will cause the misclassification problems. This study explores the approaches for tackling the classification problem of a large number of independent variables using parametric method namely PLS-DA and PCA+LDA. Data are generated using data simulator; Azure Machine Learning (AML) studio through custom R module. The performance analysis of the PLS-DA was conducted and compared with PCA+LDA model using different number of variables (p) and different sample sizes (n). The performance of PLS-DA and PCA+LDA has been evaluated based on minimum misclassification rate. The results demonstrated that PLS-DA performed better than the PCA+LDA for large sample size. PLS-DA can be considered to have a good and reliable technique to be used when dealing with large datasets for classification task.Keywords
Classification Analysis, Large Variable, PCA+LDA, Performance, PLS-DA1. Introduction
Classification method not only plays a role as a classifier but also acts as a predictive and descriptive model as well as discriminative variable selection. The purpose of classification is to achieve a minimum classification rate. Classification methods can be grouped into three; parametric, non-parametric and semi-parametric methods. According to [14] parametric methods are more reliable than non-parametric method as all the data must be normally distributed and exhibit a bell-shaped curve. Examples of parametric method used for classification
frequently are Quadratic Discriminant Analysis (QDA), Partial Least Square Discriminant Analysis (PLS-DA) and Linear Discriminant Analysis (LDA).
In contrast, the non-parametric method is a flexible method than parametric method because it is robust to the distribution of data [18]. For instance, k-Nearest Neighbour (KNN), decision trees (CART) and survival analysis [3] make no assumptions on data distribution. Meanwhile, semi-parametric method is a combination between parametric and non-parametric methods. According to [9] semi-parametric method achieved greater precision than nonparametric models but with weaker assumptions than parametric models. Semi-parametric estimators can possess better-operating characteristics in small sample sizes due to smaller variance than non-parametric estimators [20]. Logistic discriminant analysis is an example of semi-parametric method [12].
This study focuses on parametric methods only which are LDA and PLS-DA. This method was chosen because LDA works efficiently when the assumption of equal population covariance structures for groups are satisfied and the independent variables follow multivariate normal distribution [16]. Then, PLS-DA has demonstrated great success in modeling high-dimensional datasets for the past two decades [5, 17].
1.1. Classification Problems
have a significantly different from what is expected [1]. According to [4] variable selection and reduction is the best solution to reduce the problem of multicollinearity. No dimensionality reduction technique is universally better than others. Depending on the dataset characteristics, one method may provide a better approximation of a dataset than the other techniques.
1.2. Classification Techniques
Principal component analysis (PCA) is a variable reduction technique in orderto reduce a complex dataset to a lower-dimensional subspace. PCA helps to compress the data without much loss of information [6]. After conducting PCA, LDA model was constructed for classification purposes. LDA is a well-known scheme for dimension reduction and it is intended for classification problems where the output variable is categorical. Hence, it has been successfully used as a statistical tool of origin method in several classification problems [7]. According to [15], the weakness of this technique is that it cannot perform well when the dataset consists of a large number of variables relative to the amount of measurements taken.
For this study, we will use PCA to deal with a very large number of variables. Then, LDA model constructed for classification purpose for first model. The past studies showed that PCA and LDA were popular methods for variable reduction and classification. This study intends to integrate PCA and LDA for a large number of variables and perform classification task using the reduced set of variables resulting in PCA.
PLS-DA can be thought as a “supervised” version of Principal Component Analysis (PCA). Partial Least-Squares Discriminant Analysis (PLS-DA) is a multivariate dimensionality-reduction tool and classifier [17]. It is reported that PLS-DA can be effective both as a variable reduction and as well as a classifier for a large number of variables.
In addition, PLS-DA outperforms in modeling high-dimensional datasets for classification task.
Hence, the objective of this study is to make comparison between the performance of PCA+LDA and PLS-DA on variable reduction. PCA will be used to perform variable reduction and then integrate with LDA to construct classification task. The PLS-DA will be used in data reduction and perform classification task. The performance of PCA+LDA and PLS-DA for the various number of simulation dataset is accessed based on misclassification rates.
2. Materials and Methods
2.1. Data Generation
Data are generated using data simulator; Azure
Machine Learning (AML) studio through custom R module. Performance analysis is conducted using the different number of independent variables (p) and number of sample size (n). The number of independent variables considered for sample n = 30 are p = 10, p = 30, p = 50, p = 100, p = 200, then n = 100 are p = 10, p = 30, p = 50, p = 100, p = 200 and finally n = 150 are p = 10, p = 30, p = 50, p = 100, p = 200. In order to measure the performance of PLS-DA and PCA+LDA, fifteen datasets were simulated.
2.2. Computational of PCA
The PCA algorithm calculates the first principal component along the first eigenvector, by minimizing the projection error (i.e., by minimizing the average squared distance from each data to its projection on the principal component or maximizing the variance of the projected data). After that, the algorithm iteratively projects all the points to a subspace orthogonal to the last principal component and then repeats the process on the projected points, thus constructing an orthonormal basis of eigenvectors and principal components. An alternative formulation is that the principal component vectors are given by the eigenvectors of the non-singular portion of the covariance matrix C, given by:
(1) Where;
Cn is n*n centering matrix
(2)
2.2. Construction of LDA
The LDA model is constructed from a reduced set of variables resulting from the procedures of PCA using following steps:
Estimate means for (π1) and (π2) using
n y i
∑ = µ
based on reduced set of variables.
Compute homogeneous covariance matrix using
∑
− −
−
∑ =
1 ) 2 ( 1 1
n m y
y µ µ
Estimate prior probabilities for (π1) and (π2) byn n i
1
= ρ
Evaluate the performance of the constructed PCA +LDA model based on the lowest misclassification rate.
2.3. Construction of PCA+LDA
Suppose that, n1 is observed group from group 1 (π1) and n2 is observed from group 2 (π2). For classification purposes based on LDA, the object is classified to (π1) if otherwise it will be classified to (π2):
3)
2.3.1. Step to Integrate PCA+LDA
Firstly, perform PCA to reduce a very large number of measured variables. Then, estimates parameters; mean, covariance matrix and probability using the reduce set of variables. Hence, construct classification model based on LDA using the estimated parameters. Lastly, evaluate the performance of the constructed PCA+LDA model based on minimum misclassification rate.
(4) where, i= 1,2, … , n
2.4. Construction of PLS-DA
As with PCA, the principal components of PLS-DA are linear combinations of features, and the number of these components defines the dimension of the transformed space. In a standard variant of PLS-DA, the components are required to be orthogonal to each other (although this is not necessary). This is employed in the package mixOmics in R. Similar to Eq. (1), the principal components of PLS-DA can be formulated as the eigenvectors of the non-singular portion of the covariance matrix C, given by:
(5) The iterative process computes the transformation vectors (also, loading vectors) a1. . . ad, which give the importance of each feature in that component. In iteration h, PLS-DA has the following objective:
(6) where bn is the loading for the label vector yn, X1 = X, and
Xn and yn are the residual (error) matrices after transforming with the previous n − 1 components.
2.4.1. Step for Built PLS-DA Model
Perform the PLS-DA to create a pseudo linear Y value against which correlate with the samples. Specify the number of components, or latent variables (LVs), to use for our data. Then, plot the score between latent variables in order to look up the separation between sample groups. If the sample causes the problems, filter that sample. Construct PLS-DA model based on score and weight after filter. Evaluate the performance of the constructed PLS-DA model based on minimum misclassification rate.
3. Result and Analysis
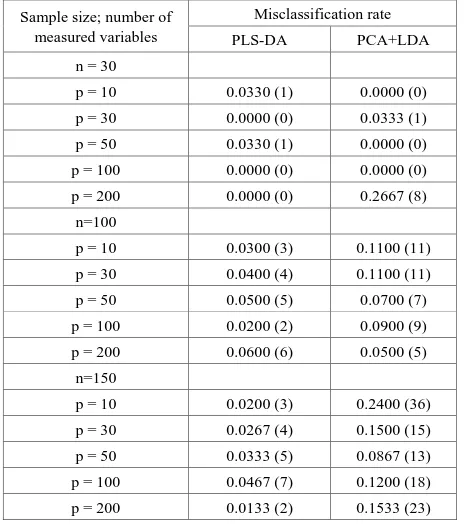
[image:3.595.60.290.207.325.2]The investigations based on different number of independent variables (p) and different sample sizes (n) are conducted to compare the performance of PLS-DA model with the integrated PCA+LDA based on their misclassification rate.
Table 1. Comparison and performance analysis of the PLS-DA and integrated PCA+LDA
Sample size; number of measured variables
Misclassification rate
PLS-DA PCA+LDA
n = 30
p = 10 0.0330 (1) 0.0000 (0)
p = 30 0.0000 (0) 0.0333 (1)
p = 50 0.0330 (1) 0.0000 (0)
p = 100 0.0000 (0) 0.0000 (0)
p = 200 0.0000 (0) 0.2667 (8)
n=100
p = 10 0.0300 (3) 0.1100 (11)
p = 30 0.0400 (4) 0.1100 (11)
p = 50 0.0500 (5) 0.0700 (7)
p = 100 0.0200 (2) 0.0900 (9)
p = 200 0.0600 (6) 0.0500 (5)
n=150
p = 10 0.0200 (3) 0.2400 (36)
p = 30 0.0267 (4) 0.1500 (15)
p = 50 0.0333 (5) 0.0867 (13)
p = 100 0.0467 (7) 0.1200 (18)
p = 200 0.0133 (2) 0.1533 (23)
Note: Value in parentheses indicate the number of misclassification object
[image:3.595.306.538.374.636.2]gives perfect misclassification rate while PCA+LDA provides much greater misclassification rate with 26.67%.
For larger sample size (n = 100), the performance of PLS-DA is improved significantly than PCA+LDA for all cases except case of p = 200 where there is 1% difference misclassification rate between PLS-DA and PCA+LDA.
Finally, for large sample size (n = 150), the performance of PLS-DA is greatly improved than PCA+LDA for all cases. The results indicate small misclassification rate under PLS-DA compared to PCA+LDA. In particular, when p = 10, PLS-DA obtains 2.0% misclassification rate while PCA+LDA shows much higher misclassification rate of 24.0%. In other words, PLS-DA has misclassified only 3 out of 150 objects while PCA+LDA misclassified 36 objects for the same condition. These results demonstrated that PLS-DA plays an important role in dealing with a large number of variables. However, there is no significant difference between PLS-DA and PCA+LDA performance for smaller sample size. The discussion of the results based on the relationship between sample size and independent variables can be summarized as follows:
For smaller sample size (n = 30). When p gets larger generally misclassification rate of PLS-DA gets smaller. In fact, PLS-DA performs better than PCA+LDA model, for larger p.
For sample size, (n = 100).PLS-DA performed better than PCA+LDA. In almost all cases, the misclassification rate of PLSDA are less than 6.0% compared to PCA+LDA > 7.0%.
For large sample (n=150), the performance of PLS-DA is consistent and better than PCA+LDA in all cases. Hence, produce better model.
Regardless of the fact that sample size of the performance of PLS-DA is always better than PCA+LDA especially when number of variables (p) is equal to number of sample size (n).
PLS-DA model show better performance for large sample size in most cases.
This finding is consistent with the result of [17], where PLS-DA outperformed PCA+LDA when dealing with large sample size
4. Conclusions and Future Work
As the sample size gets larger, the misclassification rate becomes smaller for the PLS-DA. On the other hand, PCA+LDA are inconsistent. In conclusion, the entire results revealed that PLS-DA highly recommend for a large sample size than PCA+LDA in dimension reduction and classification. PLS-DA can be considered to have a good and reliable technique to be used when dealing with large datasets for classification task. The future work might include the real dataset to make comparison between the performance of PCA+LDA and PLS-DA on large variable dataset.
Acknowledgement
The research would like to thank Research and Industrial Linkage Division UiTM Kedah for financial support to publish this paper.
Appendix
str(data1)
X <- (data2[,3:203])
Y <- as.factor(data2$Status)
## if training is perfomed on 4/5th of the original data
samp <- sample(1:2, nrow(X), replace = TRUE)
test <- which(samp == 1) # testing on the first fold
train <- setdiff(1:nrow(X), test)
plsda.train <- plsda(X[train, ], Y[tra VCin], ncomp = 2)
test.predict <- predict(plsda.train, X[test, ], dist =
"max.dist")
Prediction <- test.predict$class$max.dist[, 2]
cbind(Y = as.character(Y[test]), Prediction)
LDA
tr <- sample(1:50, 25)
train <- rbind(iris3[tr,,1], iris3[tr,,2], iris3[tr,,3])
test <- rbind(iris3[-tr,,1], iris3[-tr,,2], iris3[-tr,,3])
cl <- factor(c(rep("s",25), rep("c",25), rep("v",25)))
z <- lda(train, cl)
predict(z, test)$class
PCA+LDA
Running PCA using covariance matrix:
wdbc.pcov <- princomp(wdbc.data, scores = TRUE)
summary(wdbc.pcov)
Running PCA using correlation matrix:
wdbc.pr <- prcomp(wdbc.data, scale = TRUE, center =
TRUE)
summary(wdbc.pr)
LDA from six PCA extract 6pca
wdbc.pcs <- wdbc.pr$x[,1:6]
wdbc.pcst <- cbind(wdbc.pcs, diagnosis)
> Y <- as.factor(data2$dataLabel)
> X <- (data2[,2:102])
> samp <- sample(1:2, nrow(X), replace = TRUE)
> test <- which(samp == 1) # testing on the first fold
> train <- setdiff(1:nrow(X), test)
> pca.train <-pca(X[train,],2,TRUE)
REFERENCES
Adeboye, N. O., Fagoyinbo, I. S., & Olatayo, T. O. (2014). [1]
Estimation of the effect of multicollinearity on the standard error for regression coefficients. IOSR Journal of Mathematics, 10(4), 16-20.
Breiman, L. (2017). Classification and regression trees. [2]
Routledge.
Cole, S. R., & Hudgens, M. G. (2010). Survival analysis in [3]
infectious disease research: describing events in time. AIDS (London, England), 24(16), 2423.
Ghosh, J., & Ghattas, A. E. (2015). Bayesian variable [4]
selection under collinearity. The American Statistician, 69(3), 165-173.
Gromski, P. S., Muhamadali, H., Ellis, D. I., Xu, Y., Correa, [5]
E., Turner, M. L., & Goodacre, R. (2015). A tutorial review: Metabolomics and partial least squares-discriminant analysis–a marriage of convenience or a shotgun wedding. Analytica chimica acta, 879, 10-23.
He, Y., Feng, S., Deng, X., & Li, X. (2006). Study on [6]
lossless discrimination of varieties of yogurt using the Visible/NIR-spectroscopy. Food Research International, 39(6), 645-650.
Keogh, E., & Mueen, A. (2011). Curse of dimensionality. In [7]
Encyclopedia of machine learning (pp. 257-258). Springer, Boston, MA.
Kim-Anh Le Cao, Florian Rohart, Ignacio Gonzalez, [8]
Sebastien Dejean, Benoit Gautier, and Francois Bartolo. mixOmics: Omics data integration project. R package, version, 2017
Kim, G., Silvapulle, M. J., & Silvapulle, P. (2007). [9]
Comparison of semiparametric and parametric methods for estimating copulas. Computational Statistics & Data Analysis, 51(6), 2836-2850.
Loong Chuen Lee, Choong-Yeun Liong and Abdul Aziz [10]
Jemain (2018) Partial least squares-discriminant analysis (PLS-DA) for classification of high-dimensional (HD) data: a review of contemporary practice strategies and knowledge gaps. Analyst, 2018,143, 3526-3539
Mario Fordellone, Andrea Bellincontro, and Fabio [11]
Mencarelli,(2018), Partial least squares discriminant analysis: A dimensionality reduction method to classify hyperspectral data, arXiv.org > stat > arXiv:1806.09347v1.
Maroco, J., Silva, D., Rodrigues, A., Guerreiro, M., Santana, [12]
I., & de Mendonça, A. (2011). Data mining methods in the prediction of Dementia: A real-data comparison of the accuracy, sensitivity and specificity of linear discriminant analysis, logistic regression, neural networks, support vector machines, classification trees and random forests. BMC research notes, 4(1), 299.
Moncayo, S., Manzoor, S., Navarro-Villoslada, F., & [13]
Caceres, J. O. (2015). Evaluation of supervised chemometric methods for sample classification by Laser Induced Breakdown Spectroscopy. Chemometrics and Intelligent Laboratory Systems, 146, 354-364.
Neideen, T., & Brasel, K. (2007). Understanding statistical [14]
tests. Journal of surgical education, 64(2), 93-96.
N.A. Rashid, A. H. A.Rahim, I.-N. M. Nasir. S.hussin. A.-R. [15]
Ahmad. (2017) Classifying Bankruptcy of Small and Medium Sized Enterprises with Partial Least Square Discriminant Analysis. Proceedings of the International Conference on Computing, Mathematics and Statistics (ICMS), 315-323.
Okwonu, F. Z., & Othman, A. R. (2012). A model [16]
classification technique for linear discriminant analysis for two groups. International Journal of Computer Science Issues (IJCSI), 9(3), 125.
Perez, D. R., & Narasimhan, G. (2017). So you think you can [17]
PLS-DA. bioRxiv, 207225.
Reimann, C., Filzmoser, P., Garrett, R. G., & Dutter, R. [18]
(2008). Statistical data analysis explained: applied environmental statistics with R (No. Sirsi) i978047098581 6). Chichester: Wiley.
Szymańska, E., Gerretzen, J., Engel, J., Geurts, B., Blanchet, [19]
L., & Buydens, L. M. (2015). Chemometrics and qualitative analysis have a vibrant relationship. TrAC Trends in Analytical Chemistry, 69, 34-51.
Wey, A., Connett, J., & Rudser, K. (2015). Combining [20]