P a s siv e a c o u s ti c t h e r m o m e t r y
Ellio t t , AS
T i t l e
P a s siv e a c o u s ti c t h e r m o m e t r y
A u t h o r s
Ellio t t, AS
Typ e
C o nf e r e n c e o r Wo r k s h o p I t e m
U RL
T hi s v e r si o n is a v ail a bl e a t :
h t t p :// u sir. s alfo r d . a c . u k /i d/ e p ri n t/ 4 0 0 1 8 /
P u b l i s h e d D a t e
2 0 1 6
U S IR is a d i gi t al c oll e c ti o n of t h e r e s e a r c h o u t p u t of t h e U n iv e r si ty of S alfo r d .
W h e r e c o p y ri g h t p e r m i t s , f ull t e x t m a t e r i al h el d i n t h e r e p o si t o r y is m a d e
f r e ely a v ail a bl e o nli n e a n d c a n b e r e a d , d o w nl o a d e d a n d c o pi e d fo r n o
n-c o m m e r n-ci al p r iv a t e s t u d y o r r e s e a r n-c h p u r p o s e s . Pl e a s e n-c h e n-c k t h e m a n u s n-c ri p t
fo r a n y f u r t h e r c o p y ri g h t r e s t r i c ti o n s .
Passive Acoustic Thermometry
Andrew Elliott1
1 University of Salford, United Kingdom
ABSTRACT
Conventional acoustic thermometry is usually performed by exciting a resonator with a sound source and identifying the resonant frequencies of the system. If the dimensions of such system are known it is relatively straightforward then to determine the speed of sound and from that the temperature. Alternatively a sound source and receiver separated by a short distance can be used to determine the speed of sound, and hence temperature, by measuring the time delay between source and receiver but neither approach is widely used in practise. Described in this paper is an alternative approach to acoustic thermometry which we refer to as “Passive Acoustic Thermometry” (PAT) because it does not require a dedicated sound source. Instead, background or ambient noise is used to excite a resonator containing a microphone and an additional microphone outside the resonator replaces the sound source. It is demonstrated in the paper how the frequency response function between the two microphones can be used to determine the resonant frequencies of the system and how this data can be used to determine air temperature. In principal the same device could also be used to measure relative humidity and this, together with some potential applications is discussed. Keywords: Thermometry, Humidity, Sensors, Microphones, Sensor Networks, Sound, Acoustics, soundscapes, internet of things, sound mapping.
1. INTRODUCTION
Acoustic thermometry is widely regarded as being one of the most ideal methods of temperature measurement but it is rarely used in practice. In some respects this is surprising because the implementation of acoustic thermometry is relatively straightforward and the associated costs are low especially now with the proliferation of mobile equipment such as smart phones ; devices which are more than capable of performing the required computations.
Described in this paper is a low cost acoustic thermometer which consists of a pipe and two microphones connected to a computer. Similar to other devices of this type it functions by identifying the speed of sound which is inferred from the resonant frequencies of an enclosure with known dimensions. The enclosure could be a pipe, a room or a more complex assembly but here we look just at a “stopped pipe” or “quarter wavelength resonator” as an example.
The device proposed here differs from conventional acoustic thermometers because it has no requirement for a dedicated sound source and instead uses already existing ambient noise to drive the resonator. This simplifies the implementation and makes the device silent.
Although it has not been fully investigated, in principal, it should also be possible to use the device to determine the relative humidity of air because the Q-factor of a resonator is known to vary with humidity. Thus, using the resonant frequencies of the system the temperature can be determined and from the strength of the resonances the humidity.
It is also worth noting that the vast majority of devices for the measurement of temperature provide a point measurement and whilst the chosen device may give high accuracy, e.g. 0.01℃ for an RTD, in many applications this level of accuracy is somewhat meaningless; for example, if the temperature of a room is required and there is 5℃ of variation throughout. In such cases a lower accuracy is acceptable if the average temperature of the medium can be determined with a single sensor or system. Described in the paper is a simple passive acoustic thermometer (PAT) and the basic theory of its operation. In addition to this technical challenges such as optimisation of the device and the
possibility of also measuring humidity are briefly discussed together with some potential applications.
1
2. BACKGROUND
2.1 Thermometry
There are a number of different ways of measuring and expressing temperature including thermocouples, thermistors, mercury in glass and infrared thermometers for the former and Celsius or Kelvin for the latter. For humid air the dry bulb, wet bulb and dew point temperatures are also of importance since a temperature measurement can be significantly affected by air humidity (1).
A full description of these concepts and their implications are beyond the scope of this paper but it is useful to bear in mind that thermometry encompasses much more than just obtaining a temperature reading from a given instrument.
A common distinction used to categorise thermometers is whether they are primary or secondary in nature, i.e. whether they directly measure a property of a medium from which the temperature can be directly inferred based on a full understanding of its physics (primary) or when that is not the case and a calibration against a primary thermometer is required (secondary). In practice the choice of thermometer is almost always one of the secondary types except in special circumstances.
Acoustic thermometers are generally of the primary type because they use an ideal gas as the working medium for which the physics are well understood. The passive acoustic thermometer however would most likely be considered a secondary type device because the working fluid is humid air which does not behave as an ideal gas.
2.2 Theory
The passive acoustic thermometer functions by identifying the resonant frequencies of a system of known dimensions. In air the speed of sound is strongly related to temperature, weakly related to pressure and is slightly sensitive to humidity (+/- one or two degrees at most for ambient temperatures). As a first approximation the speed of sound in dry air can be related to temperature by the empirical formula,
𝑐 = 331.3 × √1 + 𝑇
273.15 (1)
where T is the temperature in ℃.
Assuming this relationship is valid the only requirement is then to relate the resonant frequency of the system to the speed of sound in air, cair, which for a quarter wavelength resonator is known to be,
𝑓 = 𝑛𝑐𝑎𝑖𝑟
4(𝐿 + 0.4𝑑) (2)
where n is the harmonic order, L is the length of the resonator and d is its diameter. To a first approximation equations (1) and (2) provide all the information required to determine the temperature of the working fluid, air, using a passive acoustic thermometer.
3. PROTOTYPE DEVICE
As mentioned previously the passive acoustic thermometer could take many forms but here, to serve as an example, a quarter wavelength resonator is used, see figure 1. The device consists of a microphone at the stopped end of a tube and a further microphone at the pipe’s opening which is employed to record the ambient noise level. The external microphone is important to the device’s operation because, in practise, ambient noise may include tones which could be erroneously detected as being resonant frequencies of the system. Shown in figure 2 is the auto -spectrum of the internal microphone (P2) recorded in the laboratory space without any normalization for ambient noise (P1). Although some clear resonances of the resonator present themselves it would be challenging to determine the speed of sound or the temperature from this spectrum alone.
employed for this demonstration and even in a very low noise environment the resonant frequencies of the system could be identified. The result presented is for ambient noise in the laboratory.
Figure 1 – Passive acoustic thermometer consisting of two microphones and an aluminum tube. The internal microphone stops the pipe to detect its resonances and an external microphone is used to remove artifacts in
[image:4.595.76.511.291.703.2]the ambient noise spectrum.
Figure 2 – Top: Acoustic spectrum of the ambient noise in the laboratory (external microphone – P1), Bottom: Acoustic spectrum of the ambient noise in the laboratory modified by the quarter wavelength
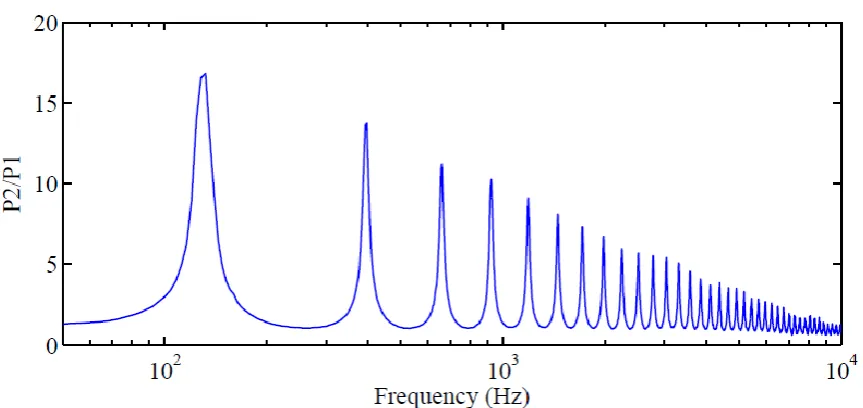
Figure 3 – Normalised frequency response P2/P1.
3.1 Temperature estimation
The above device was used to estimate the temperature of the laboratory in the locality of the passive acoustic thermometer using equations (1) and (2). For real world applications where greater accuracy is required greater detail in terms of the relation ships between the speed of sound, temperature and resonators could be employed. However, using this very basic analysis the speed of sound can be estimated reasonably well as is shown in figures 4 and 5.
Figure 4 – Frequency versus harmonic order using the data from figure 3.
[image:5.595.75.505.451.637.2]However each resonant frequency can alternatively be used to obtain individual estimates of the speed of sound and for illustration purposes this is what is plotted in figure 5.
For each sound speed estimate shown in figure 5 an estimate of the temperature was made using equation 2 and these are plotted in figure 6, again against harmonic order. The temperature measured in the laboratory beside the acoustic thermometer was found to be 23.8℃ and it varied by around +/-0.5℃ depending on the measurement position. As can be seen in figure 6, the estimated temperature varies from approximately 21 to 24℃ depending on which of the resonances is used. The frequency resolution of the fft analyser was set to 2 Hz ( 12800Hz frequency range and 6400 spectral lines) and, as mentioned previously, this affects the resolution and in turn the accuracy of the lower frequency resonance estimates. Increasing the frequency resolution then improves the situation but this also causes a degradation of the higher frequency resonances which are more susceptible to noise. Increasing the number of spectral lines also slows the response time of the device because the fft becomes longer and in turn so does the averaging time if the same number of averages is to be used. This could be overcome to some extent by carrying out the fft twice with different frequency resolutions but there are likely other more favourable approaches that could be employed.
[image:6.595.74.500.277.472.2]
Figure 5 – Sound speed estimates calculated from the systems resonant frequencies using equation (1).
Figure 6 – Estimate of temperature using the sound speeds from figure 5 and equation (2).
T
e
m
per
at
ure
[image:6.595.72.502.524.726.2]4. OPTIMISATION
Besides using a better model to relate sound speed to temperature and improving the signal processing as discussed in the previous section there is also scope to optimise the device for different applications by altering the dimensions of the resonator. Early prototypes of the PAT focused on miniaturization of the device which, although possible, does not in fact play to its strengths because there are already many small devices available (such as thermocouples and thermistors) which are extremely accurate. Actually, what is more lacking, are thermometers that give the average temperature of a medium and for this reason the development focus was shifted towards larger devices that could give an accurate bulk temperature measurement.
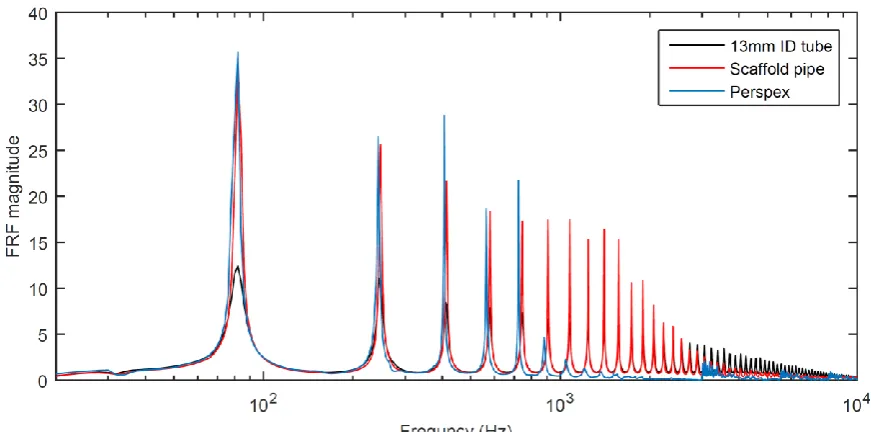
[image:7.595.98.534.270.486.2]One important consideration for the PAT, if a quarter wavelength resonator is to be employed, is the diameter of the tube because when the diameter is too low the response time of the sensor will be p oor. In this respect a large diameter pipe is therefore favourable but this can also be expected to limit somewhat the frequency range of operation, i.e. the number of resonances that can reliably be determined. This is quite clearly shown in figure 7 below where three different pipe diameters are compared.
Figure 7 – Frequency response magnitude for different quarter wavelength resonator pipe diameters. The three resonators compared in figure 7 were a 13mm ID aluminium tube, a scaffolding pole and a Perspex tube of approximately 20cm ID; black, red and blue lines respectively. It can be seen that although the low frequency resonances are much stronger for the higher dia meter pipes the number of resonant frequencies that can be easily identified is reduced. All three pipes were identical in length (approximately 1.2m) so the differences in the resonant frequencies of the resonators, particularly noticeable for the Perspex tube, is mainly attributable to the end correction effect although there may have been slight differences in the room temperature between the tests as they were not carried out simultaneously.
In practice the diameter of the pipe would most likely be selected on heat transfer considerations as the response time of the sensor is likely to be an overriding requirement and because, in principal, only the fundamental frequency is required. However it is clear that for this pipe length the scaffold tube appears the most favourable from a signal processing point of view because it provides easily identifiable resonances over a broad frequency range; i.e. the resonances are similar in strength to the perspex tube but there are more of them.
5. HUMIDITY
It has been demonstrated that the temperature of air can be determined using two microphones and a simple quarter wavelength resonator excited by ambient noise. Another potential use of this device is the measurement of relative humidity because it is well known that sound absorption by the atmosphere is highly dependent on humidity; an affect that is frequency dependent (2). For this reason every measured frequency response should in theory be unique because the resonant frequencies of the resonator will vary with temperature (and slightly with humidity) and the extent to which they are damped is primarily influenced by humidity. Thus, if calibrated properly, or if the physics was fully understood, it should be possible to determine both the temperature and the relative humidity of air using a passive acoustic thermometer.
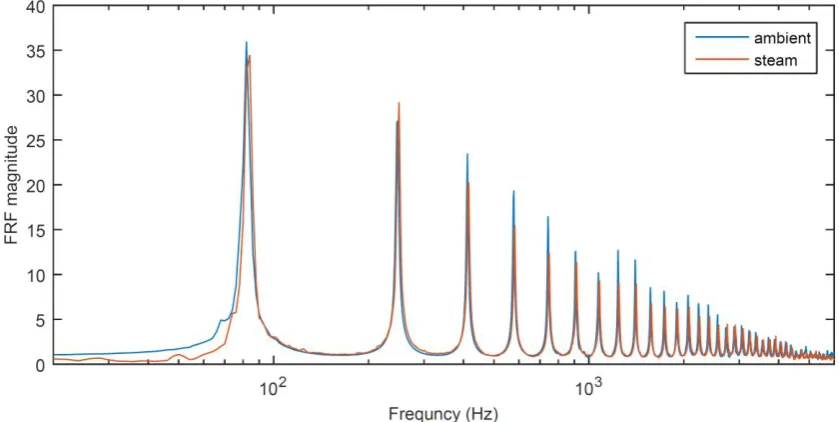
[image:8.595.96.516.296.507.2]In order to demonstrate this a simple test was conducted using the scaffold pole resonator discussed in the previous section. Unfortunately a chamber with accurately controllable humidity was not available for the test so, for demonstration purposes only, steam was allowed to enter the quarter wavelength resonator altering the humidity of the contained air but also in turn raising the temperature slightly. This test will be repeated in the future under better controlled conditions but it is nevertheless interesting to see the outcome which is shown in figure 8.
Figure 8 – Frequency response magnitude for weakly and highly humid air.
It can be seen in figure 8 that the temperature of the quarter wavelength resonator was increased slightly by the introduction of steam as would be expected and that the Q-factor of the resonances was also modified. However, based on this experiment alone it is difficult to draw any firm conclusions other than that the measurement of humidity with the device may be feasible. As mentioned above, the tests would have to be repeated to confirm this suspicion with any certainty because it is also possible that steam condensed on a microphone diaphragm thereby altering its sensitivity which could bring about a similar effect. The purpose of the above test was merely to see if there was a measureable difference but more so to serve as an illustration of the principal.
Interestingly one of the main advantages of acoustic thermometry is that, providing the dimensions of the resonator are stable, it is not possible for the temperature calibration to drift (which is a known issue for some temperature sensors). However, for the case of humidity measurement, this argument does not fully apply because the sensitivity of the microphones is of importance and unless there is some uniqueness in the relative heights of the resonant peaks a perfectly stable sensing mechanism would also be required. Alternatively, automatic calibration in-situ could be employed.
6. CONCLUDING REMARKS
An acoustic thermometer which uses a quarter wavelength resonator to measure temperature has been outlined and demonstrated. A key aspect of the device’s function is that ambient noise is used to excite the resonator avoiding the need for a dedicated sound source which in turn makes the device silent and suitable for use in very high noise environments. An important feature of the device is to use a microphone outside the resonator in addition to an internal microphone because this allows tonal features in the ambient noise spectrum to be normalised using, for example, the H3 frequency response function. The device is referred to as a “passive acoustic thermometer” or “PAT” because it requires no dedicated sound source.
Early prototypes of the device concentrated on miniaturisation but it was found that this did not play to the strengths of the technology. This is mainly because implementation is more challenging at smaller scales but also because there are already many very accurate devices that perform this role adequately. Instead the focus was shifted to devices that give a bulk temperature measu rement around the scale of 1m but much greater lengths or even volumes appear feasible.
The main advantage of the technology when compared to other temperature sensing techniques is that the calibration of the sensor should never drift providing its dimensions are stable. Other notable features are that the device may be less sensitive to radiant heat than other technologies and in principal it appears feasible that the device may also be able to serve as a humidity sensor. If this were proven to be the case the device could also serve as a dew point sensor whilst also bringing it closer to being a sensor of the primary type. In practice though it is thought that the most likely applications for the technology are those where a bulk temperature measurement is needed.
The vast majority of devices available for the measurement of temperature provide a point temperature measurement whereas the PAT gives a bulk temperature measurement based on the average speed of sound within a medium. This may be advantageous in certain applications where the exact temperature at a point is inconsequential; for example in rooms and in some industrial processes. Interestingly, in principal, the method could be similarly employed to determine gas composition but this has not, as yet, been explored.
Future research on the device will focus on reducing the cost of implem entation and exploring the possibility of using the device to accurately measure the relative humidity of air. Low cost devices have already been assembled using off the shelf electronic components which demonstrate that a PAT can be plugged directly into a regular PC’s soundcard, or potentially a smartphone, providing there is sufficient ambient noise. Improving the sensitivity of these systems and interfacing the technology with different computer soundcards and/or mobile devices will therefore also form an important part of any future investigation.
ACKNOWLEDGEMENTS
This work was funded by the University of Salford’s R&I Technology Transfer Office
REFERENCES
1. McGee, Thomas Donald. Principles and methods of temperature measurement. John Wiley & Sons, 1988.