© 2009, INSInet Publication
Corresponding Author:Ali Akbar Moayedi, Institute of Biological Sciences, University of Malaya, 50603, Kuala Lumpur, Malaysia
E-mail: moayediali@yahoo.com
Study on Osmotic Stress Tolerance in Promising Durum Wheat Genotypes
Using Drought Stress Indices
Ali Akbar Moayedi, Amru Nasrulhaq Boyce, Syed Shahar Barakbah
Institute of Biological Sciences, University of Malaya, 50603, Kuala Lumpur, M alaysia
Abstract: One way to overcome the negative effects of water stress on crop production is the
development of drought tolerant cultivars. In the present study we have attempted to quantify the drought tolerance of several durum wheat genotypes using stress indices. The study was laid out in factorial experiments based on a completely randomized design (CRD) with three replications and two factors. T wenty promising durum wheat genotypes were germinated under four (0.0, -0.3, -0.6 3 and -0.9 M Pa) osmotic stresses conditions produced using different concentrations of Polyethylene glycol (PEG 6000) at 20 <C. T he results showed that the effect of osmotic stress on the germination stress index (GSI) was highly significant (P < 0.01) and increasing osmotic stress significantly decreased the GSI values. In terms of the germination stress tolerance index (GSTI), a comparison of the different genotype responses to osmotic stress based on root length, root dry weight and seedling dry weight, showed that genotype number 4 (RASCON_39/TILO_1) was most tolerant under low osmotic stress (-0.3M Pa) while G 10 (RASCON_37/BEJAH_7) exhibited the highest GSTI under severe osmotic stress (-0.9 M Pa) conditions. On the other hand genotypes G17 (GARAV ITO_3/RASCON_37//GREEN_8) and G7 (HAI-OU_17/GREEN_38) showed the lowest GSTI under osmotic stress conditions. These results indicate that genotypes number 10 and 4 may be suitable for planting in arid and semi-arid areas that are subjected to severe or mild drought stresses.
Key words: Germination, seedlings, osmotic stress, durum wheat, drought tolerance
INTRODUCTION
One of the important challenges facing crop physiologists and agronomists is understanding and overcoming the major abiotic stresses in agriculture which reduces crop productivity and yield. One of these, particularly predominant in arid and semi-arid regions is drought stress, which brings about a decrease in plant growth and development and as a result crop yield. Begg & Turner [4 ] and Ashraf et. al. [3 ] have suggested that development of drought tolerant varieties can be a useful approach to increase crop production and yield under water stress conditions. As such the release of drought tolerance genotypes, including desirable traits associated with water limitation has become an established applied method for developing cultivars under dry conditions, Izanloo et. al.[1 2 ].
Varietals and genotype differences in drought tolerance have been reported previously in wheat and several other crops, Kulshrestha and Jain [1 4 ], Steiner et. al.[2 2 ]. Recently the results of Radhouane [1 8 ] showed that genotypes with longer root length under water stress conditions are able to access deeper water in the
soil. He suggested that the increase in root length was an adaptive response. Several researchers have reported the relationships between water stress with drought tolerance using drought indices in different cereals such as durum wheat, Fernandez , Arzani[8 ] [2 ], G olabadi et. al.[1 0 , 1 1], bread wheat, Ghodsi and triticale, Nazeri[9 ]
.
[1 6 ]
The objective if this study is to identify drought tolerant genotypes under different levels of osmotic stress conditions using drought stress indices. In addition to this the germination sensitivity thresholds of the promising durum wheat genotypes were also determined. As seed germination is considered to be the most critical growth stage especially, under water stress conditions for the successful stand establishment of crop plants it was used and determined in this study.
M ATERIALS AND M ETHO DS
(CRD) with three replications and two factors. The first factor studied was osmotic stress at four levels, i.e. 0.0 M Pa (D1, distilled water, control), -0.3M Pa (D2), -0.6 M Pa (D3) and -0.9 M Pa (D4). The second factor was the promising durum wheat genotypes. The seeds (Table 1) of the various durum wheat genotypes were obtained from the elite durum yield trial (EDYT) of 2006-2007, carried out in the Seed and Plant Improvement Institute, Iran.
Osmotic potentials (-0.3, -0.6, and -0.9 M Pa) were produced using different concentrations of polyethylene glycol 6000 (PE G ) at 20 <C according to the method of M ichel and K aufmann[1 5 ]. T he seeds were germinated using the paper method, in 9 cm diameter Petri dishes on the top of filter papers. Twenty healthy and equal-sized seeds of each genotype were selected and then sterilized with 5% sodium hypochlorite solution for three seconds before the seeds were put in covered sterilized Petri dishes containing germination paper moistened with 8 ml of the different solutions of PEG-6000. The Petri dishes were kept in an incubator for 8 days at 20 ± 0.5 <C (Rehman et. al. [2 1 ] and Ghodsi . Data were recorded daily for 8 days. For[9 ]
germination purposes, only those seeds that presented approximately 2mm of root length were considered to have germinated and were used for germination percentage and rate calculations, Sapra et. al. [2 1 ] and Afzal et. al. . The numbers of seeds germinated were[1 ]
counted daily and the germination percentage and rate were estimated. M ean germination time (M GT) was calculated to assess the germination rate (GR) according to results of Ellis and Roberts and Sapra[7 ]
et. al.[2 1 ]. At the end of eighth day, 5 seedlings were randomly selected and the coleoptiles root, shoot and also seedling length measured. Additionally, root, shoot and seedling dry weight were measured after drying samples at 76 <C for 48 hours in an oven. As according to the Bouslama and Schapaugh [5 ] formula, the germination stress index (GSI) was calculated as follows:
GSI = (PISS / PICS) ×100
In this formula, PISS is the promptness index of stressed seed while the PICS is the promptness index of control seed. The promptness index (PI) was calculated as:
PI = nd2 (1.00) + nd4 (0.80) + nd6 (0.60) + nd8 (0.40)
W here, nd2, nd4, nd6 and nd8 are germination percentages on the second, fourth, sixth and eighth day, consecutively. Stress tolerance index (ST I) was calculated during the germination stage using the
[8 ]
Ÿ p
GSTI = (Yp ×Ys) / ( 2)
In this formula, yield potential (Yp) and yield stress (Ys) shows the value of each genotype under
Ÿ 2
normal and the stress conditions. p is the mean square of the considerate trait for all genotypes under normal and stress conditions. The data were statistically analyzed by M ST AT -C software package and comparative analyses of the means were performed by Duncan's M ultiple Range Test (P < 0.05 and P < 0.01).
RESULTS AND DISCUSSIO N
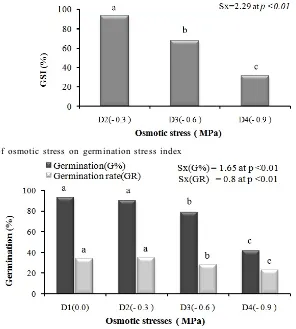
Germination Stress Index (GSI): The germination
stress index (GSI) shows the germination rate under osmotic stress to normal conditions ratio. The results indicated that with increasing osmotic stress, the germination stress index (GSI) gradually decreased from the D 2 to D4 treatments. Thus the reduction of the GSI value from 92.97 in the D2 treatment to 31.41 in the D4 treatment was related to a similar decrease in germination percentage and rate, under the osmotic stress conditions (Figs.1 and 2). It has been suggested that the germination stress index also indicates the sensitivity threshold of the cultivars and genotypes to drought stress during the germination stage Nazeri [1 6 ]
and G hodsi, . The results of the germination[9 ]
percentage and rate showed that there were no significant difference between the D1 (distilled water) and the D2 (-0.3M Pa) treatments. W hile, with increasing osmotic stress the germination percentage, germination rate and germination stress index significantly decreased in the D3 and D4 treatments (Figs.1 and 2). From this we can conclude that the -0.6 M Pa treatment (D3) can be the germination sensitivity threshold in these durum wheat genotypes studied. Similarly Nazeri [ 16 ] and Ghodsi [9 ] in separate experiments, reported that -0.6 M Pa and -0.9 M Pa osmotic stress levels are the germination sensitivity threshold for triticale and bread wheat cultivars, respectively.
Germination Stress Tolerance Index (GSTI): The
stress tolerance index, at the germination stage, has also been used to investigate drought stress tolerance in durum and bread wheat genotypes, Fernandez .[8 ]
W ith regard to this, Dhanda et. al. and Nazeri [6 ] [1 6 ]
difference under osmotic stress conditions. In addition, the G6 and G10 genotypes had the highest GST I value based on all of the calculated traits under mild (-06M Pa) and severe (-0 .9M P a) osm otic stress conditions. However the highest GSTI value under lower stress conditions (-0.3M Pa) belonged to different genotypes (G4, G10 and G 16). M any researchers, such as Sapra [2 1 ], Khan et. al. , [1 3 ] Nazeri , [1 6 ] Dhanda et. al. , Ghodsi , Okçu et. al. , Rauf et. al. , Yamur
[6 ] [9 ] [1 7 ] [1 9 ]
and Kaydan [2 3 ] have studied and reported the important and significant relationship between root and seedling dry weight with germination percentage, germination rate, root length, and shoot dry weight in response to the drought tolerance as is the case in the present study. The higher values observed in some of the genotypes (Table 2) can be related to the root to shoot length ratio, where the genotype G10 showed the highest root to shoot length ratio among all the genotypes under severe osmotic stress condition. It supports the results of Radhouane that genotypes[7 ]
exhibiting longer root length under water limitation show an adaptive reaction to increase water uptake ability by the seeds.
Conclusions: The overall results of the present study showed that with increasing osmotic stress, the germination stress index decreased significantly. Hence, the highest and lowest value for GSTI was observed in low 0.3M Pa) and severe osmotic stress treatments (-0.9 M Pa). W ith regard to germination rate and the germination stress index, treatment with -0.6 M Pa can be the germination sensitivity threshold in the durum and bread wheat genotypes studied. On the other hand, the comparison between the GSI and G STI values for selection of the tolerant genotypes revealed that the results obtained were considerably similar for both of the studied indices. For this purpose, the genotypes G4 ( R A S C O N _ 3 9 / T I L O _ 1 ) a n d G 1 0 (RASCON_37/BEJAH_7) were the most tolerant genotypes under low and severe osmotic stress. W h e r e a s g e n o t y p e s G 1 7 (GARAVIT O _3/RASCON _37//G REEN_8) and G7 (HAI-OU_17/GREEN_38) exhibited the lowest GSTI value under osmotic stress conditions.
Fig.1: The effect of osmotic stress on germination stress index
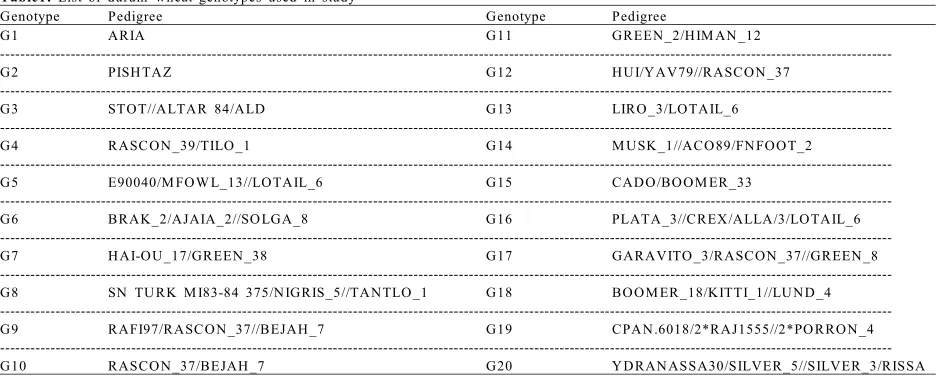
[image:3.612.151.447.357.686.2]T able1: List of durum wheat genotypes used in study
Genotype Pedigree Genotype Pedigree
G1 AR IA G11 GR EEN _2/H IM AN _12
---G2 PISH TA Z G12 H U I/Y AV79//R ASC O N _37
---G3 ST O T//ALTA R 84/ALD G13 LIR O _3/LO TA IL_6
---G4 R ASC O N _39/TILO _1 G14 M U SK _1//AC O 89/FN FO O T_2
---G5 E90040/M FO W L_13//LO TA IL_6 G15 C AD O /B O O M ER _33
---G6 B R AK_2/AJAIA_2//SO LGA_8 G16 PLATA_3//C R EX /ALLA/3/LO TA IL_6
---G7 H AI-O U _17/GR EEN _38 G17 GAR AVITO _3/R ASC O N _37//GR EEN _8
---G8 SN TU R K M I83-84 375/N IGR IS_5//TA N TLO _1 G18 B O O M ER _18/KITTI_1//LU N D _4
---G9 R AFI97/R ASC O N _37//B EJAH _7 G19 C PA N .6018/2*R AJ1555//2*PO R R O N _4
---G10 RASCO N _37/BEJAH _7 G20 Y D RAN ASSA30/SILVER_5//SILVER_3/RISSA
T able 2: R esponse of the durum wheat genotypes to germ ination stress tolerance index (GSTI) based on different germ ination traits
GSTI based on root dry w eight GSTI based on seedling dry w eight GSTI based on root length
Genotype --- --- ---D 2(-0.3) D 3(-0.6) D 4(-0.9) D 2(-0.3) D 3(-0.6) D 4(-0.9) D 2(-0.3) D 3(-0.6) D 4(-0.9)
M Pa M Pa M Pa M Pa M Pa M Pa M Pa M Pa M pa
G1 1.04 0.53 0.19 0.76 0.28 0.08 0.59 0.29 0.11
---G2 0.85 0.33 0.02 0.66 0.16 0.01 0.66 0.18 0.05
---G3 1.18 0.22 0.04 0.78 0.10 0.02 0.72 0.24 0.05
---G4 1.93 0.68 0.09 1.18 0.30 0.04 0.52 0.18 0.12
---G5 0.93 0.72 0.05 0.65 0.44 0.02 0.47 0.31 0.08
---G6 1.42 0.90 0.12 0.91 0.58 0.05 0.57 0.36 0.11
---G7 0.80 0.48 0.05 0.55 0.24 0.01 0.87 0.31 0.13
---G8 1.53 0.33 0.06 0.92 0.13 0.02 0.47 0.10 0.09
---G9 1.18 0.38 0.08 0.61 0.14 0.02 0.54 0.21 0.14
---G10 1.75 0.73 0.27 1.21 0.30 0.1 0.55 0.18 0.24
---G11 1.53 0.55 0.06 0.99 0.25 0.03 0.75 0.32 0.13
---G12 1.27 0.16 0.10 0.86 0.07 0.04 0.73 0.15 0.12
---G13 1.39 0.30 0.05 0.77 0.11 0.02 0.55 0.10 0.11
---G14 1.39 0.67 0.06 0.85 0.29 0.02 0.53 0.31 0.05
---G15 1.59 0.43 0.03 0.98 0.16 0.01 0.59 0.17 0.03
---G16 1.22 0.40 0.02 0.83 0.16 0.01 1.11 0.35 0.02
---G17 1.23 0.38 0.01 0.78 0.16 0.00 0.59 0.21 0.01
---G18 1.34 0.36 0.04 0.91 0.15 0.02 0.74 0.21 0.06
---G19 1.56 0.46 0.05 1.06 0.22 0.02 0.96 0.33 0.08
[image:4.612.72.544.101.294.2]
ACKNOW LEDGM ENTS
The authors wish to acknowledge University of M alaya for the Fellowship Scheme (IPSP330/99) awarded and also the Department of Cereal Research of the Seed and Plant Improvement Institute (SPII), Iran for providing genetic materials at Karadj. T he authors would also like to thank anonymous reviewers for their valuable comments and criticisms.
REFERENCES
1. Afzal, M ., S. Nasim and S. Ahmad, 2004. Operational manual seed preservation laboratory and gen bank .PGRI,NARC,Isb.
2. Arzani, A., 2002. Grain yield performance of durum wheat germplasm under Iranian dry land and irrigated field conditions. Sabaro Journal of Breeding and Genetics., 34: 9-18.
3. Ashraf, M ., H. B okhari. and S.N. Cristiti, 1992. Variation in osmotic adjustment of lentil (Lens culimaris M edic.) in response to drought. Acta Bot.Neerlandica., 41: 51-62.
4. Begg, J.E. and N.C. Turner, 1976. Crop water deficits. Adv Agron., 28:161.
5. Bouslama, M . and W .T. Schapaugh, 1984. Stress tolerance in soybeans. 1. Evaluation of three screening techniques for heat and drought tolerance. Crop Sci., 24: 933-937.
6. Dhanda, S., G.S. Sethi and R.K. Behl, 2004. Indices of drought tolerance in wheat genotypes at early stages of plant growth. J. Agronomy Crop Sci., 190: 6–12.
7. Ellis, R.H. and E.H. Roberts, 1980. Towards a rational basis for testing seed quality. In: Seed Production (ed: P.D. Hebblethwaite). Butterworths, London, pp: 605- 635.
8. Fernandez, G.C., 1992. Effective selection criteria for assessing plant stress tolerance. In the Proceedings of the International Symposium on Adaptation of Vegetable and other food crops in temperature and water stress. Taiwan. pp: 257-270.
9. Ghodsi, M ., 2004. Ecophysiological aspects of water deficit on growth and development of wheat cultivars, PhD thesis, University of Tehran. Iran. 10. G olabadi, M ., A . A rzani and S.M .M . M irmohammadi M aibody, 2005. Evaluation of variation among durum wheat F3 families for grain yield and its components under normal and water stress field conditions. Czech J. Genet. Plant Breed., 41: 263-267.
11. G olab ad i, M ., A. Arzani and S.M .M . M irmohammadi M aibody, 2006. Assessment of drought tolerance in segregating populations in
durum wheat. African Journal of Agricultural Research, 1: 162-171.
12. Izanloo, A., A.G. Condon., P. Langridge., M . Tester. and T . Schnurbusch, 2008. Different mechanisms of adaptation to cyclic water stress in two South Australian bread wheat cultivars. J Exp Bot., 59(12): 3327-3346.
13. Khan, M .Q., S. Anwar and M .I. Khan, 2002. Genetic variability for seedling traits in wheat under moisture stress condition. Asian J and Plant Sci., 1(5): 588-590.
14. Kulshrestha, V.P. and H.K. Jain, 1982. Eighty yea rs o f w he at b reeding in India: P ast selection pressures and future prospects. Z. Pflan zenzucht., 89: 19-30.
15. M ichel, B.E. and M .R. Kaufmann, 1973. The osmotic potential of polyethylene Glycol 6000 .plant physiology., 51: 914-916.
16. Nazeri, M ., 2005. Study on response of triticale genotypes at water limited conditions at different developmental stages, PhD thesis, University of Tehran, Iran.
17. Okçu, G., M.D. Kaya and M . Atak, 2005. Effects of salt and drought stresses on germination and seedling growth of pea (Pisum sativum L.) Turk. J. Agric. For., 29: 237-242.
18. Radhouane, L., 2007. Response of Tunisian autochthonous pearl millet (pennisetum glaucum (L.) R. Br.) to drought stress induced by polyethylene glycol (PEG) 6000. African journal of biotechnology., 6(9): 1102-1105.
19. Rauf, M ., M . M unir., M .U. Hassan, A. M unir and M . Afzal, 2007. Performance of wheat genotype under osmotic stress at germination and early seedling growth stage. African journal of biotechnology, 6 (8): 971-975.
20. Rehman, S., P.J.C. Harris., W .F. Bourne and J. W ilkin, 1996. The effects of sodium chloride on germinating and the potassium and calcium contents of Acacia seeds. Seed Science and Technology, 25: 45-57.
21. Sapra, V.T., E. Savage, A.O. Analele and C.A Beyle, 1999.Varietal differences of wheat and triticale to water stress. J.agron and Crop sci., 167: 23-28.
22. Steiner, J.J., R.B. Hutmacher., A.D. M antal., J.E. Ayars and S.S. Vail, 1990. Response of seed carrot to various water regimes. II. Reproductive development, seed yield and seed quality. J Am Sco Hort Sci., 115: 722-727.