comm
en
t
re
v
ie
w
s
re
ports
de
p
o
si
te
d r
e
se
a
rch
refer
e
e
d
re
sear
ch
interacti
o
ns
inf
o
rmation
Different evolutionary patterns between young duplicate genes in
the human genome
Peng Zhang, Zhenglong Gu and Wen-Hsiung Li
Address: Department of Ecology and Evolution, University of Chicago, East 57th Street, Chicago, IL 60637, USA.
Correspondence: Wen-Hsiung Li. E-mail: [email protected]
© 2003 Zhang et al.; licensee BioMed Central Ltd. This is an Open Access article: verbatim copying and redistribution of this article are permitted in all media for any purpose, provided this notice is preserved along with the article's original URL.
Different evolutionary patterns between young duplicate genes in the human genome
Following gene duplication, two duplicate genes may experience relaxed functional constraints or acquire different mutations, and may also diverge in function. Whether the two copies will evolve in different patterns remains unclear, however, because previous studies have reached conflicting conclusions. In order to resolve this issue, by providing a general picture, we studied 250 independent pairs of young duplicate genes from the whole human genome.
Abstract
Background: Following gene duplication, two duplicate genes may experience relaxed functional
constraints or acquire different mutations, and may also diverge in function. Whether the two copies will evolve in different patterns remains unclear, however, because previous studies have reached conflicting conclusions. In order to resolve this issue, by providing a general picture, we studied 250 independent pairs of young duplicate genes from the whole human genome.
Results: We showed that nearly 60% of the young duplicate gene pairs have evolved at the
amino-acid level at significantly different rates from each other. More than 25% of these gene pairs also showed significantly different ratios of nonsynonymous to synonymous rates (Ka/Ks ratios). Moreover, duplicate pairs with different rates of amino-acid substitution also tend to differ in the Ka/Ks ratio, with the fast-evolving copy tending to have a slightly higher Ks than the slow-evolving one. Lastly, a substantial portion of fast-evolving copies have accumulated amino-acid substitutions evenly across the protein sequences, whereas most of the slow-evolving copies exhibit uneven substitution patterns.
Conclusions: Our results suggest that duplicate genes tend to evolve in different patterns
following the duplication event. One copy evolves faster than the other and accumulates amino-acid substitutions evenly across the sequence, whereas the other copy evolves more slowly and accumulates amino-acid substitutions unevenly across the sequence. Such different evolutionary patterns may be largely due to different functional constraints on the two copies.
Background
Since Ohno's work [1] gene duplication is widely believed to be the major source of genetic novelties. However, how the two duplicate genes evolve after the duplication event and what the major factors are that determine the fate of duplicate genes remain poorly understood and are currently under intense research.
Lynch and Conery [2] conducted a study of several eukaryotic genomes and concluded that duplicate genes often experience relaxed functional constraints and accumulate mutations at an accelerated rate. However, since their study used within-genome data without an outgroup, it could not reveal differ-ences in evolutionary patterns between two duplicates. Hughes and Hughes [3] used human genes as outgroups to
Published: 1 September 2003
Genome Biology 2003, 4:R56
Received: 15 May 2003 Revised: 24 June 2003 Accepted: 24 July 2003 The electronic version of this article is the complete one and can be
examine 17 pairs of duplicated frog genes, most of which have been duplicated recently. They found that the two duplicate copies of a gene had evolved at approximately the same rate. However, human genes are only distantly related to frog genes and may not be suitable outgroups for young duplicate frog genes. In contrast, Robinson-Rechavi and Laudet [4] and Van de Peer et al. [5], who used human or mammalian genes as outgroups to zebrafish genes, found evidence of unequal evolutionary rates between duplicate genes in zebrafish, although the percentage of pairs with such a pattern differed between the two studies. Furthermore, in a study of young duplicate genes in humans and rodents, Kondrashov et al. [6] found only two out of 49 duplicate genes showed different rates of evolution. Thus, the issue remains to be resolved.
We are interested in the questions of whether duplicated genes in general undergo different evolutionary patterns and what the possible causes for this could be. To address these questions, young human duplicate genes, which are defined as duplicate genes with Ks < 0.3, are excellent materials for several reasons. Firstly, in young duplicates the Ks (the number of synonymous substitutions per synonymous site) and Ka (the number of nonsynonymous substitutions per nonsynonymous site) values are small and can be estimated more accurately than in older duplicates. Secondly, human genes usually have no strong codon usage bias, so the Ks val-ues are not strongly distorted by this effect. Thirdly, the mouse genome provides a suitable outgroup. With the use of
outgroup sequences, the maximum likelihood method [7] can be applied, which allows the comparison of various rate mod-els [8]. Different modmod-els for amino-acid sequence evolution, with outgroups incorporated, can be compared to judge whether the amino-acid substitution rates are the same in two duplicate copies (Figure 1). Similarly, the models for coding sequences can also be compared to judge if the Ka/Ks ratios are the same in the two copies after a gene duplication. Tradi-tionally, Ka/Ks is taken as an index for the strength of func-tional constraints. Different Ka/Ks ratios usually suggest different functional constraints on two duplicate copies.
Another way to examine if two duplicate copies have experi-enced different functional constraints is to see whether the distribution of substitutions along their sequences are the same. If a duplicate copy is free of functional constraints, then amino-acid substitutions should occur evenly across the sequence. On the other hand, if a duplicate copy is still under considerable functional constraints, then functionally impor-tant regions should be subject to stronger constraints than functionally less important regions, and will accumulate fewer substitutions, thus yielding an uneven substitution pat-tern. Tang and Lewontin [9] described a statistical method to give a quantitative measure for distinguishing between even and uneven substitution patterns. The rationale of this method is that if substitutions occur evenly across a sequence, a cluster of short spaces (lengths between two consecutive substitutions) should not be extremely long. To test the sig-nificance, the longest stretch where every space is short is compared to a simulated distribution generated under the hypothesis of even substitution pattern. We combined Tang and Lewontin's [9] method and the maximum likelihood method of locating substitutions [7] to test the evenness of the substitution patterns of two duplicate genes.
Results and discussion
Amino-acid substitution ratesWe examined first whether the amino-acid substitution rates in two duplicate copies are the same. We found that among the 250 pairs of young human duplicates studied, 145 pairs showed significant evidence (at the 5% level) that one copy had evolved faster than the other at the amino-acid level. Among them, 130 pairs had significantly different rates at the 1% significance level.
Hughes and Hughes [3] found similar evolutionary rates in the 17 frog duplicates they studied, probably because the human outgroup they used was too distant to make the statis-tical test powerful. Using fairly closely related outgroups, our results suggest that the majority of young human duplicates evolve at different rates. Our results are consistent with those of Van de Peer et al. [5], but the number of gene pairs with sig-nificantly unequal rates is much higher than Robinson-Rechavi and Laudet [4] (four out of 19) and Kondrashov et al. [6] (two out of 49) found.
[image:2.612.57.298.84.294.2]Two models of protein sequence evolution Figure 1
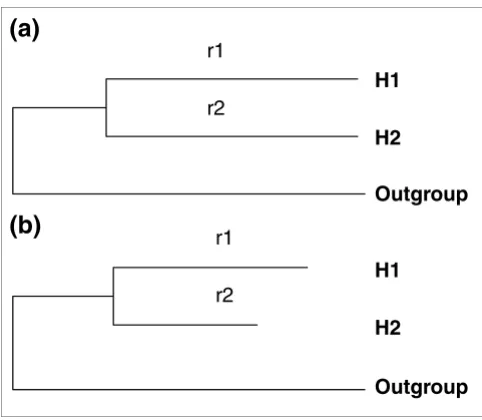
Two models of protein sequence evolution. By comparing the likelihood values of these two models, one can judge whether r1 = r2 (r1 and r2 are the amino-acid substitution rates on branches H1 and H2, respectively).
(a) The model assumes r1 = r2. (b) The model allows r1 and r2 to be different. H1 and H2: two human duplicate genes. Outgroup: the mouse ortholog.
r1
r2
r1
r2
(a)
(b)
H1
H2
Outgroup
H1
H2
comm
en
t
re
v
ie
w
s
re
ports
refer
e
e
d
re
sear
ch
de
p
o
si
te
d r
e
se
a
rch
interacti
o
ns
inf
o
rmation
Ka/Ks ratio
To discover if the functional constraints were the same on two duplicate genes, we examined the Ka/Ks ratio on each branch leading to the two copies. Among the 250 pairs, 65 pairs showed significantly different Ka/Ks ratios at the 5% level and 31 pairs showed a significant difference at the 1% level. As mentioned earlier, the Ka/Ks ratio is an important index of functional constraints. The smaller the Ka/Ks ratio is, the stronger the functional constraints are. Our result suggests that after gene duplication, a substantial proportion (65/250 = 26%) of the duplicate pairs have experienced different func-tional constraints.
Among the 65 pairs that have different Ka/Ks ratios, 54 pairs also differ between the two copies in their amino-acid substi-tution rates. Among the 185 pairs that showed no significant difference in Ka/Ks ratios, less than 50% showed significantly different amino-acid substitution rates. A 2 × 2 chi-square test (Table 1, χ2 = 22.675, df = 1, p < 0.001) reveals a
signifi-cant correlation between different Ka/Ks ratios and different amino-acid substitution rates. Therefore, duplicate pairs with different Ka/Ks ratios tend to evolve at different rates, sug-gesting that different functional constraints might be largely responsible for the unequal evolutionary rates, although, as mentioned below, some duplicate genes have apparently undergone positive selection.
One reason why we could not detect as many pairs with differ-ent Ka/Ks ratios as pairs with different amino-acid substitu-tion rates could be, in part, because fast-evolving sequences tend to have a higher Ks than slow-evolving ones. To see whether this was true, we calculated the Ks difference between
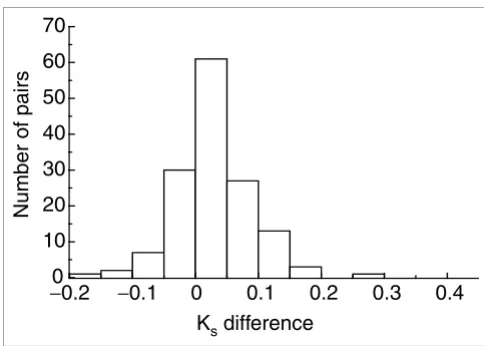
the two copies of each pair - the Ks of the fast-evolving copy minus the Ks of the slow-evolving copy. Figure 2 shows that most of the pairs have a positive Ks difference, which means that in most of the pairs the fast-evolving copy has a higher Ks than the slow-evolving copy.
Two duplicate copies may differ significantly in the number of amino-acid substitutions, which reflects a significant differ-ence between two Ka values at the nucleotide level. However, the two Ks values are also different (usually the copy with a higher Ka also has a higher Ks) which reduces the chance for the Ka/Ks ratios of the two copies to be significantly different. This weak correlation between Ka and Ks is consistent with several previous studies [10-13] and may be largely explained by the fact that silent sites in some genes are also under puri-fying selection (that is, codon usage bias) [14]. So, although we found nearly 60% of pairs with different amino-acid sub-stitution rates, we found far fewer pairs having different Ka/ Ks ratios.
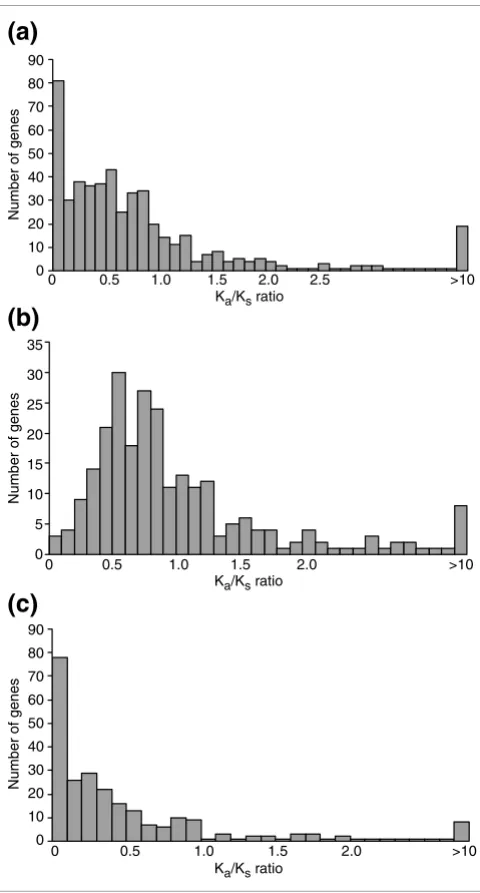
[image:3.612.54.292.122.211.2]We also looked for evidence of positive selection. Figure 3a shows that most of the genes have a Ka/Ks ratio of less than one, although there are still 113 genes with a Ka/Ks ratio greater than one. Ka/Ks > 1 suggests positive selection but evi-dence for positive selection requires the ratio to be signifi-cantly greater than one. In the genes with Ka/Ks > 1, many results are just slightly greater than one and only seven genes are found to have the Ka/Ks ratio significantly greater than one. However, this does not imply that only seven pairs of duplicate genes were subject to positive selection because, in many cases, the number of substitutions between two young Table 1
Substitution rates versus Ka/Ks ratios in duplicate genes
Different amino-acid substitution
rates*
Equal amino-acid substitution rate†
Total
Different Ka/Ks ratios‡
54 11 65
Equal Ka/Ks ratio§ 91 94 185
Total 145 105 250
A 2 × 2 chi-square test. χ2 = 12.78, df = 1, p < 0.001. The null
hypothesis is that the number of pairs with different Ka/Ks ratios is
independent of the number of pairs with different amino-acid substitution rates. The values are the observed number of pairs for each category; for example, there are 54 pairs with both different Ka/Ks ratios and different amino-acid substitution rates. The amino-acid substitution rates (or the Ka/Ks ratios) in the two duplicate genes are considered different only if the difference is statistically significant. *Gene pairs with different amino-acid substitution rates between the two duplicates. †Gene pairs with equal amino-acid substitution rates
between the two duplicates. ‡Gene pairs with different K
a/Ks ratios
between the two duplicates. §Gene pairs with equal K
a/Ks ratios
between the two duplicates.
Distribution of Ks differences between duplicate genes for gene pairs with
different amino-acid substitution rates Figure 2
Distribution of Ks differences between duplicate genes for gene pairs with different amino-acid substitution rates. The x axis is the Ks difference between duplicate genes (the Ks of the fast-evolving copy minus the Ks of
the slow-evolving one). The y axis is the number of gene pairs within a Ks
bin. This figure shows that most pairs have a positive Ks difference, which
suggests that the fast-evolving copy usually has a higher Ks than the slow-evolving copy.
−
0
0.2
−
0.1
0
0.1
0.2
0.3
0.4
10
20
30
40
50
60
70
K
sdifference
[image:3.612.312.554.477.650.2]duplicates may be too small for the test to be statistically significant, even if some of the substitutions have occurred by positive selection.
Most of the fast-evolving duplicate copies have higher Ka/Ks ratios (Figure 3b) than slow-evolving duplicate copies (Figure 3c). This supports the view that after gene duplication, one duplicate copy may have undergone purifying selection, while the functional constraints on the other copy may have been relaxed to some extent.
Different substitution patterns
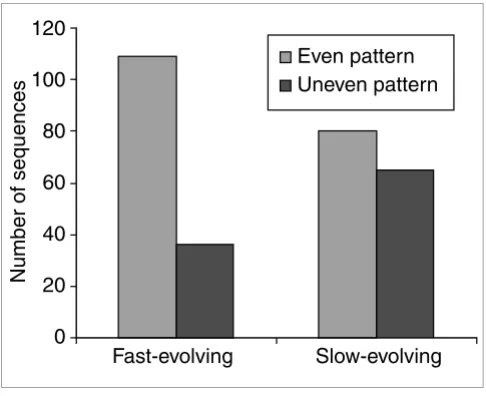
Among the 145 fast-evolving human young duplicates, 109 have an even amino-acid substitution pattern across the sequence between the human and mouse orthologs. In other words, these 109 sequences show no large highly-conserved regions. On the other hand, 65 of the 145 slow-evolving copies show evidence of an uneven substitution pattern between human and mouse orthologs, which suggests that they have some slow-evolving regions and some fast-evolving regions at the protein level.
[image:4.612.58.298.85.532.2]In order to infer the position of each amino-acid substitution in the sequence, we inferred the ancestral sequences by using PAML (Phylogenetic Analysis by Maximum Likelihood) [7] standard settings, which assume constant rates across sites. It is possible, therefore, that our estimated substitutions may be more evenly distributed than they actually are. However, because we are comparing the percentage of sequences with even patterns in fast-evolving copies to those in slow-evolving copies, this potential bias should be on both sides of the com-parison and should not change our conclusion.
Figure 4 with a chi-square test (χ2 = 12.78, df = 1, p < 0.01)
shows that fast-evolving duplicates have a significantly higher proportion of sequences with an even substitution pattern. This finding suggests that most of the fast-evolving copies have more relaxed functional constraints than slow-evolving copies and tend to accumulate substitutions evenly across the sequence. The suggestion of relaxed functional constraints for young duplicates is consistent with the observation of Lynch and Conery [2]. Of course, we cannot exclude the pos-sibility that some of the amino-acid substitutions in fast-evolving copies might have been due to positive Darwinian selection.
Our finding is very different from that of Kondrashov et al. [6], who found only two pairs with unequal evolutionary rates out of 49 pairs studied in mammals. Since they also focused on young duplications (0.05 < Ks < 0.5) and the approach they used to identify duplicate genes is similar to ours, this may be due to the different datasets used. Since the neutral pattern found in the fast-evolving copies in our study is to some extent similar to the evolution of pseudogenes, we examined the possibility of the inclusion of many pseudo-genes in our sample.
The gene predictions in the Ensembl database [15] we used always produce a translation for each gene and a stringent cri-terion (near full-length similarity) was used in our grouping method; consequently, our dataset does not include pseudo-genes due to premature codons. Since we limited our set of duplicated genes to Ks > 0.05, a pseudogene in our sample would be likely to have lost its function only very recently, otherwise it would have gained one or more premature stop codons since the time of nonfunctionalization. In the Ensembl database we used only those genes ('known' genes)
The Ka/Ks ratio distribution of young human duplicates
Figure 3
The Ka/Ks ratio distribution of young human duplicates. The x axis is the Ka/Ks ratio on the branch leading to one human duplicated gene. The y axis
is the number of genes within a Ka/Ks bin. (a) All genes from the 250 pairs,
a total of 500 sequences. (b) The fast-evolving duplicate copies of 250 pairs, a total of 250 sequences. (c) The slow-evolving duplicate copies of 250 pairs, a total of 250 sequences.
Ka/Ks ratio
Ka/Ks ratio
Ka/Ks ratio
Number of genes
Number of genes
0 0.5 1.0 1.5 2.0 2.5 >10
0 0.5 1.0 1.5 2.0 >10
0 0.5 1.0 1.5 2.0 >10
0
0 5 10 15 20 25 30 35 10 20 30 40 50 60 70 80 90
Number of genes
0 10 20 30 40 50 60 70 80 90
(a)
(b)
comm
en
t
re
v
ie
w
s
re
ports
refer
e
e
d
re
sear
ch
de
p
o
si
te
d r
e
se
a
rch
interacti
o
ns
inf
o
rmation
with experimental support and those genes ('novel' genes) with high similarity to known genes in human and other organisms. Genes purely from Genscan predictions were not used in this analysis. These approaches would have effectively reduced the portion of pseudogenes in our dataset. If the functional constraints on a gene are largely relaxed, the evo-lutionary pattern of this gene may be similar to that of pseu-dogenes. So it is possible that some of the fast-evolving genes may be on their way to become pseudogenes, although it is still possible that they may evolve new functions. Kondrashov
et al. [6] used a cDNA-based dataset and found only a few duplicated pairs with different evolutionary rates, which may have represented those genes that survived well through selection and were still functioning. In other words, the cDNA-based genes which they used are normally expressed, meaning these genes may still be under strong selection pres-sure. Our dataset might be more appropriate for providing a general scenario of how two duplicate genes evolve after gene duplication.
Conclusion
We used conservative criteria to select young human dupli-cate pairs and applied a stringent statistical method to test whether two duplicate copies exhibit different evolutionary patterns. Our results suggest that, in most cases, during the early stage of evolution following gene duplication, the two duplicates evolve at different rates, which could affect the fate of the two copies. Different functional constraints on the two
copies may have been largely responsible for the different rates. One copy may have relaxed functional constraints, while the other could still be under strong constraints. The stringent statistical tests used in this study might have under-estimated the proportion of pairs with this pattern, but this could only strengthen our argument.
Materials and methods
Processing data and selecting independent young human duplicate genes
Human genes were downloaded from the Ensembl human database [15] version 11.31 (28 February 2003). The original dataset is available from the authors on request. Only known and novel genes were used in this analysis; those sequences containing repetitive elements detected by FASTA (E = 10-5)
searching against Repbase [16-18] were removed from the dataset. If two genes overlapped at a chromosomal position, the gene with the longer protein was retained. The protein sequences selected were grouped into families by the method used by Gu et al. [19]. Within each gene family, the selection of independent duplicate gene pairs proceeded with increas-ing Ks. That is, within each gene family, we selected the gene pair with the smallest Ks and excluded it from the family and then selected the gene pair with the smallest Ks from among the remaining genes. We repeated this until no gene pairs could be selected. This method ensured that a gene in one pair would not appear in another pair. Among the duplicate genes we selected, those pairs with 0.05 < Ks < 0.3 were used in this study. We used Ks < 0.3 as a cutoff to define young human duplicates. With the Ks between human duplicate genes less than 0.3, the duplication would have occurred less than 50 million years ago. Pairs with Ks < 0.05 have too few substitu-tions to make a statistical test meaningful. For each pair we selected, both copies were used to search the mouse database. Mouse genes were also obtained from the Ensembl database [15] version 11.3 (28 February 2003) and were cleaned using the same procedure that was used to clean the human data-base. The pairs in which the two copies had the same best hits and a human-mouse Ks < 1 were kept for this study. We chose Ks < 1 as a cutoff point because a distant outgroup makes it harder to detect rate differences. A set of 250 young human duplicate pairs and their mouse orthologs were thus retained.
Statistical methods to compare evolutionary patterns between two copies
[image:5.612.54.297.86.284.2]To calculate if the evolutionary rates and the Ka/Ks ratio are the same between the two duplicate copies, the likelihood-ratio test [8] was applied to each pair selected. To test the hypothesis of equal evolutionary rates between the two dupli-cate copies at the amino-acid level, a two-rate model and a free-rate model were compared. The two models differ in that the two-rate model assumes the same evolutionary rate on the two branches leading to the two duplicates but allows the rate on the outgroup branch to be different, while the free-rate model does not impose any equal free-rates among branches. Comparison between fast-evolving copies and slow-evolving copies
Figure 4
Comparison between fast-evolving copies and slow-evolving copies. The figure shows that fast-evolving copies have more cases with substitutions distributed evenly along the sequence than slow-evolving copies. Fast-evolving: the copy that has evolved faster than the other in each duplicate pair. Slow-evolving: the copy that has evolved slower than the other in each duplicate pair. Even pattern: a sequence that has evenly-distributed substitutions along the sequence. Uneven pattern: a sequence that has unevenly-distributed substitutions.
Fast-evolving
Slow-evolving
Number of sequences
Even pattern
Uneven pattern
120
100
80
60
40
20
The codeml program (set seqtype = 2 for amino-acid sequences) in the PAML package was run for each of the two models with all parameters set to default except for the parameter 'model' for amino-acid substitution, which was set to 'Poisson'. We also set this parameter to the 'Jones-Taylor-Thornton model' and the conclusion was basically the same. Two maximum likelihood values for the two models were given, and twice the difference was compared to a chi-square distribution. If significant, the results suggest that the two branches have evolved at unequal rates. To test if the Ka/Ks ratios are different between the coding sequences of the two duplicates, a two-ratio model, which assumes the same Ka/Ks ratio on the branches leading to the two duplicates but an independent Ka/Ks ratio on the branch leading to the out-group, was compared to the free-ratio model, which assumes an independent Ka/Ks ratio for each branch.
Substitution patterns and differential selection
Using the PAML package [7], the ancestral sequence of each human duplicate gene pair was reconstructed and the posi-tion of each substituposi-tion was located. Tang and Lewontin's [9] method was then applied to calculate the T statistics of each human sequence. For each human sequence, 100,000 pseudo-sequences were generated under the null hypothesis that the substitutions distribute evenly across the sequences, and the distribution of T statistics of these 100,000 pseudo-sequences was generated. The T statistic of the real sequence was then compared to this distribution. If the T statistic was extremely large or small (the rejection level is 0.05), we con-sidered it to be an even distribution. The program was written in Perl and is available upon request.
Additional data files
The amino-acid alignments (Additional data file 1) and cod-ing sequence alignments (Additional data file 2) are available in PAML format with the online version of this article. Additional data file 1
The amino-acid alignments The amino-acid alignments Click here for additional data file Additional data file 2
The coding sequence alignments The coding sequence alignments Click here for additional data file
Acknowledgements
This study was supported by NIH grants.
References
1. Ohno S: Evolution by Gene Duplication. Berlin: Springer-Verlag: 1970.
2. Lynch M, Conery JS: The evolutionary fate and consequences of duplicate genes.Science 2000, 290:1151-1155.
3. Hughes MK, Hughes AL: Evolution of duplicate genes in a tetra-ploid animal, Xenopus laevis.Mol Biol Evol 1993, 10:1360-1369. 4. Robinson-Rechavi M, Laudet V: Evolutionary rates of duplicate
genes in fish and mammals.Mol Biol Evol 2001, 18:681-683. 5. Van de Peer Y, Taylor JS, Braasch I, Meyer A: The ghost of
selec-tion past: rates of evoluselec-tion and funcselec-tional divergence of anciently duplicated genes.J Mol Evol 2001, 53:436-446. 6. Kondrashov FA, Rogozin IB, Wolf YI, Koonin EV: Selection in the
evolution of gene duplications. Genome Biol 2002,
3:research0008.1-0008.9.
7. Yang Z: PAML: a program package for phylogenetic analysis by maximum likelihood.CABIOS 1997, 13:555-556.
8. Yang Z, Nielsen R: Synonymous and nonsynonymous rate
var-iation in nuclear genes of mammals.J Mol Evol 1998, 46:409-418. 9. Tang H, Lewontin RC: Locating regions of differential variabil-ity in DNA and protein sequences.Genetics 1999, 153:485-495. 10. Graur D: Amino acid composition and the evolutionary rates
of protein-coding genes.J Mol Evol 1985, 22:53-62.
11. Wolfe KH, Sharp PM: Mammalian gene evolution: nucleotide sequence divergence between mouse and rat.J Mol Evol 1993,
37:441-456.
12. Mouchiroud D, Gautier C, Bernardi G: Frequencies of synony-mous substitutions in mammals are gene-specific and corre-lated with frequencies of nonsynonymous substitutions.J Mol Evol 1995, 40:107-113.
13. Ohta T, Ina Y: Variation in synonymous substitution rates among mammalian genes and the correlation between syn-onymous and nonsynsyn-onymous divergence. J Mol Evol 1995,
41:717-720.
14. Hellmann I, Zollner S, Enard W, Ebersberger I, Nickel B, Paabo S:
Selection on human genes as revealed by comparisons to chimpanzee cDNA.Genome Res 2003, 13:831-7.
15. Hubbard T, Barker D, Birney E, Cameron G, Chen Y, Clark L, Cox T, Cuff J, Curwen V, Down T, et al.: The Ensembl genome database project.Nucleic Acids Res 2002, 30:38-41.
16. Jurka J: Repbase Update: a database and an electronic journal of repetitive elements.Trends Genet 2000, 16:418-420.
17. Jurka J: Repeats in genomic DNA: mining and meaning.Curr Opin Struct Biol 1998, 8:333-337.
18. Repbase [http://www.girinst.org/Repbase_Update.html]