N u m e r i c al e v al u a tio n of t h e r m a l
c o mf o r t i n t r a di tio n al c o u r t y a r d s
t o d e v el o p n e w m i c r o cli m a t e
d e si g n in a h o t a n d d r y cli m a t e
N a s r oll a hi, N, H a t a m i, M , Kh a s t ar, S a n d Tal e g h a n i, M
h t t p :// dx. d oi.o r g / 1 0 . 1 0 1 6 /j. s c s. 2 0 1 7 . 0 8 . 0 1 7
T i t l e
N u m e r i c al e v al u a tio n of t h e r m a l c o mf o r t in t r a d i tio n al
c o u r t y a r d s t o d e v elo p n e w m i c r o cli m a t e d e si g n in a h o t
a n d d r y cli m a t e
A u t h o r s
N a s r oll a h i, N, H a t a m i, M , Kh a s t ar, S a n d Tal e g h a n i, M
Typ e
Ar ticl e
U RL
T hi s v e r si o n is a v ail a bl e a t :
h t t p :// u sir. s alfo r d . a c . u k /i d/ e p ri n t/ 4 3 5 2 4 /
P u b l i s h e d D a t e
2 0 1 7
U S IR is a d i gi t al c oll e c ti o n of t h e r e s e a r c h o u t p u t of t h e U n iv e r si ty of S alfo r d .
W h e r e c o p y ri g h t p e r m i t s , f ull t e x t m a t e r i al h el d i n t h e r e p o si t o r y is m a d e
f r e ely a v ail a bl e o nli n e a n d c a n b e r e a d , d o w nl o a d e d a n d c o pi e d fo r n o
n-c o m m e r n-ci al p r iv a t e s t u d y o r r e s e a r n-c h p u r p o s e s . Pl e a s e n-c h e n-c k t h e m a n u s n-c ri p t
fo r a n y f u r t h e r c o p y ri g h t r e s t r i c ti o n s .
1
Numerical evaluation of thermal comfort in traditional courtyards to develop
new microclimate design in a hot and dry climate
Nazanin Nasrollahi¹
*
, Mojtaba Hatami¹, Seyedeh Razieyeh Khastar¹, Mohammad Taleghani²
¹Department of Architecture, Faculty of Technology and Engineering, Ilam University,
Pazhohesh Boulevard, Ilam, Iran
² School of the Built Environment, University of Salford, Manchester, UK
Abstract
The growing interest in thermal comfort of outdoor environments yields in different analysis on courtyards
as a common space between urban and architectural scales. However, there is a limited knowledge
regarding the microclimatic behavior of such spaces. Using ENVI-met simulations, this paper aims to
numerically discuss the thermal performance of different configurations of traditionally designed
courtyards in Shiraz, Iran, which experiences hot summers and cold winters. The geometrical effects such
as orientation and H/W (height to width ratio) of courtyards are considered as potential parameters to
improve the microclimatic conditions. In this paper, PMV and UTCI are used as thermal comfort indices.
The obtained results indicate mean radiant temperature and wind speed as the most effective parameters for
thermal comfort of courtyards. In addition, the aforementioned geometrical parameters might not be able
to solely create a desirable condition, but they could significantly improve the thermal comfort of courtyards
during summer and winter. To achieve a desirable thermal comfort level, the results suggest using
configurations of a high H/W rate and southward orientation in order to obtain better shading during
summer as well as allowing the solar radiation in while regulating the wind speed in winter.
2
1.
Introduction
The quality of urban environments has recently become a multidisciplinary subject (Steemers, 2003)
(Littlefair, et al., 2001) (Berkovic, Yezioro, & Bitan, 2012) (Ali Toudert, 2005). In fact, the meteorologists
gradually shifted their focus on visible changes of urban climates and heat islands to micro scales (Oke ,
2002) (Landsberg, 1981). This is mainly due to the importance of urban design based on changes of urban
climates and intensified heat islands. On the other hand, urban planners as well as architects investigating
the interaction between environmental factors and buildings adopted a wider perspective in order to
properly assess the existed interactions on a larger scale (Berkovic, Yezioro, & Bitan, 2012) (Knowles,
1981). As the interest in topics regarding thermal comfort in outdoor environments grows, as a common
theme in both field, central courtyards are thoroughly discussed as an interactive space between urban and
architectural scales. Central courtyard is an open or semi-open space that is surrounded by either walls or
buildings (Taleghani, Tenpierik, & van den Dobbelst, 2014). Utilizing central courtyards in Iran dates back
to the ancient time (Saljoughinejad & Rashidi Sharifabad, 2015) (Memarian & Brown, 2006) (Safarzadeh
& Bahadori, 2005). This type of architecture has also been used by many ancient civilizations (Taleghani,
Tenpierik, & van den Dobbelst, 2012) (Saljoughinejad & Rashidi Sharifabad, 2015) (Mohsen, 1979a). The
central courtyards are used in order to have access to fresh air and daylight in extreme climates (Sharples
& Bensalem, 2001) (Alvarez, Sanchez, & Molina, 1998) (Shao, Walker, & Woolliscroft, 1993) (Sadafi,
Salleh, Chin Haw, & Jaafar, 2011) (Hopkinson, Galbraith, Petherbridge, & Longmore, 1966) (Acosta,
Navarro, & Sendra, 2014) (Acosta, Navarro, & Sendra, 2013) (Vaisman & Horvat, 2015) (Michael,
Heracleous, Thravalou, & Philokyprou, 2017). The validity of central courtyards as a way to reduce energy
consumption in interior spaces is approved by several studies (Safarzadeh & Bahadori, 2005) (Taleghani,
Tenpierik, & van den Dobbelst, 2014) (Yasa & Ok, 2014) (Muhaisen & Gadi, 2006b) (Zakaria, Kubota, &
Chyee Toeb, 2015) (Al-Masri & Abu-Hijleh, 2012) (Manioglu & Koçlar Orala, 2015) . In fact, the central
courtyard is regarded as a climatic optimizer as it provides better environmental thermal conditions
3
2015) (Soflaei, Shokouhian, & Mofidi Shemirani, 2016). There has not been an effort in order to improve
thermal comfort of these buildings in Iran, despite the increasing development of urban environments as
well as utilization of central courtyards in contemporary architecture of Iran.
Meir et al (Meir, Pearlmutter, & Etzion, 1995) conducted the very first research regarding the microclimatic
behavior of unshaded courtyards. Two identical central courtyards with different orientations (westward
and southward) are tested in order to determine the necessary information regarding impacts of geometry
on thermal behavior of these models in hot and dry climates. It is concluded that geometry has a vital role
in thermal behavior of such courtyards along with proper orientation and regulating ventilation as well as
appropriate shadowing could improve the microclimatic situation. Muhaisen and Gadi’s research on
circular, polygon and rectangular courtyards indicate dimensions, proper proportion, latitude and climatic
conditions are effective in terms of appropriate shadowing in a courtyard (Muhaisen & Gadi, 2006a)
(Muhaisen & Gadi, 2005) (Muhaisen, 2006). They also suggest the optimum height for rectangular
courtyards in hot and humid, hot and dry, temperate and cold climates are 4, 2 and 1 floor respectively. An
efficient courtyard should allow the maximum amount of sunlight during winter while reducing it to its
possible minimum amount in summer (Muhaisen, 2006). However, absorbing more solar radiation in winter
is more important than blocking the same radiations during summer (Muhaisen & Gadi, 2006b). Berkovic
et al (Berkovic, Yezioro, & Bitan, 2012) numerical study of different configuration of courtyards in hot and
dry climate conclude that thermal comfort of central courtyards is highly dependent on solar radiation and
shadowing has a vital role to improve thermal comfort in summer. Considering the aforementioned facts,
the importance of courtyards of north-south orientation and vegetation for better shadowing is suggested in
this article. In a conducted research (Al-Hemiddi & Al-Saud, 2001) is concluded that covering courtyards
during the day and doing the opposite at night significantly reduces the average temperature of the
courtyard. In addition, central courtyards with swimming pools, canopies and spraying water during sunny
hours of the day have significant effects on improving thermal behavior of indoor environments.
4
the microclimatic conditions (Almhafdy, Ibrahim, Sh Ahmad, & Yahya, 2015). The obtained results prove
the superiority of rectangular central courtyards (with ratio of 1:2) over square courtyards.
Ghaffarianhosseini’s et al (Ghaffarianhoseini, Berardi, & Ghaffarian, 2015) research investigates effects of
unshaded courtyards on thermal comfort in hot and humid climate of Malaysia using ENVI-met. A 24 x 24
square courtyard as the common form of courtyards in Malaysia is selected in order to determine the effects
of geometry (orientation and heights of surrounding buildings) and vegetation. The obtained results show
that northward courtyards due to better shadowing perform better in contrast to the other orientations.
Increasing height of the walls and implementing proper form of vegetation also improves the overall
thermal comfort. It could be concluded that thermal comfort is easily achievable using appropriate design
(Ghaffarianhoseini, Berardi, & Ghaffarian, 2015). The aforementioned fact is supported by many research
studies on this particular matter (Mohsen, 1979a) (Mohsen, 1979b) (Aldawoud, 2008) (Cantón, Ganem,
Barea, & Fernández Llano, 2014).
The microclimatic research projects indicate that thermal comfort and behavior is highly dependent on
geometrical parameters such as urban canyons (Thorsson, Lindberg, Bjorklund, & Rayner, 2011) (Coronel
& Alvarez, 2001) (Santamouris, Papanikolaou, Koronakis, Livada, & Asimakopoulos, 1999) (Yang, Li, &
Yang, 2012) (Bourbia & Awbi, 2004a) (Herrmann & Matzarakis, 2012) (Ndetto & Matzarakis, 2013)
(Ka-Lun Lau, Lindberg, Rayner, & Thorsson, 2015). For instance, Ali-Toudert conducted research during
summer of a hot and dry climate, discussing creating and expanding a microclimatic comfort zone on street
level (Ali Toudert, 2005) (Ali-Toudert & Mayer, 2006) (Ali-Toudert, Djenane, Bensalem, & Mayer, 2005).
These studies illustrate conjunction of geometrical parameters such as aspect ratio and solar orientation as
a proper strategy to decrease thermal stresses. They also include the change of Tmrt (mean radiant
temperature) which is the overall absorbed energy by pedestrians have significant effects on thermal
comfort in outdoor environments (Ali-Toudert, Djenane, Bensalem, & Mayer, 2005) (Ali-Toudert &
Mayer, 2007). In such climates urban canyons with greater diameter (higher sky view factor (SVF)) causes
5
Mayer, 2007) (Pearlmutter, Bitan, & Berliner, 1999) (Bourbia & Boucheriba, 2010) (Bourbia & Awbi,
2004b). However, Sharmin and Steemers mention that in mid-latitude cities where the Sun height is fairly
low, using low depth urban canyons decreases Tmrt while in cities where the Sun height is greater deep
urban canyons are unable to block solar radiation properly and due to overall increase of net radiant, Tmrt
also increases accordingly (Sharmin & Steemers, 2013). The effects of proper designing of streets (H/W,
vegetation, orientation and SVF) in hot and dry weather in central Europe is studied thoroughly (Holst &
Mayer, 2011). In some of these studies, the significance of 3D Radiant Flux Densities and its impact on
Tmrt, PET and temperature is discussed and they indicate change of Tmrt and Radiant Flux Densities of long
and short wavelengths are of high importance (Holst, Dostal, Imbery, & Mayer, 2009) (Mayer, Kuppe,
Holst, & Matzarakis, 2009). In general, the magnitude of Tmrt is shown through 3D Radiant Flux Densities
with long wavelength while its fluctuation is dependent on short wavelength (Lee, Mayer, & Schindler,
2014) (Ali-Toudert & Mayer, 2007). For instance, the short wavelength effects on changes of Tmrt is about
10% under shadow and 29% in locations without shadow (Mayer, Kuppe, Holst, & Matzarakis, 2009). In
addition, vegetation as a microclimatic optimizer works perfectly in conjunction with trees in contrast to
being implemented solely. This statement is verified by many studies which mainly concentrate on the
importance as well as the effects of vegetation on regulating Tmrt and PET (Ali-Toudert & Mayer, 2005)
(Lee, Holst, & Mayer, 2013) (Hisarligil, 2013) (Makaremi, Salleh, Jaafar, & Ghaffarian Hoseini, 2012)
(Yahia & Johansson, 2014) (Shashua-Bar, Pearlmutter, & Erell, 2009) (Robitu, Musy, Inard, & Groleau,
2006) (Christopoulou, Tsiros, Hoffman, & Tseliou, 2015) (Chen & Ng, 2013) (Lin, Matzarakis, & Hwang,
2010) [61-70]. Taleghani’s et al (Taleghani, Tenpierik, van den Dobbelsteen, & Sailor, 2014) (Taleghani,
Sailor, Tenpierik, & van den Dobbelsteen, 2014) (Taleghani, Tenpierik, van den Dobbelsteen, & sailor,
2014) study which is conducted in a temperate climate discusses different approaches for decreasing
absorbed solar radiation such as geometrical parameters (orientation and overall configuration), vegetation,
using surfaces with higher albedo and water pools. The obtained results of many studies show that buildings
with a single configuration, linear or courtyard, those with courtyard experience the lowest rate of energy
6
design in urban blocks creates the most desirable microclimatic condition in contrast with single
configuration and linear models (Taleghani, Kleerekoper, Tenpierik, & van den Dobbelsteen, 2015)
(Taleghani, Tenpierik, van den Dobbelsteen, & de Dearb, 2013). Furthermore, these studies suggest direct
exposure time and Tmrt are the most important factors in changes of thermal comfort (Taleghani,
Kleerekoper, Tenpierik, & van den Dobbelsteen, 2015). According to a review of current scientific themes,
there is a gap in followings: There are a few studies in terms of thermal comfort in central courtyards.
There is also a need for policy formulation of such designs since implementing it in current architecture
urges the need of using different strategies at early stages while there are a few studies regarding this matter
performing ideally both in cold winters and hot summers. There are also limited research on thermal
environment of central courtyards in traditional architecture of Iran, considering Iran as one of the first
exploiters of this idea. Therefore, this study aims to fully discuss the thermal behavior of courtyards during
summer and winter using traditional architectural methods used in Shiraz, Iran.
2. Methodology
This research investigates the thermal comfort of traditional courtyard houses in Shiraz. The scientific
approach of this study is divided into two phases:
Phase 1: Evaluating the thermal performance of such designs in houses with courtyards in Shiraz.
Phase 2: Selecting a model with the most desirable thermal performance and investigating the effects of
geometrical parameters (H/W and orientation) on its performance.
7
Figure 1 .The specification of research process.
2.1. Categorizing samples with courtyards:
In order to select the desired sample based on traditional architecture of Shiraz, 45 houses with courtyards
are investigated. The required data regarding these houses are obtained from Cultural Heritage
Administration of Shiraz (Documentation Center of Fars Cultural, Handicrafts & Tourism Organization,
2015) . Some of these traditional houses have been recently refurbished as a museum or hotel, and
courtyards have been used for recreation, entertainment or relaxation (Figure 2). Considering different
factors including courtyards degree of enclosure, orientation, width, dimension, ratio to the building, 19
models are developed and listed in 4 different groups of one- sided, two-sided, three-sided and four-sided
models (Figure3). The openings, materials, flooring and roofs of all models are the same in each group. In
addition, there is about 10% vegetation around all houses. Tables 1&2 show the classification process of
developed models based on 45 courtyard houses. The prototype model of one-sided courtyard house is
based on a set of different parameters such as orientation, mass, number of floors. Since these six courtyard
8
[image:9.612.84.529.83.297.2]Figure 2. A view of courtyards in Manteghinezhad house, Saadat house, Niayesh hotel and Zinatolmolk house in Shiraz city (hamgardi, n.d.) (ataland, n.d.) (jonoubnews, n.d.).
Figure 3. Frequency distribution of courtyards in 4 different groups of one- sided, two-sided, three-sided and four-sided models.
Table 1. The process and development of hypothetical courtyard models.
No. of courtyar d hous es Physical parameters C lass ifi cat ion of court yar d No. of houses orientation D e ve lop e d m od e l Courtyard location No. of f loors No. of m od e ls No. of m od e ls To tal N
o. of each
[image:9.612.177.431.373.556.2] [image:9.612.82.528.641.701.2]9 45 Vegetation, water body/pool, thermal performance of walls, floors and ceilings One sided 6 North to
south 1 South
2 1 1 19 Two sided 7 North to south 2 Center 2 1 5 Southeast 1 East to west 3 Center 1 Southeast 1 Southwest 1 Three sided 16 North to south 3
South 2 1
8
East 2 1
West 2 1
East to west
5 East 2 2
South 1 3
Four
sided 16
East to
west 5 Center
1 1
5 5
[image:10.612.87.524.71.262.2]2 4
Table 2. The clasification of developed courtyard modelsbased on 45 courtyard houses.In the model numbers , ‘c’ stands for cold days and ‘ h’ stands for hot days.
Classification of courtyard models
4-Sided:5 models
mass dimensions: height:8, 4 m width:12m
depth:16m
courtyard to mass ratio: 31.5% openings to walls ratio:30%
3-Sided:8 models
mass dimensions: height:8, 4 m width:11m
depth:14m
courtyard to mass ratio: 34% openings to walls ratio:30%
2-Sided:5 models
mass dimensions: height:8 m width:10.5m
depth:11.5m
courtyard to mass ratio: 36% openings to walls ratio:30%
1-Sided:1model
mass dimensions: height:8 m width:16m
depth:20m
courtyard to mass ratio: 60% openings to walls ratio:30%
1c/1h 6c/6h 11c/11h 14c/14h 19c/19h
2c/2h 7c/7h 12c/12h 15c/15h
3c/3h 8c/8h 13c/13h 16c/16h
10
5c/5h 10c/10h 18c/18h
2.2.
Simulation procedure:
All simulations in this study are done by the urban computational fluid dynamics software ENVI-met 4.
ENVI-met is a holistic three-dimensional non-hydrostatic model for the simulation of surface-plant-air
interactions. It is designed for microscale simulation with a typical horizontal resolution from 0.5 to 10 m
and a typical time frame of 24 to 48 hours with a time step of 1 to 5 seconds. This resolution allows to
analyze small-scale interactions between individual buildings, surface and plants (Bruse, ENVI-met 4.0
beta, 2015). ENVI-met is capable of calculating main wind flow, turbulence, radiative fluxes, air
temperature and humidity (Bruse & Fleer, 1998). Some of the important assumptions in ENVI-met are
listed in Table 3. This software is authenticated regarding computing conditions of outdoor environments
(Ghaffarianhoseini, Berardi, & Ghaffarian, 2015) (Ali-Toudert & Mayer, 2006) (Yahia & Johansson, 2014)
(Salata, Golasi, de Lieto Vollaro, & de Lieto Vollaro, 2015) (Middel, Häb, Brazel, Martin, & Guhathakurta,
2014) (Krüger, Minella, & Rasia, 2011) (Chow & Brazel, 2011) (Lahme & Bruse, 2003) (Taleb &
Abu-Hijleh, 2013) (Thapar & Yannas, 2008). Table 4 illustrates the simulation conditions of this study.
Table 3.Assumptions in the simulation.
Assumptions in ENVI-met
Flat ground
Box shaped buildings
Cubic grid with max resolution of 1 m. Higher resolution is enabled only for the
vertical (z) axis next to the surface using equidistant or telescoping grid
Empirical initial boundary conditions, found by trial and error, in order to get good
11
Constant wind profile during all simulation times therefore wind speed is nearly
constant next to the surface during all simulation times
Buildings have constant indoor temperature and no heat storage
1D soil model considering a 5 level profile of humidity and temperature
Vegetation model considering the photosynthesis rate, the CO2 demand, and the
[image:12.612.118.493.350.604.2]state of the stomata, the interaction of humidity and radiation in soil and air
Table 4. The conditions used in the configuration file (step one of the parametric study).
Simulations input
parameters Hot day Cold day
Location Shiraz, Iran(latitude 29
0_ 32’
N and longitude 520_ 36’ E)
Simulation day 12.07.2015 5.01.2015
Simulation period 18 h, from 6:00 am to
23:00 pm
Domain size 60 *60 * 30
Grids spatial resolution 1 m Horizontally, 1 m
vertically
Initial air temperature 28.85 0C 6.35 0C
Wind speed 3.4m/s 2.9m/s
Wind direction 3150
Relative humidity (in 2 m) 24% 64%
Cloud coverage 0
Indoor temperature 200C
Thermal conductance
0.3 (W/m2 K) ( walls), 0.2
(W/m2 K)
(roofs)
Albedo 0.3 (Walls), 0.35 (roofs)
Many indices are being used to evaluate thermal comfort in outdoor environments, such as: the
Physiological Equivalent Temperature (PET) (Höppe, 1999), the Actual Sensation Vote (ASV)
12
Bulb Globe Temperature (WBGT) (Yaglou & Minard, 1957), the Effective Temperature (ET) (Houghton
& Yaglo, 1923) and the New Standard Effective Temperature (SET*) (Gagge, Stolwijk, & Hardy, 1967).
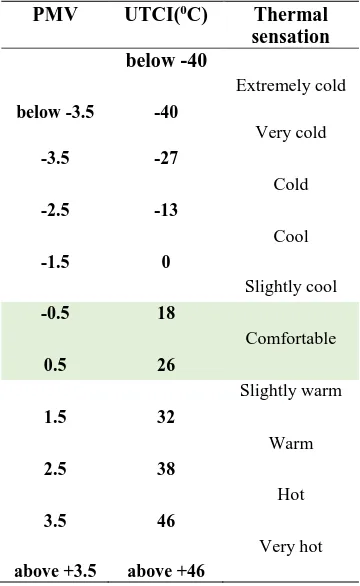
In this study, both PMV and UTCI are used. The thermal comfort of courtyards at the height of 1.5m from the ground is
evaluated using PMV. At the center of the courtyards (1.5m above ground), the thermal comfort is evaluated by UTCI. PMV is
developed to determine the level of thermal comfort in indoor environments, but its modified version can also determine the
thermal comfort level of outdoor environments (Havenith, et al., 2012). In general, the PMV’s range in outdoor environments
varies between -4 to +4 and the thermal comfort zones range is between -0.5 to +0.5 which is within the accepted domain of -2 to
+2. The thermal comfort is evaluated at the center point of every courtyard at height of 1.5 m using the Universal Thermal
Climate Index (UTCI). UTCI uses mean radiant temperature, air temperature, air velocity and relative humidity in order to
calculate the thermal comfort index in outdoor environments (Jendritzky, de Dear, & Havenith, 2012). Considering this model,
walking speed of 4km/h (2.3 met) and clo-value is calculated using UTCI clothing model (Havenith, et al., 2012). This index
estimates the thermo-physiological investigation of thermal environment for any given climate, season or scale. The thermal
stresses are defined over 10 scales ranging from extreme heat stress to extreme cold stress. The thermal comfort zone is believed
[image:13.612.216.396.420.713.2]to be between 18 and 26 °C (Table 5) (UTCI, 2015).
Table 5. Ranges of Predicted Mean Vote (PMV) and Universal Thermal Climate Index (UTCI) for different grades of thermal
sensation (Bröde et al., 2012) (Emmanuel, 2016) (UTCI, 2015).
PMV UTCI(0C) Thermal
sensation below -40
Extremely cold
below -3.5 -40
Very cold
-3.5 -27
Cold
-2.5 -13
Cool
-1.5 0
Slightly cool
-0.5 18
Comfortable
0.5 26
Slightly warm
1.5 32
Warm
2.5 38
Hot
3.5 46
Very hot
13
2.3. Validation of ENVI-met
In order to validate the purposed model of this study, there is a comparison between a measured traditional
house with a courtyard in Ilam, Iran (latitude 33038’ N/longitude 46026’ E) with ENVI-met results. The
data logger is placed 1.5 m above ground with time interval of 30 minutes is used to measure the dry-bulb
temperature (Figure 4). Micrometeorological data within the courtyard is measured on three consecutive
days fromNovember 23rd to 25th , 2015 by Standard ST-174B data logger with accuracy of ±1°C. The data
for simulation is obtained through the local weather station. These measurements were conducted in
November, due to the elimination of some interference, such as the movement of people at the measurement
site, as well as permitting field measurements in the courtyard. A field survey was conducted for three
consecutive days from 23rd to 25th of November. Then the measured data were averaged over these three
days and compared with the simulated averaging data. Figure 5 demonstrates a comparison of both the
simulation and obtained data of measurements. This comparison verifies the conducted simulation. The
temperature is at its maximum points for both graph around 11am to 1 pm. The temperature difference
between both graphs is about 1.5 °C at the maximum points, whereas the average difference is 0.50 °C.
This difference could be justified considering inaccuracies in the data entry, features of used materials and
vegetation conditions. The correlation between the measured data and simulation is 0.87 which indicates a
14
Figure 4. Data logger (A), a view of the measured courtyard (B) and the location of the traditional courtyard house (C).
Figure 5. A Comparison of the average data of air temperature between simulation results and the measurements on 23rd to 25th November (left). The comparison of the air temperature in a scattered graph (right).
[image:15.612.75.534.436.604.2]15
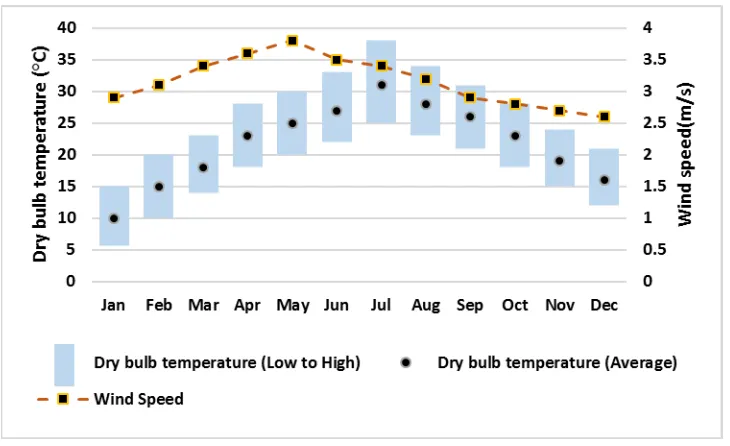
Shiraz is located in south west of Iran (latitude 29032’ N/longitude 52036’ E). Iran meteorological
organization data show that Shiraz experiences hot and dry summers as well as fairly cold and dry winters
(IRIMO, 2015). In order to properly examine the thermal performance of central courtyards in a period
consisting summer and winter, both coldest and hottest days of Shiraz are selected using an official 60-year
weather data of Shiraz (1951-2010). According to this data, both highest dry temperature and radiation level
occurs in July whereas these two parameters are at their lowest in January (IRIMO, 2015). The maximum
mean of dry temperature in July is 30.1°C while the minimum is 5.6 °C in January (Figure 6). However,
the relative humidity in July is about 24% and this number increase to 64% in January (Figure 7) (IRIMO,
2015). For simulation purposes, July 12th with maximum temperature of 37.9 °C and January 5th with
minimum of 0.1°C are selected respectively. The wind speed is 3.4 m/s in July 12th while this number
reduces to 2.9 m/s in January. The prevailing wind direction for both days is at 315 degrees. The
[image:16.612.125.490.381.604.2]aforementioned values are used as input data for the simulations (IRIMO, 2015).
16
Figure 7. The average direct normal radiation and relative humidity in Shiraz from 1951 to 2010.
2.5. Urban Environment Simulation
The examined models of central courtyard are located in the urban environment of Shiraz. The thermal
performance of these models are evaluated with (case 1) and without (case 2) the surrounding urban blocks.
However, the urban blocks of case 2 are genuine and simplified in terms of traditional architecture of Shiraz.
The aspect ratio of urban blocks is genuine and the height change of 1-2 stories is randomly selected.
Air temperature and mean radiant temperature are analyzed in July 12th. The results of this comparison is
shown in Figure 8. As it is evident, the difference between air temperature and mean radiant temperature in
two cases is inconsiderable. The mean radiant temperature difference is about 0.48 °C and this difference
for air temperature is 0.33 °C. The high correlation of 0.99 indicate a high consistency between them. The
examined central courtyards are considered without the surrounding urban blocks since their effect on air
17
Figure8. (a) The courtyard model with neighboring blocks, (b) the same courtyard model without neighbors, (c) mean radiant temperature in different conditions, (d) the comparison of the mean radiant temperatures in a scattered graph,(e) air
temperature in different conditions,(f) the comparison of the air temperatures in a scattered graph.
3. Results
18
In this section, thermal performance of 19 central courtyard configurations are analyzed in summer and
winter. For analytical purposes of thermal behavior, air temperature, Tmrt and UTCI are considered at the
center of each courtyard at the height of 1.5 m during the time range of 6 am-23 pm on July 12th (hottest
day) and January 5th (coldest day). Due to the higher occupancy and most frequent use of courtyard, the
simulation period is from 6am to 23 pm. Most of people in Shiraz culturally use their central courtyards
within the time range of 6am-11 pm. Therefore, it is decided to take advantage of this time frame as the
optimal time for simulation purposes of this research.
3.1.1. Air temperature analysis
Analyzing the change of temperature, it is obvious that in all 19 models during both summer and winter,
the air temperature increases between 6 am-16 pm while it decreases rapidly between 17-23 pm. It is
interesting to mention the consistency in the temperature change pattern is the same for all courtyard
models. The maximum temperature of all 19 models is at 4 pm. The maximum difference of air temperature
between all 19 configurations in summer is 0.5 – 1°C. This difference in winter is about 0.5 – 1.2°C. It is
concluded that the air temperature does not dramatically change in different configurations. This finding is
in accordance with different studies done on courtyards (Ali Toudert, 2005) (Santamouris, Papanikolaou,
Koronakis, Livada, & Asimakopoulos, 1999) (Sharmin & Steemers, 2013).
3.1.2. Mean radiant temperature analysis
The mean radiant temperature, (Tmrt) is defined as “the uniform temperature of an imaginary enclosure in
which the radiant heat transfer from the human body is equal to the radiant heat transfer in the actual
non-uniform enclosure” (ISO7726, " Ergonomics of the thermal environment - Instrument for measuring
physical quantities", 1998). Considering and analyzing Tmrt, the effects of radiation from surfaces and solar
radiation on thermal performance become evident as decisive factors regarding microclimatic conditions of
outdoor environments (Andreou, 2013) (van Esch, Looman, & de Bruin-Hordijka, 2012). Figure 9 shows
19
morning and it reaches its maximum point between 14-15 pm that is 70-75 °C. In contrast, Tmrt shows a
direct relationship with solar radiation in winter. Tmrt increases with solar radiation in early morning up to
20
21
During summer: Tmrt’s increase pattern of four-sided courtyards (Figure 9a1) is identical for all models
(1h-5h) which increases between 6 am-14 pm. Tmrt reaches its maximum value (70°C) in all models at 14
pm . During the time range of 14-17 pm, significant changes of Tmrt relatively occur in a way that models
1h, 4h and 5h experience 15 °C less than other models. Tmrt changes during the remaining hours are
inconsiderable.
There is a significant Tmrt difference among different models (6h-13h) of three-sided courtyards during time
ranges of 6 am-11 pm and 13-17 pm. Model 10h performs lowest temperature in the morning while thermal
performance of model 12h is at its lowest (lower Tmrt) in the morning and afternoon. These changes are
mainly due to solar radiation blocking in comparison to the other models. Model 12h is a two-story building,
its north-south position blocks solar radiation and makes it a suitable model with relatively acceptable
thermal behavior. However, model 10h is facing west which makes it unable to block western and
south-western solar radiations between 13-17 pm and reduces its desirable thermal performance in contrast to
early morning. Models 6h and 8h inability to block solar radiation in the morning, its Tmrt is higher between
6 am-11 pm.
It is evident from Figure 7a3 that the pattern of Tmrt changes in two-sided courtyards is very similar to
changes pattern of three-sided courtyards. Considering this set of models (14h-18h), models 16h and 17h
experience a lower rate of Tmrt in contrast to the other models between time ranges of 6 -11 am and 13-17
pm. However, performance of models 14h and 15h is satisfactory in the morning whereas its rate of Tmrt
increases as time passes which is mainly due to their inability of solar radiation blocking. Theoretical model
of 19h is exposed to vast amount solar radiations and its Tmrt is 76 °C at 3 pm.
During winter: Figure 9b1-4 show all models (1c-19c) approximately follow an identical pattern of Tmrt
changes in winter. However, there are significant changes in Tmrt of some models between 8 am-15 pm.
The thermal performance of models 3c, 4c and 5c during 9 am-15 pm is most desirable (higher Tmrt)
22
Models 6c,8c,11c and 12c (Figure 7b2) are the three-sided courtyards which perform better in the time range
of 8 am-15 pm. Analyzing two-sided courtyards in Figure 9b3, models 15c and 16c show greater rate of Tmrt
in comparison to the other models. Although model 19c thermal behavior is not desirable in summer, its
performance in winter is suitable and better than most models. Calculating Tmrt of different configurations
in summer and winter show that models 4,5,12 and 16’s thermal performance is desirable during both
seasons.
3.1.3. PMV distribution
The PMV distribution analysis are only considered at 4 pm in summer and 9 am in winter since there are
many models and figures which describe the PMV distribution. This time frame is chosen for analysis
purposes of PMV distribution rate since higher occupy frequency of occupants in their courtyards. Also
4pm in summer and 9am in winter are the most uncomfortable periods to use the courtyards. The simulated
results of models at 4 pm are shown in Figure 10 below for better understanding of this subject. The
maximum temperature is at 4 pm, and none of the models provides the satisfactory thermal comfort (i.e. +2
to -2). Although, models 12h, 13h, 16h, 17h and 18h perform better in contrast to the other models since
their PMV is lower. The PMV of models 2h, 3h, 7h, 10h, 11h and 19h is higher (above +4) and portray an
undesirable outcome.
Analysis of different configurations at 9 am in winter proves the importance of shadowing in PMV
deduction in courtyards (Figure 11). The PMV rate of areas with shadow is about -4 whereas the exposed
parts of courtyards are more desirable in terms of thermal comfort. However, all models fail to perform up
to the standard level of (-2 to +2) in terms of the spatial PMV distribution. It can be concluded that any
configuration with a larger area exposed to direct solar radiation in the morning, for example model 19h
23
24
Figure11. The distribution of PMV in courtyards at 9am in cold days of winter.
3.1.4. UTCI
During summer: Figure 12 indicates level of UTCI in different courtyard configurations. It is evident that
all models experience the desired thermal comfort (18-26°C) for a few hours of the day (between 7-9 am
27
Figure12. UTCI Level during summer (a) and winter (b) in 4-sided (a1, b1), 3-sided (a2, b2), 2-sided (a3, b3) and 1-sided (a4, b4) courtyard models.
UTCI level of all four-sided configurations (1h-5h) is within thermal comfort range at 8 am and it gradually
increases to its maximum point that is 41 C at 14 pm. UTCI is not satisfactory at 16 pm in models 2h and
3h in comparison to other models such as 1h, 4h and 5h even though, none of them are within the thermal
comfort range. All models experience thermal comfort between 19-23 pm. The UTCI changes pattern of
all three-sided (6h-13h) and two sided (14h-18h) models are almost identical. All models enjoy thermal
comfort between 7-8 am and 19-23 pm. However, model 12h has a lower rate of UTCI between 13-17 pm,
knowing all of three-sided models are not in the thermal comfort zone. Models 6h, 7h and 8h perform
poorly in those hours. Two-sided models of 16h and 17h thermally perform better between 6-10 am and
13-17 pm. All models, with the exception of 18h, are in the comfort zone between 8-9 am. All models
experience thermal comfort at night. The results of model 19h is not satisfactory, in Figure 12a3.
During winter, all models follow an almost identical pattern of UTCI change during winter. Figure 12b1
shows UTCI graph of four-sided models (1c-5c). Models 3c, 4c and 5c are in comfort zone between 11
am-13 pm while other models are not in that zone. Analyzing three-sided courtyards, all models are not in the
comfort zone at 11 am-13 pm with the exception of 6c, 8c, 11c, and 12c, Figure 12b2. According to Figure
12b3, none of two-sided models experience thermal comfort at any time. However, models 15c and 16c
perform slightly better around 11 am-13 pm in contrast to other models. Model 19c has the highest rate of
Tmrt as well as duration of thermal comfort from 11am to 14 pm. In general, discussing level of UTCI shows
that models 4,5,12 and 16 have the most desirable thermal performance in both seasons.
3.2. Phase 2
Figure 13 shows the daily average of UTCI in all models during summer and winter. However, some models
perform better in one season or another in comparison to other models. Considering the thermal
28
thermal performance in summer and winter. Therefore, model 12 is selected as the base model for phase 2
[image:29.612.78.539.165.285.2]investigation.
Figure 13. A comparison of the daily UTCI in all models during summer (right) and winter (left).
3.2.1. Orientation and Height to Width Ratio
The effects of change in orientation and height to width ratio (H/W) of the base model as the most important
geometrical factors on microclimatic conditions are discussed in this section. The southward base model is
analyzed in 3 different orientations (northward, eastward and westward) as well as 4 different aspect ratio
of 1/1 (height 8 and width 8), 1/2 (height 8 and width 16), 1/3 (height 8 and width 24), 2/1 (height 16 and
width 8) and 3/1 (height 24 and width 8), Figure 14. These aspect ratios are selected based on standard
ratios in buildings.
Figure 14. Height to width ratio (H/W) of the modified courtyard models.
Calculating daily Tmrt reveals that deep model’s thermal performance is better during different orientations
and hours of the day in summer. The deep models have a lower rate of Tmrt, specially around necessary
[image:29.612.73.546.522.597.2]29
the H/W ratio decreases, as it is more exposed to solar radiations. However, Tmrt level of northward
30
31
In contrast, Tmrt of deep models are slightly higher (about 1-3 °C) in comparison to those with lower H/W
ratio that is due to increase of solar radiation exposure as well as decrease wind speed (Figure 16). In
westward and eastward configurations, courtyards with H/W ratio of 1:3 experience significant increase of
Tmrt between 10am-16pm and 8am-14pm respectively, due to direct exposure of sunlight. All other aspect
ratios follow an identical pattern and Tmrt value in the other hours. The southward configuration experiences
a significant change of Tmrt between 8am-16pm in comparison to the other configurations. In fact, as the
H/W ratio increases, the level of Tmrt decreases between those hours. Considering deep models in the other
hours, Tmrt is about 2 °C higher. The results show that the most effective factors in summer are Tmrt and
wind speed respectively. The obtained results regarding the UTCI level in summer, show that the decreased
wind speed in in deeper courtyards (H/W: 2.1-3.1) affect, even slightly, the overall thermal comfort of these
32
Figure 8 Average Wind speed during summer and winter in Facing North, South, East and West courtyard models. Considering the changes of UTCI level of northward and southward orientations in summer, all models
follow an identical pattern. They are only in the thermal comfort zone between 6am-9am and 20pm-23pm
(Figure 17). During the discomfort hours of 10am-19pm, models with highest H/W ratio have a lower UTCI
in comparison to the other models. For instance, at the temperature peak (16 pm), UTCI is about 8 C lesser
than 1:3 model. The southward orientation experiences a higher rate of discomfort during most of the day.
However, the deep models of this orientation have a higher rate of UTCI between 7am-12pm while this
rate is lesser between 1pm-5pm. All the westward models perform identically, with the exception of deep
33
The obtained results of UTCI in winter show that deep courtyards in comparison to wider models have a
higher rate of UTCI even in hours when direct radiation is absent. Comparing these graphs to the given
wind speed and Tmrt, it could be concluded that deep courtyards have greater potentials in providing better
35
Figure 9 A comparison of the effects of different orientations on UTCI in modified models with different H/W ratio. In addition, statistical analysis provides a better understanding using multiple linear regression analysis in
regards to determining the effects of UTCI-dependent variables of humidity, wind speed, Tmrt and air
temperature in summer and winter. First, Kolmogorov- Smirnov statistical test is used with the dependent
variable (UTCI) to check the possibility of using multiple linear regression. The obtained results are
thoroughly shown in Table 6. Based on the P-Value during both summer and winter that is 0.52 and 0.73
respectively, the normality hypothesis of dependent variable is not rejected. After the normality
confirmation of dependent variable, the independent variables of air temperature, relative humidity, wind
speed and radiation temperature are individually tested during summer and winter in order to obtain a
regression model for a significant level of a = 0.05(sig.). Therefore, Eq.1 shows the regression model in
summer and Eq.2 shows the regression model in winter.
UTCI = -14.221 + (1.449* Mean Radiant temperature) + (.070 * Air temperature) + (-1.074 * Wind
speed) + (-.113 * Relative humidity) (Eq. 1)
UTCI = 7.924+ (.464* Mean Radiant temperature) + (.015 *Air temperature) + (-.983* Wind speed)
+ (-.016* Relative humidity) (Eq. 2)
Table 6. Normality test of the dependent variable (UTCI).
During summer During winter
Kormogorov-smirnov Kormogorov-smirnov
Statistical P-value Statistical P-value
.444 .528 .704 .732
Considering Table 7, it is evident that the independent variables are able to anticipate the effective factors
on UTCI during summer and winter that are 95% (R2=0.95) and 99% (R2=0.99) respectively. The obtained
statistical results confirm the effects of these variables. However, when these variables simultaneously
affect and act in both summer and winter, only Tmrt and wind speed are of significance in regards to the
36
Table 7 indicates effects of each variable. It could be concluded that, significant factors regarding changes
of UTCI in terms of statistical analysis in summer and winter are Tmrt and wind speed. This finding
statistically show that these variables play an important role in determining thermal comfort. The most
influential factor in summer and winter are mean radiant temperature and wind speed respectively
[image:37.612.74.541.225.397.2](according to the amount of beta in Table 7).
Table 5. Regression coefficients in summer and winter.
Summer Winter
Model Standardized Coefficients
Sig.
Beta
(Constant) .132
Air temperature .070 .429
Tmrt 1.449 .000
Wind speed -1.074 .000
Relative humidity
-.113 .093
R2 =.958
a. Dependent Variable: UTCI
Model Standardized
Coefficients
Sig.
Beta
(Constant) .034
Air temperature .015 .296
Tmrt .464 .000
Wind speed -.983 .000
Relative humidity
-.016 .202
R2 =.998
a. Dependent Variable: UTCI
In general, considering the average value of UTCI during the investigated hours in winter, it can be
concluded that a model with H/W: 3/1 in directions of north, south, east and west (with the difference of 5
C, 11C, 7 C and 6 C respectively), perform better in contrast to models with lesser H/W. According the
aforementioned statement, model H/W: 3/1 thermally perform better in all directions in winter as well as
summer. However, in order to properly analyze the perfect orientation of this model, Figure 18 shows the
changes of UTCI of model H/W: 3/1 in all directions. Considering these graphs, all models are within the
thermal comfort range between the hour ranges of 6-8 and 20-23. However, outside of these ranges models
with southward and northward orientation show a lower rate of UTCI in the hour range of (9-19). Analyzing
the results of different models in winter show that the southward orientation performs significantly better
37
Figure 10 UTCI Level of Facing North, South, East and west courtyards during summer and winter in H/W: 3/1 courtyard models.
4. Conclusion
Urban microclimatic analysis helps to add onto the current knowledge regarding its thermal behavior. It
also improves the living conditions within the urban environments. There are a limited number of past
studies regarding the thermal comfort of central courtyards and the effects of geometrical parameters in
climates with hot summers and cold winters. Unlike the previous studies which only focused on one
particular courtyard, this study aimed to evaluate and categorize the central courtyard of 45 existing models
to modify and introduce a new microclimate model in hot and dry climate. This study investigated the
thermal comfort conditions of central courtyards in Shiraz, Iran. 19 courtyard models were selected after
analyzing 45 different traditional houses with central courtyards. After thorough analysis regarding the
thermal performance of all models, one model was selected as the base model. Finally, the effects of
changing the orientation and its height to width ratio of the based model is discussed.
The courtyards, if designed appropriately, could serve as a microclimatic optimizer in order to provide
thermal comfort in summer and winter. Considering the geometrical parameters at the early stages of
38
Regulating and controlling the direct solar radiation serves as the main strategy to improve thermal comfort
in summer as well as winter. The courtyard should be designed in order to reduce the amount of absorbed
solar radiation during summer while it increases this amount in winter. Controlling the wind speed also acts
as an important factor in regulating the thermal comfort in winter. In the absence of Sunlight, reducing the
wind speed is a significant approach in order to decrease the thermal stresses in the deeper models
(H/W:3/1- 2/1). Controlling the Sunlight as well as the wind speed is possible using the right design
orientation and height to width ratio.
It can also be concluded that in the studied climate, deep southward courtyards with the H/W of 3/1 then
2/1(in 3-sided models) respectively are appropriate solutions of enhancing thermal performance as they
regulate the sunlight as well as wind speed in summer and winter. The selected weather conditions of
simulation purposes are of the extreme state. Therefore, the thermal comfort of these models performs better
in reality than they showed in the simulation. It should be noted that factors like albedo of surfaces and
vegetation were kept identical.The results of this research can be analyzed for use in similar climates with
different narrower ratios from H/W values of 2.1 to 3.1 in new microclimate design. Further research should
be undertaken to evaluate the effect of vegetations and building materials in courtyards.
References
Acosta, I., Navarro, J., & Sendra, J. (2013). Predictive method of the sky component in a courtyard under overcast sky conditions. Solar Energy, 89, 89-99.
Acosta, I., Navarro, J., & Sendra, J. (2014). Lighting design in courtyards: Predictive method of daylight factors under overcast sky conditions. Renewable Energy, 71, 243-254.
Aldawoud, A. (2008). Thermal performance of courtyard buildings. Energy and Buildings, 40, 906-910. Al-Hemiddi, N., & Al-Saud, K. (2001). The effect of a ventilated interior courtyard on the thermal
performance of a house in a hot–arid region. Renewable Energy, 24, 581-595.
39
Ali-Toudert, F., & Mayer, H. (2005). Thermal Comfort in Urban Streets with Trees under Hot Summer Conditions. The 22th Conference on Passive and Low Energy Architecture. Beirut.
Ali-Toudert, F., & Mayer, H. (2006). Numerical study on the effects of aspect ratio and orientation of an urban street canyon on outdoor thermal comfort in hot anddry climate. Build. Environ, 41, 94-108.
Ali-Toudert, F., & Mayer, H. (2007). Effects of asymmetry, galleries, overhanging fac¸ades and vegetation on thermal comfort in urban street canyons. Solar Energy, 81, 742-754.
Ali-Toudert, F., & Mayer, H. (2007). Thermal comfort in an east–west oriented street canyon in Freiburg (Germany) under hot summer conditions. Theor. Appl. Climatol, 87, 223-237.
Ali-Toudert, F., Djenane, M., Bensalem, R., & Mayer, H. (2005). Outdoor thermal comfort in the old desert city of Beni-Isguen, Algeria. Climate Research, 28, 243-256.
Al-Masri, N., & Abu-Hijleh, B. (2012). Courtyard housing in midrise buildings: An environmental assessment in hot-arid climate. Renewable and Sustainable Energy Reviews, 16, 1892-1898. Almhafdy, A., Ibrahim, N., Sh Ahmad, S., & Yahya, J. (2015). Thermal Performance Analysis of Courtyards
in a Hot Humid Climate using Computational Fluid Dynamics CFD Method. Asian Conference on
Environment-Behaviour Studies. Seoul.
Alvarez, S., Sanchez, F., & Molina, J. (1998). Air flow pattern at courtyards. PLEA 98, (pp. 503-506). Andreou, E. (2013). Thermal comfort in outdoor spaces and urban canyon microclimate. Renewable
Energy, 55, 182-188.
ataland. (n.d.). Retrieved November 2016, from http://www.ataland.com/Hotel/
Berkovic, S., Yezioro, A., & Bitan, A. (2012). Study of thermal comfort in courtyards in a hot arid climate.
Solar Energy, 86, 1173-1186.
Biabani Moghadam Babolia, F., Ibrahim, N., & Mohds Sharifc, D. (2015). Design Characteristics and Adaptive Role of the Traditional Courtyard Houses in the Moderate Climate of Iran. Asian
Conference on Environment-Behaviour Studies. Tehran.
Bourbia, F., & Awbi, H. (2004a). Building cluster and shading in urban canyon for hot dry climate Part 1: Air and surface temperature measurements. Renewable Energy, 29, 249-262.
Bourbia, F., & Awbi, H. (2004b). Building cluster and shading in urban canyon for hot dry climate Part 2: Shading simulations. Renewable Energy, 29, 291-301.
Bourbia, F., & Boucheriba, F. (2010). Impact of street design on urban microclimate for semi arid climate (Constantine). Renewable Energy, 35, 343-347.
Bröde, P., Fiala, D., Blazejczyk, K., Holmér, I., Jendritzky, G., Kampmann, B., … Havenith, G. (2012). Deriving the operational procedure for the Universal Thermal Climate Index (UTCI). International Journal of Biometeorology, 56(3), 481–494. https://doi.org/10.1007/s00484-011-0454-1
40
Bruse, M., & Fleer, H. (1998). Simulating surface–plant–air interactions inside urban environments with a three dimensional numerical model. Environmental Modelling & Software, 13(3-4), 373–384. Cantón, M., Ganem, C., Barea, G., & Fernández Llano, J. (2014). Courtyards as a passive strategy in semi
dry areas. Assessment of summer energy and thermal conditions in a refurbished school building. Renewable Energy, 69, 437-446.
Chen, L., & Ng, E. (2013). Simulation of the effect of downtown greenery on thermal comfort in
subtropical climate using PET index: a case study in Hong Kong. Architectural Science Review, 56, 297–305.
Chow, W., & Brazel, A. (2011). Assessing xeriscaping as a sustainable heat island mitigation approach for a desert city. Building and Environment, 47, 170-181.
Christopoulou, V., Tsiros, I., Hoffman, M., & Tseliou, A. (2015). A Micro-Scale Field and Numerical Study forAssesing The Seasonal thermal Effects of A Vegetated Courtyard on Urban Climate. the 14th
International Conference on Environmental Science and Technology. Environmental Science and
Technology.
Coronel, J., & Alvarez, S. (2001). Experimental Work and Analysis of Confined Urban Spaces. Solar
Energy, 70, 263-273.
Documentation Center of Fars Cultural, Handicrafts & Tourism Organization. (2015). Retrieved 2015,
from http://www.farschto.ir
Emmanuel, R. (2016). Urban Climate Challenges in the Tropics: Rethinking Planning and Design Opportunities. London: Imperial College Press.
Gagge, A., Stolwijk, J., & Hardy, J. (1967). Comfort and thermal sensations and associated physiological responses at various ambient temperatures. Environmental Research, 1, 1-20.
Ghaffarianhoseini, A., Berardi, U., & Ghaffarian, A. (2015). Thermal performance characteristics of unshaded courtyards in hot and humid climates. Building and Environment, 87, 154-168.
hamgardi. (n.d.). Retrieved 2016, from http://hamgardi.com/Gallery/place/10370
Havenith, G., Fiala, D., Błazejczyk, K., Richards, M., Bröde, P., Holmér, I., . . . Jendritzky, G. (2012). The UTCI-clothing model. International Journal of Biometeorol, 56, 461–470.
Herrmann, J., & Matzarakis, A. (2012). Mean radiant temperature in idealised urban canyons—examples from Freiburg, Germany. Int J Biometeorol, 56, 199–203.
Hisarligil, H. (2013). Exploring the courtyard microclimate through an example of Anatolian Seljuk Architecture: the thirteenth-century Sahabiye Madrassa in Kayseri. Sustainability in energy and
buildings (pp. 59-69). Berlin: Springer.
41
Holst, J., Dostal, P., Imbery, F., & Mayer, H. (2009). Influence of street design on the heat perception by citizens during hot summer days. 5th japanese- German Meeting on Urban Climatology. Freiburg.
Hopkinson, R., Galbraith, R., Petherbridge, P., & Longmore, J. (1966). Daylighting. Heinemann. Höppe, P. (1999). The physiological equivalent temperature – a universal index for the
biometeorological assessment of the thermal environment. International Journal of
Biometeorol, 43, 71-75.
Houghton, F., & Yaglo, C. (1923). Determining Equal Comfort Lines. the American Society of Heating and
Ventilating Engineers, 29, 165-176.
IRIMO. (2015). (Fars meteorological bureau) Retrieved 2017, from http://www.farsmet.ir
(1998). ISO7726, " Ergonomics of the thermal environment - Instrument for measuring physical
quantities". Geneva: International Organization for Standardization.
Jendritzky, G., & Nubler, W. (1981). A model analysing the urban thermal environment in physiologically significant terms. Meteorology and Atmospheric Physics 29, 313–326.
Jendritzky, G., de Dear, R., & Havenith, G. (2012). UTCI—Why another thermal index? International
Journal of Biometeorol, 56, 421–428.
jonoubnews. (n.d.). Retrieved December 2016, from http://www.jonoubnews.ir/fa/news/204948/
Ka-Lun Lau, K., Lindberg, F., Rayner, D., & Thorsson, S. (2015). The effect of urban geometry on mean radiant temperature under future climate change: a study of three European cities. Int J
Biometeorol, 59, 799-814.
Knowles, R. (1981). Sun, Rhythm and Form. London: MIT Press.
Krüger, E., Minella, F., & Rasia, F. (2011). Impact of urban geometry on outdoor ther-mal comfort and air quality from field measurements in Curitiba, Brazil. Building and Environment, 46, 621-634. Lahme, E., & Bruse, M. (2003). Microclimatic effects of a small urban park in densely built-up areas: measurements and model simulations. the Fifth International Conference on Urban Climate. Lodz, Poland.
Landsberg, H. (1981). The urban climate (Vol. 28). New York: Academic press.
Lee, H., Holst, J., & Mayer, H. (2013). Modification of Human-Biometeorologically Significant Radiant Flux Densities by Shading as Local Method to Mitigate Heat Stress in Summer within Urban Street Canyons. Advances in Meteorology, 38, 1-13.
Lee, H., Mayer, H., & Schindler, D. (2014). Importance of 3-D radiant flux densities for outdoor human thermal comfort on clear-sky summer days in Freiburg, Southwest Germany. Meteorologische
Zeitschrift, 23, 315-330.
Lin, T., Matzarakis, A., & Hwang, R. (2010). Shading effect on long-term outdoor thermal comfort.
42
Littlefair, P., Santamouris, M., Alvarez, S., Dupagne, A., Hall, D., Teller, j., . . . Papanikolaou, n. (2001).
Environmental site layout planning: solar access, micro climate and passive cooling in urban areas. London: CRC.
Makaremi, N., Salleh, E., Jaafar, M., & Ghaffarian Hoseini, A. (2012). Thermal comfort conditions of shaded outdoor spaces in hot and humid climate of Malaysia. Build Environ, 48, 7-14.
Manioglu, G., & Koçlar Orala, G. (2015). Effect of Courtyard Shape Factor on Heating and Cooling Energy Loads in Hot-Dry Climatic Zone. IBPC. Torino,.
Mayer, H., Kuppe, S., Holst, J., & Matzarakis, A. (2009). Human thermal comfort below the canopy of street trees on a typical Central European summer day. 5th japanese- German Meeting on
Urban Climatology. Freiburg.
Meir, I., Pearlmutter, D., & Etzion, Y. (1995). On the Microclimatic Behavior of Two Semi-Enclosed Attached Courtyards in a Hot Dry Region. Building and Environment, 30, 563-572.
Memarian, G. (1998). House typology in Iran: With special reference to Shiraz, (Unpublished Ph.D.
Thesis). Manchester: The University of Manchester.
Memarian, G., & Brown, F. (2006). The shared characteristics of Iranian and Arab courtyard houses. In
Courtyard Housing: Past, Present and Future (pp. 21-30). Abingdon: Taylor and Francis.
Michael, A., Heracleous, C., Thravalou, S., & Philokyprou, M. (2017). Lighting performance of urban vernacular architecture in the East-Mediterranean area: Field study and simulation analysis.
Indoor and Built Environment, 26(4), 471-487.
Middel, A., Häb, K., Brazel, A., Martin, C., & Guhathakurta, S. (2014). Impact of urban form and design on mid-afternoon microclimate in Phoenix Local Climate Zones. Landscape and Urban Planning,
122, 16-28.
Mohsen, M. (1979a). Solar Radiation and Courtyard House Forms- I. A Mathematical Model. Building
and Environment, 14, 89-106.
Mohsen, M. (1979b). Solar Radiation and Courtyard House Forms II: Application of the Model. Building
and Environment, 14, 185-201.
Muhaisen, A. (2006). Shading simulation of the courtyard form in different climatic regions. Building and
Environment, 41, 1731–1741.
Muhaisen, A., & Gadi, M. (2006b). Effect of courtyard proportions on solar heat gain and energy requirement in the temperate climate of Rome. Building and Environment, 41, 245-253. Muhaisen, A., & Gadi, M. (2005). Mathematical model for calculating the shaded and sunlit areas in a
circular courtyard geometry," Building and Environment. Building and Environment, 40, 1619-1625.
Muhaisen, A., & Gadi, M. (2006a). Shading performance of polygonal courtyard forms. Building and
43
Nagano, K., & Horikoshi, T. (2011). New index indicating the universal and separate effects on human comfort under outdoor and non-uniform thermal conditions. Energy and Buildings, 43, 1694– 1701.
Ndetto, E., & Matzarakis, A. (2013). Effects of Urban Configuration on Human Thermal Conditions in a Typical Tropical African Coastal City. Advances in Meteorology, 12 pages.
Nikolopoulou, M. (2004). Designing Open Spaces in the Urban Environment: a Bioclimatic Approach.
CRES. Atenas.
Oke , T. (2002). Boundary layer climates. Routledge.
Pearlmutter, D., Bitan, A., & Berliner, P. (1999). Microclimatic analysis of compact urban canyons in an arid zone. Atmospheric Environment, 33, 4143-4150.
Robitu, M., Musy, M., Inard, C., & Groleau, D. (2006). Modeling the influence of vegetation and water pond on urban microclimate. Solar Energy, 80, 435–447.
Sadafi, N., Salleh, E., Chin Haw, L., & Jaafar, Z. (2011). Evaluating thermal effects of internal courtyard in a tropical terrace house by computational simulation. Energy and Buildings, 43, 887–893. Safarzadeh, H., & Bahadori, M. (2005). Passive cooling effects of courtyards. Building and Environment,
40, 89-104.
Salata, F., Golasi, I., de Lieto Vollaro, A., & de Lieto Vollaro, R. (2015). How high albedo and traditional buildings’ materials and vegetationaffect the quality of urban microclimate. A case study. Energy
and Buildings, 99, 32-49.
Saljoughinejad, S., & Rashidi Sharifabad, S. (2015). Classification of climatic strategies, used in Iranian vernacular residences based on spatial constituent elements. Building and Environment 92, 92, 475-493.
Santamouris, M., Papanikolaou, N., Koronakis, I., Livada, I., & Asimakopoulos, D. (1999). Thermal and air Flow characteristics in a deep pedestrian canyon under hot weather conditions. Atmospheric
Environment, 33, 4503-4521.
Shao, L., Walker, R., & Woolliscroft, M. (1993). Natural ventilation via courtyards: the application of CFD.
14th AIVC Conference. Copenhagen.
Sharmin, T., & Steemers, K. (2013). Effect of Canyon Geometry on Outdoor Thermal Comfort: A case-study of high-density, warm-humid climate. 29th Conference, Sustainable Architecture for a
Renewable Future. Munich.
Sharples, S., & Bensalem, R. (2001). Airflow in Courtyard and Atrium Buildings in The Urban Environment: A Wind Tunnel Study. Solar Energy, 70, 237–244.
Shashua-Bar, L., Pearlmutter, D., & Erell, E. (2009). Microscale vegetation effects on outdoor thermalcomfort in a hot-arid environment. The seventh International Conference on Urban
44
Soflaei, F., Shokouhian, M., & Mofidi Shemirani, S. (2016). Investigation of Iranian traditional courtyard as passive cooling strategy (a field study on BS climate). International Journal of Sustainable Built
Environment, 5(1), 99-113.
Steemers, K. (2003). Cities, energy and comfort: a PLEA 2000 review. Energy and Buildings, 35(1). Taleb, D., & Abu-Hijleh, B. (2013). Urban heat islands: Potential effect of organic and structured urban
configurations on temperature variations in Dubai, UAE. Renewable Energy, 50, 747-762. Taleghani, M., Kleerekoper, L., Tenpierik, M., & van den Dobbelsteen, A. (2015). Outdoor thermal
comfort within five different urban forms in the Netherlands. Building and Environment, 83, 65-78.
Taleghani, M., Sailor, D., Tenpierik, M., & van den Dobbelsteen, A. (2014). Thermal assessment of heat mitigation strategies: The case of Portland State University, Oregon, USA. Building and
Environment, 73, 138-150.
Taleghani, M., Tenpierik, M., & van den Dobbelst, A. (2012). Environmental impact of courtyards-a review and comparison of residential courtyard buildings in different climates. Green Building,
7(2), 113-136.
Taleghani, M., Tenpierik, M., & van den Dobbelst, A. (2014). Energy performance and thermal comfort of courtyard/atrium dwellings in the Netherlands in the light of climate change. Renewable Energy,
63, 486-497.
Taleghani, M., Tenpierik, M., van den Dobbelsteen, A., & de Dearb, R. (2013). Energy use impact of and thermal comfort in different urban block types in the Netherlands. Energy and Buildings, 67, 166-175.
Taleghani, M., Tenpierik, M., van den Dobbelsteen, A., & sailor, D. (2014). Heat mitigation strategies in winter and summer: Field measurements in temperate climates. Building and Environment, 81, 309-319.
Taleghani, M., Tenpierik, M., van den Dobbelsteen, A., & Sailor, J. (2014). Heat in courtyards: A validated and calibrated parametric study of heat mitigation strategies for urban courtyards in the
Netherlands. Solar Energy, 103, 108–124.
Thapar, H., & Yannas, S. (2008). Microclimate and Urban Form in Dubai. 25th Conference on Passive and
Low Energy Architecture. Dublin.
Thapar, H., & Yannas, S. (2008). Microclimate and Urban Form in Dubai. 25th Conference on Passive and
Low Energy Architecture. Dublin.
Thorsson, S., Lindberg, F., Bjorklund, J., & Rayner, D. (2011). Potential changes in outdoor thermal comfort conditions in Gothenburg, Sweden due to climate change: The influence of urban geometry. International Journal of Climatology, 31, 324-335.
UTCI. (2015). Retrieved 2017, from http://utci.org