The comparison of normative reference
data from different gait analysis services
Pinzone, O, Schwartz, MH, Thomason, P and Baker, RJ
http://dx.doi.org/10.1016/j.gaitpost.2014.03.185
Title
The comparison of normative reference data from different gait analysis
services
Authors
Pinzone, O, Schwartz, MH, Thomason, P and Baker, RJ
Type
Article
URL
This version is available at: http://usir.salford.ac.uk/32359/
Published Date
2014
USIR is a digital collection of the research output of the University of Salford. Where copyright
permits, full text material held in the repository is made freely available online and can be read,
downloaded and copied for noncommercial private study or research purposes. Please check the
manuscript for any further copyright restrictions.
Elsevier Editorial System(tm) for Gait and Posture Manuscript Draft
Manuscript Number: GAIPOS-D-13-00696R1
Title: The comparison of normative reference data from different gait analysis services Article Type: Original Paper
Keywords: Kinematics; Kinetics; Normative-Datasets Comparison; Standardization between Services. Corresponding Author: Mrs. Ornella Rita Pinzone, MSc
Corresponding Author's Institution: University of Salford First Author: Ornella Rita Pinzone, MSc
Order of Authors: Ornella Rita Pinzone, MSc; Michael H Schwartz, PhD; Pam Thomason, B Phty, M Physio; Richard Baker, PhD CEng CSci
Abstract: Comparison of normative data between gait analysis services offers the potential to
harmonise data collection protocols. This paper presents a method for such a comparison based on an assumption that the root mean square difference from the inter-service mean is a reflection of
systematic differences in protocols and that the average standard deviation includes a component attributable to within-centre measurement variability.
Substantial normative datasets from two highly respected clinical services were compared. The RMS difference for the difference from the inter-centre mean was less than 1.7° for all kinematic variables apart from hip rotation (2.9°) and foot progression (2.1°), less than 0.1Nm/kg for all joint moments and than 0.21W/kg for all joint powers. The two centres showed very similar normative standard deviations.
THE COMPARISON OF NORMATIVE REFERENCE DATA FROM DIFFERENT GAIT
ANALYSIS SERVICES
Ornella Pinzone1, Michael H. Schwartz2,3, Pam Thomason4 , Richard Baker1 1University of Salford, UK
2Gillette Children’s Specialty Healthcare, St. Paul, MN, USA, 3University of Minnesota, Minneapolis, MN, USA,
1 2 3 4 5 6 7 8 9 10 11 12 13 14 15 16 17 18 19 20 21 22 23 24 25 26 27 28 29 30 31 32 33 34 35 36 37 38 39 40 41 42 43 44 45 46 47 48 49 50 51 52 53 54 55 56 57 58 59 60 61 62 ABSTRACT
Comparison of normative data between gait analysis services offers the potential to harmonise
data collection protocols. This paper presents a method for such a comparison based on an
assumption that the root mean square difference from the inter-service mean is a reflection of
systematic differences in protocols and that the average standard deviation includes a
component attributable to within-centre measurement variability.
Substantial normative datasets from two highly respected clinical services were compared.
The RMS difference for the difference from the inter-centre mean was less than 1.7° for all
kinematic variables apart from hip rotation (2.9°) and foot progression (2.1°), less than
0.1Nm/kg for all joint moments and than 0.21W/kg for all joint powers. The two centres
showed very similar normative standard deviations.
The data demonstrates a high degree of consistency between data from two highly regarded
gait analysis services and establishes a baseline against which other services can assess their
performance. An electronic appendix includes data to facilitate this comparison. *5. Manuscript
3 4 5 6 7 8 9 10 11 12 13 14 15 16 17 18 19 20 21 22 23 24 25 26 27 28 29 30 31 32 33 34 35 36 37 38 39 40 41 42 43 44 45 46 47 48 49 50 51 52 53 54 55 56 57 58 59 60 61 62 1. INTRODUCTION
In the past it has been considered acceptable for clinical gait analysis services to vary in their
data capture protocols and reference datasets were collected to allow for these differences
[1-3]. As the clinical gait analysis matures, there is a growing requirement for standardization
between services [4, 5]. This has been underlined by two articles [6, 7] emphasising the
differences between laboratories in 3d gait analysis data, raising concern within the
orthopaedic community [8, 9]. The rationale for collecting reference datasets in the future
should thus be to harmonise protocols through comparison between different services. This
study describes a mechanism for such a comparison and illustrates this by comparing data
from two internationally regarded gait analysis services.
2. MATERIALS and METHODS
The normative reference data (means and standard deviations) in routine use at two gait
analysis services, (Gillette Children’s Specialty Healthcare, GCSH, and the Royal Children’s
Hospital, Melbourne, RCH) were compared. The normative reference data were created using
data from 81 patients, with an age range between 4 and 17 years at one centre, and 31
patients, with age between 6 and 17 years at the other centre. All data had been collected at
self-selected walking speed, with a Vicon kinematic measuring system (Oxford, UK) and
AMTI force plates (Watertown, MA, USA). The length of the walkways were respectively 8
m and 15 m. Knee Alignment Devices (KAD) were used in static calibration. Trajectories had
been filtered with a Woltring spline filter [10] and then processed using Plug-in Gait [11]
software (Vicon, Oxford, UK). Data were sampled to 51 values during the gait cycle;
however there is no particular reason to believe this method would be sensitive to this value.
Means (, i refers to service, j to gait variable and t to % of gait cycle) and standard
1 2 3 4 5 6 7 8 9 10 11 12 13 14 15 16 17 18 19 20 21 22 23 24 25 26 27 28 29 30 31 32 33 34 35 36 37 38 39 40 41 42 43 44 45 46 47 48 49 50 51 52 53 54 55 56 57 58 59 60 61 62
analysis services were plotted together to visualize the level of agreement (Error! Reference source not found. and Error! Reference source not found.). Assuming that the two cohorts walked similarly, then differences in the mean measurements reflect systematic differences in
measurement technique between the two centres. Although comparing one mean to the other
appears an obvious choice for comparisons, each service is interested not in how it compares
with the other, but how it compares with the true mean for the population. Given that there is
no reason to suspect that one set of measurements is “better” than the other, the grand mean
between the services () is actually the best estimate of the true mean. Given that
differences in technique are likely to be characteristic of the service rather than the
participants, a simple mean was preferred to a mean weighted by number of participants.
1
Where N is the number of services (2 in this case).
Systematic differences were then quantified by considering the difference between the mean
for each service and the grand mean ∆ . This approach has the advantage that
the method can be extended to the comparison of any number of services.
Three parameters are assumed to be of interest: RMS∆, mean∆, and SD∆.
∆ ∆1
3 4 5 6 7 8 9 10 11 12 13 14 15 16 17 18 19 20 21 22 23 24 25 26 27 28 29 30 31 32 33 34 35 36 37 38 39 40 41 42 43 44 45 46 47 48 49 50 51 52 53 54 55 56 57 58 59 60 61 62
∆1 ∆
∆ ∆1 ∆
Where n is the number of time points across the gait cycle. The absolute maximum value of
∆ was also calculated. If only two services are being compared ∆ ∆ by definition,
and only one set of results need to be reported. (Note also that RMS∆ mean∆% SD∆).
The offset percentage (OP, with 100 ∙)*+∆-./∆,, ) was also calculated for kinematic
parameters and represents the proportion of the mean square that arises from the fixed offset.
This is useful because high values of OP will tend to indicate the direct effect of differences
in protocols for the placement of markers on segments adjacent to the joint and in the plane
the angle is measured in [4]. Low values will tend to indicate secondary effects of more
distant markers or in a different plane. This distinction may be useful in investigating and
correcting the source of discrepancies.
The standard deviations () represent the variability of measurement at each centre. They
tend to be relatively constant over the gait cycle and the average value is thus taken as the
representative measure for each variable. This is a combination of physiological variability
and measurement error and the smaller this value, the more consistently a specific protocol
has been applied. These values from different services are meaningful in this context in their
own right (as opposed to the means , which are only meaningful in this context when
1 2 3 4 5 6 7 8 9 10 11 12 13 14 15 16 17 18 19 20 21 22 23 24 25 26 27 28 29 30 31 32 33 34 35 36 37 38 39 40 41 42 43 44 45 46 47 48 49 50 51 52 53 54 55 56 57 58 59 60 61 62 3. RESULTS
There were no statistically significant differences between body mass, height and leg length at
the two centres. There were differences in absolute walking speed (p<0.0001) with patients
from centre 2 walking 10% faster on average than patients from centre 1.
A qualitative analysis of the kinematics graphs (Error! Reference source not found.) shows that agreement is generally good. There are small differences in pelvic rotation, hip flexion
and knee flexion with slightly larger differences in internal hip rotation, ankle dorsiflexion
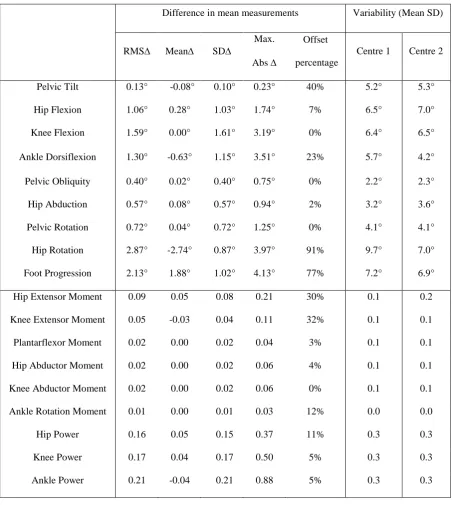
and foot progression during swing. The statistical parameters (Table 1) reflect these with the
largest differences (RMS∆) of between 2° and 3° in hip rotation and foot progression. Kinetic
data also show generally good agreement, but detailed scrutiny suggests some differences in
hip and knee extensor moment data and all the power graphs.
4. DISCUSSION and CONCLUSIONS
This paper describes a quantitative method for comparing normative datasets for different gait
analysis services. This has been illustrated with the comparison of two datasets but the
method can be extended to as many datasets as desired. Differences are generally small with
only two kinematic parameters having an RMS∆ above 2° which McGinley et al. [5]
suggested as acceptable (although four parameters showed maximum differences of greater
than 2°).
From Table 1, it can be seen that the two variables showing the largest offsets, hip rotation
and foot progression, also show a large offset percentage suggesting a simple difference in
marker placement protocol. Hip rotation is known to be highly dependent on the placement of
knee alignment devices [12, 13], foot progression will be dependent on the alignment of
3 4 5 6 7 8 9 10 11 12 13 14 15 16 17 18 19 20 21 22 23 24 25 26 27 28 29 30 31 32 33 34 35 36 37 38 39 40 41 42 43 44 45 46 47 48 49 50 51 52 53 54 55 56 57 58 59 60 61 62
is incorporated into the calculation of kinetic variables is considerably more complex than for
the kinematic data and none of the offset percentages is particularly high. It is probable that
the offset percentage will be less useful in explaining the source of discrepancies between
datasets for the kinetic data as for the kinematic data.
The main limitation of the method is that it assumes that characteristics of the two reference
cohorts are similar and that differences reflect measurement technique. The age, weight,
height and gender match of both samples is good and factors such as socio-economic and
ethnic background (mainly Caucasian) are likely to be similar. There is some evidence of
differences in temporal and spatial parameters between specific ethnic groups [14] and this
should be considered as an additional source of variation if very different groups are being
compared.
There are differences in speed between the two cohorts and the small differences in pelvic
rotation, hip and knee dorsiflexion appear to be consistent with the speed related changes
reported by Schwartz et al. [15]. These differences are small though (in comparison to the
overall standard deviations) and controlling for speed is probably not required. There are also
small differences in timing events between the two approaches. This is likely to have a small
effect on the overall results, leading to a small overestimate in the true variability.
Differences in the standard deviations between the services are generally small. Whilst this is
reassuring, the way in which the physiological variability (0) and measurement variability
() combine to produce the overall variability ( 10% ) means that this measure will
be relatively insensitive to changes in measurement variability that are equal to or less than
the physiological variability. Specific studies [e.g. 16] are required to give confidence that
1 2 3 4 5 6 7 8 9 10 11 12 13 14 15 16 17 18 19 20 21 22 23 24 25 26 27 28 29 30 31 32 33 34 35 36 37 38 39 40 41 42 43 44 45 46 47 48 49 50 51 52 53 54 55 56 57 58 59 60 61 62
The means and standard deviations of the two centres and the characteristics of the two
reference cohorts are lodged as an electronic appendix allowing any centre to compare its
3 4 5 6 7 8 9 10 11 12 13 14 15 16 17 18 19 20 21 22 23 24 25 26 27 28 29 30 31 32 33 34 35 36 37 38 39 40 41 42 43 44 45 46 47 48 49 50 51 52 53 54 55 56 57 58 59 60 61 62
1. Chester VL, Tingley M, and Biden EN, Comparison of two normative paediatric gait
databases. Dynamic medicine : DM, 2007;6:8.
2. Kadaba MP, Ramakrishnan HK, Wootten ME, Gainey J, Gorton G, and Cochran GV,
Repeatability of kinematic, kinetic, and electromyographic data in normal adult gait. J Orthop
Res, 1989;7:849-860.
3. Ounpuu O, Davis R, and Deluca P, Joint kinetics: Methods, interpretation and treatment
decision-making in children with cerebral palsy and myelomeningocele. Gait and Posture,
1996;4:62-78.
4. Baker R, Measuring Walking: A Handbook of Clinical Gait Analysis. London: Mac Keith Press;
2013
5. McGinley JL, Baker R, Wolfe R, and Morris ME, The reliability of three-dimensional kinematic
gait measurements: A systematic review. Gait & Posture, 2009;29:360-369.
6. Gorton GE, 3rd, Hebert DA, and Gannotti ME, Assessment of the kinematic variability among
12 motion analysis laboratories. Gait Posture, 2009;29:398-402.
7. Noonan K HS, Browne R, O’Brien S, Kayes K, Feinberg J., Inter-observer variability of gait
analysis in patients with cerebral palsy. . Journal of Pediatric Orthopaedics 2003;23:279–287.
8. JG W, Pro: interobserver variability of gait analysis. Journal of Pediatric Orthopaedics,
2003;23:288-289.
9. JR. G, Con: interobserver variability of gait analysis. Journal of Pediatric Orthopaedics,
2003;23:290–291.
10. Woltring HJ, On optimal smoothing and derivative estimation from noisy displacment data in
biomechanics. Human Movement Science, 1985;4:229-245.
11. Davis RB, Ounpuu S, Tyburski D, and Gage J, A gait analysis data collection and reduction
technique. Human Movement Science, 1991;10:575-587.
12. Schwartz MH and Rozumalski A, A new method for estimating joint parameters from motion
data. Journal of Biomechanics, 2005;38:107-116.
13. Baker R, Finney L, and Orr J, A new approach to determine the hip rotations profile from
clinical gait analysis data. Human Movement Science, 1999;18:655-667.
14. Al-Obaidi S, Wall JC, Al-Yaqoub A, and Al-Ghanim M, Basic gait parameters: a comparison of
reference data for normal subjects 20 to 29 years of age from Kuwait and Scandinavia. J
Rehabil Res Dev;40:361-366.
15. Schwartz MH, Rozumalski A, and Trost JP, The effect of walking speed on the gait of typically
developing children. Journal of Biomechanics, 2008;41:1639-1650.
16. Schwartz MH, Trost JP, and Wervey RA, Measurement and management of errors in
Table 1: Summary data describing how data from one centre differs from combined data (kinematic data
in degrees, moments in N-m/kg and powers in W/kg).
Difference in mean measurements Variability (Mean SD)
RMS Mean SD
Max.
Abs
Offset
percentage
Centre 1 Centre 2
Pelvic Tilt 0.13° -0.08° 0.10° 0.23° 40% 5.2° 5.3°
Hip Flexion 1.06° 0.28° 1.03° 1.74° 7% 6.5° 7.0°
Knee Flexion 1.59° 0.00° 1.61° 3.19° 0% 6.4° 6.5°
Ankle Dorsiflexion 1.30° -0.63° 1.15° 3.51° 23% 5.7° 4.2°
Pelvic Obliquity 0.40° 0.02° 0.40° 0.75° 0% 2.2° 2.3°
Hip Abduction 0.57° 0.08° 0.57° 0.94° 2% 3.2° 3.6°
Pelvic Rotation 0.72° 0.04° 0.72° 1.25° 0% 4.1° 4.1°
Hip Rotation 2.87° -2.74° 0.87° 3.97° 91% 9.7° 7.0°
Foot Progression 2.13° 1.88° 1.02° 4.13° 77% 7.2° 6.9°
Hip Extensor Moment 0.09 0.05 0.08 0.21 30% 0.1 0.2
Knee Extensor Moment 0.05 -0.03 0.04 0.11 32% 0.1 0.1
Plantarflexor Moment 0.02 0.00 0.02 0.04 3% 0.1 0.1
Hip Abductor Moment 0.02 0.00 0.02 0.06 4% 0.1 0.1
Knee Abductor Moment 0.02 0.00 0.02 0.06 0% 0.1 0.1
Ankle Rotation Moment 0.01 0.00 0.01 0.03 12% 0.0 0.0
Hip Power 0.16 0.05 0.15 0.37 11% 0.3 0.3
Knee Power 0.17 0.04 0.17 0.50 5% 0.3 0.3
Ankle Power 0.21 -0.04 0.21 0.88 5% 0.3 0.3
Fig. 1: Mean and standard deviations between GCSH (grey) and RCH (black). Kinematics normative
reference data.
Fig. 2: Mean and standard deviations between GCSH (grey) and RCH (black). Kinetics normative
8. Supplementary Material