cell derived BMP2
lineage cells: an insight into mesodermal
patterning
Michael Xavier Doss
*
, Shuhua Chen
*
, Johannes Winkler
*
, Rita
Hippler-Altenburg
*
, Margareta Odenthal
†
, Claudia Wickenhauser
†
,
Sridevi Balaraman
†
, Herbert Schulz
‡
, Oliver Hummel
‡
, Norbert Hübner
‡
,
Nandini Ghosh-Choudhury
§
, Isaia Sotiriadou
*
, Jürgen Hescheler
*
and
Agapios Sachinidis
*
Addresses: *Institute of Neurophysiology, University of Cologne, Robert-Koch Str. 39, 50931 Cologne, Germany. †Institute of Pathology, University of Cologne, Joseph-Stelzmann-Str. 9, 50931 Cologne, Germany. ‡Max-Delbrueck-Center for Molecular Medicine - MDC, Robert-Rössle Str. 10, 13092 Berlin, Germany. §Department of Pathology, The University of Texas Health Science Center at San Antonio, TX 78229, USA.
Correspondence: Agapios Sachinidis. Email: [email protected]
© 2007 Doss et al.; licensee BioMed Central Ltd.
This is an open access article distributed under the terms of the Creative Commons Attribution License (http://creativecommons.org/licenses/by/2.0), which permits unrestricted use, distribution, and reproduction in any medium, provided the original work is properly cited.
Transcriptome and phenotype of BMP2+ cells
<p>Transcriptome analysis of BMP2<sup>+ </sup>cells in comparison to the undifferentiated BMP2 ES cells and the control population from 7-day old embryoid bodies led to the identification of 479 specifically upregulated and 193 downregulated transcripts.</p>
Abstract
Background: Bone morphogenetic protein (BMP)2 is a late mesodermal marker expressed during vertebrate
development and plays a crucial role in early embryonic development. The nature of the BMP2-expressing cells during the early stages of embryonic development, their transcriptome and cell phenotypes developed from these cells have not yet been characterized.
Results: We generated a transgenic BMP2 embryonic stem (ES) cell lineage expressing both puromycin
acetyltransferase and enhanced green fluorescent protein (EGFP) driven by the BMP2 promoter. Puromycin resistant and EGFP positive BMP2+ cells with a purity of over 93% were isolated. Complete transcriptome analysis
of BMP2+ cells in comparison to the undifferentiated ES cells and the control population from seven-day-old
embryoid bodies (EBs; intersection of genes differentially expressed between undifferentiated ES cells and BMP2+
EBs as well as differentially expressed between seven-day-old control EBs and BMP2+ EBs by t-test, p < 0.01, fold
change >2) by microarray analysis led to identification of 479 specifically upregulated and 193 downregulated transcripts. Transcription factors, apoptosis promoting factors and other signaling molecules involved in early embryonic development are mainly upregulated in BMP2+ cells. Long-term differentiation of the BMP2+ cells
resulted in neural crest stem cells (NCSCs), smooth muscle cells, epithelial-like cells, neuronal-like cells, osteoblasts and monocytes. Interestingly, development of cardiomyocytes from the BMP2+ cells requires
secondary EB formation.
Conclusion: This is the first study to identify the complete transcriptome of BMP2+ cells and cell phenotypes
from a mesodermal origin, thus offering an insight into the role of BMP2+ cells during embryonic developmental
processes in vivo.
Published: 4 September 2007
Genome Biology 2007, 8:R184 (doi:10.1186/gb-2007-8-9-r184)
Received: 11 December 2006 Revised: 30 May 2007 Accepted: 4 September 2007 The electronic version of this article is the complete one and can be
Background
Bone morphogenetic protein (BMP)2 is a member of the transforming growth factor (TGF)-β superfamily and plays a crucial role in early embryonic patterning as shown by gene ablation studies [1,2]. It is normally expressed in lateral plate mesoderm and extraembryonic mesoderm [1,3]. BMP2+ mes-odermal cells at this stage comprise a subset of mesoderm, the lateral plate cardiogenic mesoderm [4]. BMP2 expression immediately follows the transient expression of T-Brachyury in the nascent mesoderm. Interestingly, administration of soluble BMP2 to chick embryo explant cultures induces full cardiac differentiation in stage 5-7 anterior medial meso-derm, a tissue that is normally not cardiogenic [5].
Since BMP2 is a cardiogenic factor as well as expressed in the cardiogenic mesoderm, it is highly imperative to investigate the molecular nature and phenotype of the mesodermal cells expressing BMP2 during the early stages of development in the context of cardiomyogenesis. Also, it has been well docu-mented that BMP2 is a potent apoptotic inducer and a potent neurotrophic factor, acting on target cells in a concentration gradient-dependant manner, mostly through its paracrine mode of action [6-8]. Thus, BMP2 plays a pivotal role not only during cardiomyogenesis but also during other early embry-onic patterning and lineage specification. To date, the molec-ular nature and phenotype of the mesodermal cells expressing BMP2 during the early stages of development have not been characterized, leaving a gap in our understand-ing of their molecular interactions with target cells and, thus, their role during early embryonic patterning and cell lineage commitment. This is due, in part, to the pleiotrophic effects of BMP2 and largely because of the practical difficulty in isolat-ing pure early stage BMP2-expressisolat-ing cells in sufficient quan-tities during early embryonic development in vivo. Extensive investigations applying the in vitro embryonic stem (ES) cell-based developmental model in the past two decades have proven its value for the elucidation of developmental proc-esses during embryonic development, in particular, the mechanisms by which lineage commitment occurs during early embryogenesis [9].
To circumvent the practical difficulties in the isolation of BMP2-expressing cells in sufficient quantities during embry-onic development in vivo, and to address the molecular nature and behaviour of the BMP2+ mesodermal cells during their differentiation into specific somatic cell lineages, we
first established an ES cell-derived transgenic BMP2 cell lin-eage expressing both puromycin acetyltransferase and enhanced green fluorescent protein (EGFP) under the control of the BMP2 promoter. In order to identify all possible signal transduction pathways and biological processes characteris-tic of the BMP2+ cells, we performed expression studies using Affymetrix microarrays. Our study on the phenotypic identi-fication of the ES cell-derived BMP2 lineage-specific cells shows that the early BMP2+ population contained a heteroge-neous population of predominantly NCSCs and their lineages - smooth muscle cells, epithelial like cells, astrocytes and melanocytes. When the early BMP2+ population was further cultured under certain conditions, it contained cardiomyo-cytes, macrophages and osteoblasts. Interestingly, these are the cell phenotypes that need BMP2 for their phenotypic induction. Our work clearly demonstrates the presence of a multi-lineage progenitor phenotype resembling NCSCs cells in early ES cell-derived BMP2+ cells. Moreover, identification of the key signal transduction pathways induced or repressed in BMP2+ cells explains the observed potential of BMP2 in modulating early embryonic development, in particular the mesodermal patterning.
Results and discussion
Isolation of BMP2+ cells from the transgenic BMP2 ES
cell lineage
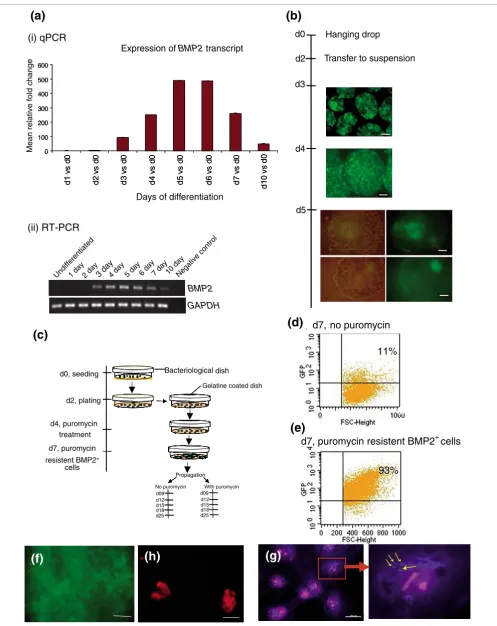
The transgenic BMP2 ES cell lineage was generated with the linearized pBMP2p-puro IRES2 EGFP construct by stable transfection. Like its parental wild type CGR8, the BMP2 ES cells do not express BMP2 in the undifferentiated state (Fig-ure 1a(i) and 1a(ii)). Expression of BMP2 during progressive differentiation induced by the hanging drop protocol (see Materials and methods) starts in the three-day-old embryoid bodies (EBs), gradually increases to a maximum in the five-day-old EBs and, thereafter, gradually decreases to a mini-mum in ten-day-old EBs, in the same manner as that seen in the RT-PCR results (Figure 1a). During the course of differen-tiation induced by the hanging drop protocol, the EGFP-expressing cells in the three- and four-day-old EBs were found to be scattered (Figure 1b). As differentiation contin-ues, the EGFP fluorescence peaks in the five-day-old EBs and the EGFP-expressing cells are localized to a particular region in every EB, as shown in Figure 1b. The RNAs isolated from these EBs were analyzed for the expression of other candidate markers (T-bra, flk1, smooth muscle α-actin,
neurofilament-Expression pattern of BMP2 in differentiating EBs Figure 1 (see following page)
Figure 1 (see legend on previous page)
93%
0 100 200 300 400 500 600 d1 v s d 0 d2 v s d 0 d3 v s d0 d4 v s d 0 d5 v s d 0 d6 v s d 0 d7 vs d0Mean relative fold change
d1 0 v s d0 0 100 200 300 400 500 600 d1 v s d 0 d2 v s d 0 d3 v s d0 d4 v s d 0 d5 v s d 0 d6 v s d 0 d7 vs d0 d1 0 v s d0
(a)
(i) qPCR
No puromycin With puromycin d4, puromycin treatment d0, seeding d2, plating Bacteriological dish d7, puromycin resistent BMP2+
cells d09 d12 d15 d18 d25 d09 d12 d15 d18 d25
(c)
(b)
d4 d511%
G
F
(f)
H
(h)
3da y
Undifferentiated2day 4day5day 7day 10 day
Negative control 6da
y
1day
d7, no puromycin
(d)
G
G
G
G
(g)
(e)
d7, puromycin resistent BMP2
+cells
(ii) RT-PCR
Days of differentiation Expression of BMP2 transcript
Hanging drop
Transfer to suspension d0
d2
d3
BMP2
GAPDH
Gelatine coated dish
H (NF-H) and also α-fetoprotein (AFP)) to demonstrate that these EBs were differentiating in the normal way as per their parental wild-type EBs (Additional data file 1). Isolation and further characterization of the BMP2+, puromycin-resistant cells were optimized according to the protocol described in Figure 1c. Briefly, a single cell suspension of BMP2+ ES cells was seeded in bacteriological dishes for two days to form two-day-old EBs. These were then transferred into gelatine coated tissue culture dishes and cultured for a further two days. Thereafter, plated EBs were treated with 3 μg/ml puromycin for three days. After trypsinization of puromycin-resistant seven-day-old BMP2+ cells, fluorescence-activated cell sort-ing (FACS) analysis was performed. As demonstrated in Fig-ure 1d,e, after 3 days of puromycin treatment, EGFP fluorescing and puromycin resistant BMP2+ cells (hereafter called BMP2+ cells) accounted for 93% of the cells in the EBs, whereas in the control EBs without puromycin treatment (hereafter called control EBs (seven-day-old EBs)) only 11% of the cells were BMP2+ cells. This result demonstrates a nearly 8.5-fold enrichment of BMP2+ cells in EBs treated with puromycin. As demonstrated in Figure 1f, plating of the BMP2+ cells in gelatine coated tissue culture dishes for another three days in the presence of puromycin results in a bright EGFP-positive BMP2+ cell population. Furthermore, the BMP2 protein was detected by immunostaining using BMP2-specific antibodies. The undifferentiated BMP2 ES cells were included as a negative control (Figure 1h). As dem-onstrated, BMP2 is detected only in the cytosol, and specifi-cally in vesicles, of the BMP2+ cells (Figure 1g).
Functional categorization of transcripts upregulated in BMP2+ cells
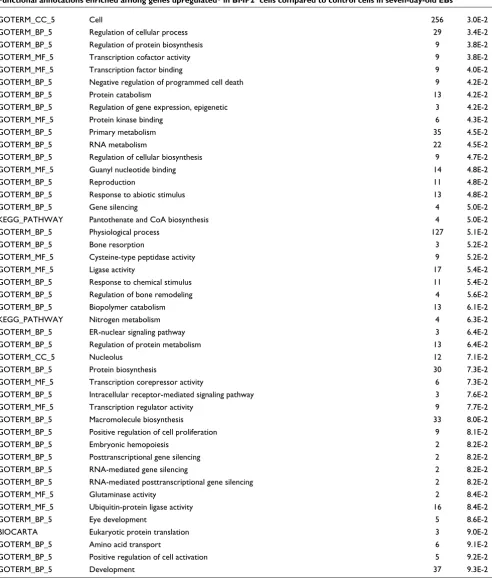
The Affymetrix data obtained were validated by quantitative real time PCR (qPCR; Additional data file 2). To identify Gene Ontology (GO) [10] categories, Kyoto Encyclopedia of Genes and Genomes (KEGG) pathways [11] and BioCarta pathways [12] specifically enriched in BMP2+ cells, we first analyzed genes that are upregulated in BMP2+ cells in comparison to control EBs. Moreover, to identify BMP2+ cell-specific genes, a three condition comparative analysis of the BMP2+ cells to control EBs and to BMP2 ES cells was made (Tables 1 and 2).
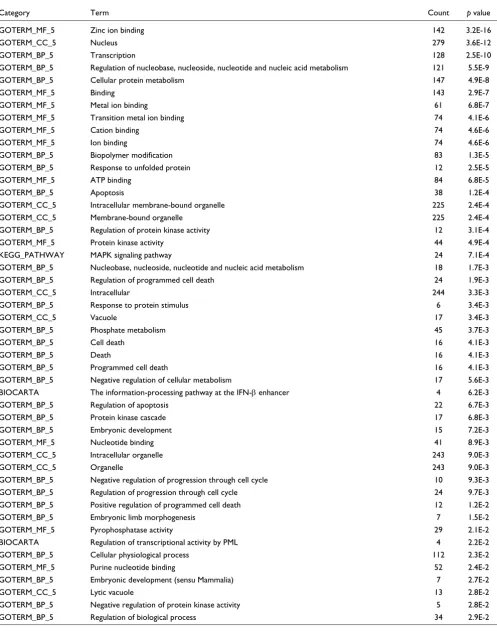
Table 1 indicates different GO terms (level 5) and one KEGG pathway (mitogen-activated protein kinase (MAPK) signaling pathway) that are enriched in the BMP2+ cells compared to control EBs. In the GO categories 'biological process' (GOTERM_BP), 'molecular function' (GOTERM_MF) and 'cellular component' (GOTERM_CC), several relevant cate-gories are pooled, such as transcriptional processes (for zinc ion binding and transcription) and apoptotic processes (for apoptosis, cell death, death, programmed cell death and reg-ulation of apoptosis) (Table 1). Genes for transcriptional activity and associated with apoptosis are also found to be specifically enriched in the BMP2+ cells (Table 2). These results suggest that BMP2 causes direct or indirect induction of apoptotic processes. This hypothesis is supported by the
observations that apoptotic effects of BMP2 promote cavita-tion in EBs and in mouse embryos [13]. The MAPK signaling pathway involved in apoptotic processes [14] seems to be spe-cific for the BMP2+ cell population (Table 2). It is well estab-lished that the MAPK signaling pathway is involved in several processes, including cell cycle progression, cellular transfor-mation apoptosis and differentiation (for a review, see [14]). These results suggest that both apoptosis and transcription genes are characteristic gene expression signatures for the BMP2+ cells.
Additional data files 3-5 list all the genes and include the change factor (CF) values belonging to the GO categories 'transcription' and 'apoptosis' and the KEGG 'MAPK path-way', respectively. Among genes highly upregulated specifi-cally in the BMP2+ cells, Gm397 (gene model 397) and Tbx4 are identified (Additional data file 3). Tbx4 has been shown to be expressed in the lateral mesoderm and is involved in limb outgrowth in the mouse [15] whereas the function of Gm397
is unknown.
Interestingly, among the MAPKs, several kinases belonging to both the classical and the c-Jun amino-terminal kinase (JNK) and p38 MAP kinase pathway were overexpressed in BMP2+ cells (Additional data file 5, KEGG pathway scheme). The JNK and p38 MAPK pathway is known to be stimulated by serum and stress factors [14]. The most striking gene spe-cifically upregulated in BMP2+ cells was Hspa1a (heat shock protein 1A; Additional data file 5), which belongs to the Hsp70 family of stress response genes. Members of this fam-ily participate in the process of folding and refolding of mis-folded proteins and in the transport of proteins across membranes [16]. Hsp1a is also found to be upregulated in chondrons, which includes the chondrocyte and its pericellu-lar matrix, compared to chondrocytes [17].
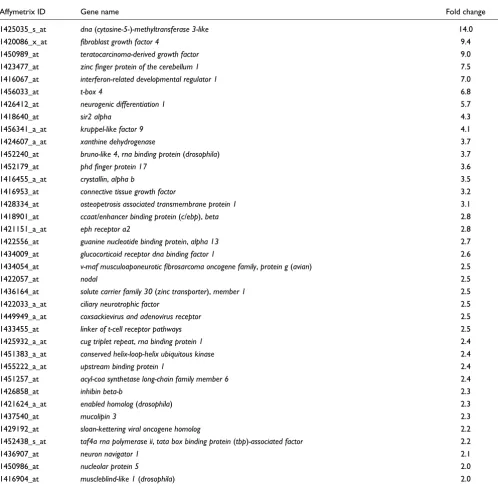
Table 3 lists the developmental genes that are overexpressed in the BMP2+ cells compared to control EBs. Among these,
Dnmt3l (DNA (cytosine-5-)-methyltransferase,3-like), Fgf4
(fibroblast growth factor 4), Tdgf1 (teratocarcinoma derived growth factor), Zic1 (zinc finger protein of the cerebellum 1),
Ifrd1 (interferon-related developmental regulator 1), Tbx4
Functional annotations enriched among genes upregulated* in BMP2+ cells compared to control cells in seven-day-old EBs
Category Term Count p value
GOTERM_MF_5 Zinc ion binding 142 3.2E-16
GOTERM_CC_5 Nucleus 279 3.6E-12
GOTERM_BP_5 Transcription 128 2.5E-10
GOTERM_BP_5 Regulation of nucleobase, nucleoside, nucleotide and nucleic acid metabolism 121 5.5E-9
GOTERM_BP_5 Cellular protein metabolism 147 4.9E-8
GOTERM_MF_5 Binding 143 2.9E-7
GOTERM_MF_5 Metal ion binding 61 6.8E-7
GOTERM_MF_5 Transition metal ion binding 74 4.1E-6
GOTERM_MF_5 Cation binding 74 4.6E-6
GOTERM_MF_5 Ion binding 74 4.6E-6
GOTERM_BP_5 Biopolymer modification 83 1.3E-5
GOTERM_BP_5 Response to unfolded protein 12 2.5E-5
GOTERM_MF_5 ATP binding 84 6.8E-5
GOTERM_BP_5 Apoptosis 38 1.2E-4
GOTERM_CC_5 Intracellular membrane-bound organelle 225 2.4E-4
GOTERM_CC_5 Membrane-bound organelle 225 2.4E-4
GOTERM_BP_5 Regulation of protein kinase activity 12 3.1E-4
GOTERM_MF_5 Protein kinase activity 44 4.9E-4
KEGG_PATHWAY MAPK signaling pathway 24 7.1E-4
GOTERM_BP_5 Nucleobase, nucleoside, nucleotide and nucleic acid metabolism 18 1.7E-3
GOTERM_BP_5 Regulation of programmed cell death 24 1.9E-3
GOTERM_CC_5 Intracellular 244 3.3E-3
GOTERM_BP_5 Response to protein stimulus 6 3.4E-3
GOTERM_CC_5 Vacuole 17 3.4E-3
GOTERM_BP_5 Phosphate metabolism 45 3.7E-3
GOTERM_BP_5 Cell death 16 4.1E-3
GOTERM_BP_5 Death 16 4.1E-3
GOTERM_BP_5 Programmed cell death 16 4.1E-3
GOTERM_BP_5 Negative regulation of cellular metabolism 17 5.6E-3
BIOCARTA The information-processing pathway at the IFN-β enhancer 4 6.2E-3
GOTERM_BP_5 Regulation of apoptosis 22 6.7E-3
GOTERM_BP_5 Protein kinase cascade 17 6.8E-3
GOTERM_BP_5 Embryonic development 15 7.2E-3
GOTERM_MF_5 Nucleotide binding 41 8.9E-3
GOTERM_CC_5 Intracellular organelle 243 9.0E-3
GOTERM_CC_5 Organelle 243 9.0E-3
GOTERM_BP_5 Negative regulation of progression through cell cycle 10 9.3E-3
GOTERM_BP_5 Regulation of progression through cell cycle 24 9.7E-3
GOTERM_BP_5 Positive regulation of programmed cell death 12 1.2E-2
GOTERM_BP_5 Embryonic limb morphogenesis 7 1.5E-2
GOTERM_MF_5 Pyrophosphatase activity 29 2.1E-2
BIOCARTA Regulation of transcriptional activity by PML 4 2.2E-2
GOTERM_BP_5 Cellular physiological process 112 2.3E-2
GOTERM_MF_5 Purine nucleotide binding 52 2.4E-2
GOTERM_BP_5 Embryonic development (sensu Mammalia) 7 2.7E-2
GOTERM_CC_5 Lytic vacuole 13 2.8E-2
GOTERM_BP_5 Negative regulation of protein kinase activity 5 2.8E-2
[image:5.612.56.553.119.750.2]GOTERM_CC_5 Cell 256 3.0E-2
GOTERM_BP_5 Regulation of cellular process 29 3.4E-2
GOTERM_BP_5 Regulation of protein biosynthesis 9 3.8E-2
GOTERM_MF_5 Transcription cofactor activity 9 3.8E-2
GOTERM_MF_5 Transcription factor binding 9 4.0E-2
GOTERM_BP_5 Negative regulation of programmed cell death 9 4.2E-2
GOTERM_BP_5 Protein catabolism 13 4.2E-2
GOTERM_BP_5 Regulation of gene expression, epigenetic 3 4.2E-2
GOTERM_MF_5 Protein kinase binding 6 4.3E-2
GOTERM_BP_5 Primary metabolism 35 4.5E-2
GOTERM_BP_5 RNA metabolism 22 4.5E-2
GOTERM_BP_5 Regulation of cellular biosynthesis 9 4.7E-2
GOTERM_MF_5 Guanyl nucleotide binding 14 4.8E-2
GOTERM_BP_5 Reproduction 11 4.8E-2
GOTERM_BP_5 Response to abiotic stimulus 13 4.8E-2
GOTERM_BP_5 Gene silencing 4 5.0E-2
KEGG_PATHWAY Pantothenate and CoA biosynthesis 4 5.0E-2
GOTERM_BP_5 Physiological process 127 5.1E-2
GOTERM_BP_5 Bone resorption 3 5.2E-2
GOTERM_MF_5 Cysteine-type peptidase activity 9 5.2E-2
GOTERM_MF_5 Ligase activity 17 5.4E-2
GOTERM_BP_5 Response to chemical stimulus 11 5.4E-2
GOTERM_BP_5 Regulation of bone remodeling 4 5.6E-2
GOTERM_BP_5 Biopolymer catabolism 13 6.1E-2
KEGG_PATHWAY Nitrogen metabolism 4 6.3E-2
GOTERM_BP_5 ER-nuclear signaling pathway 3 6.4E-2
GOTERM_BP_5 Regulation of protein metabolism 13 6.4E-2
GOTERM_CC_5 Nucleolus 12 7.1E-2
GOTERM_BP_5 Protein biosynthesis 30 7.3E-2
GOTERM_MF_5 Transcription corepressor activity 6 7.3E-2
GOTERM_BP_5 Intracellular receptor-mediated signaling pathway 3 7.6E-2
GOTERM_MF_5 Transcription regulator activity 9 7.7E-2
GOTERM_BP_5 Macromolecule biosynthesis 33 8.0E-2
GOTERM_BP_5 Positive regulation of cell proliferation 9 8.1E-2
GOTERM_BP_5 Embryonic hemopoiesis 2 8.2E-2
GOTERM_BP_5 Posttranscriptional gene silencing 2 8.2E-2
GOTERM_BP_5 RNA-mediated gene silencing 2 8.2E-2
GOTERM_BP_5 RNA-mediated posttranscriptional gene silencing 2 8.2E-2
GOTERM_MF_5 Glutaminase activity 2 8.4E-2
GOTERM_MF_5 Ubiquitin-protein ligase activity 16 8.4E-2
GOTERM_BP_5 Eye development 5 8.6E-2
BIOCARTA Eukaryotic protein translation 3 9.0E-2
GOTERM_BP_5 Amino acid transport 6 9.1E-2
GOTERM_BP_5 Positive regulation of cell activation 5 9.2E-2
GOTERM_BP_5 Development 37 9.3E-2
[image:6.612.60.552.109.687.2]*Change fold >2, Student's t-test p value < 0.01. Count indicates the number of genes in the functional annotation category. The p value is from gene enrichment in annotation terms calculated by the Fisher's exact t-test.
Table 1 (Continued)
Teratocarcinoma-derived growth factor (encoded by Tdgf1, also known as Cripto-1) plays a pivotal role as a multifunc-tional modulator during embryogenesis and oncogenesis, and may be involved in stem cell maintenance [21]. NeuroD1 is a member of the basic helix-loop-helix transcription factor family and has been shown to play a major role in develop-ment of the nervous system and formation of the endocrine system [22]. The transcription factor ZIC1 plays important roles in patterning the neural plate in early vertebrate devel-opment. Zic1 expression was detected in the neural plate bor-der, dorsal neural tube, and somites [23]. Moreover, Zic1
plays an important role in early patterning of the Xenopus
presumptive neurectoderm [24].
Interferon-related developmental regulator 1 (IFRD1; also known as PC4, Tis7) is a chromatin-associated protein that induces chromatin condensation and plays multiple roles in cellular processes, including transcription, DNA replication and repair [25]. It is expressed early in the mouse embryo and extra-embryonic tissues during gastrulation and at
mid-ges-tation in restricted structures (such as the central nervous system, kidney, and lung primordia), whereas it is ubiquitously expressed at late gestation [26]. IFRD1 has been shown to act as a coactivator of myogenic differentiation 1 (MyoD1) and myocyte enhancer factor 2C (MEF2C) during myogenesis [27].
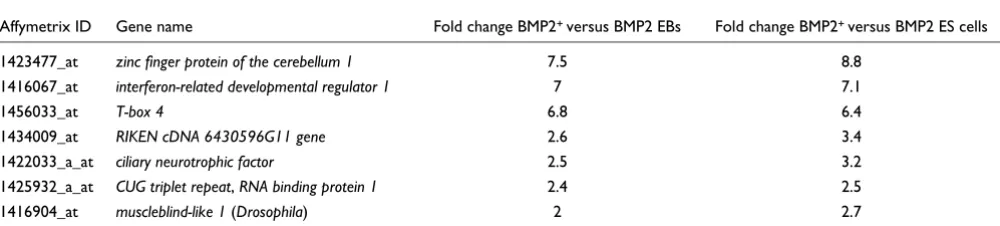
The three condition comparative analysis results in a set of seven BMP2+ cell-specific genes (Table 4). Among these, the most prominently regulated genes are Zic1, Ifrd1 and Tbx4, which have been discussed previously. Ciliary neurotrophic factor (CNTF) is of particular interest. CNTF is a cytokine with neurotrophic and differentiating effects on central nerv-ous system cells and myotrophic effects on skeletal muscle [28].
GO enrichment analysis of the genes downregulated in BMP2+ cells
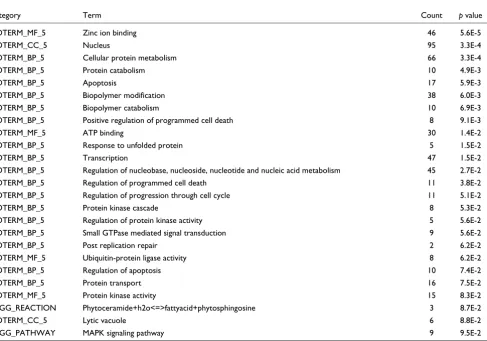
To identify overrepresented GO categories or KEGG path-ways specifically downregulated in BMP2+ cells, we analyzed Functional annotations enriched among genes upregulated* in BMP2+ cells compared to control cells in seven-day-old EBs and undiffer-entiated BMP2 ES cells
Category Term Count p value
GOTERM_MF_5 Zinc ion binding 46 5.6E-5
GOTERM_CC_5 Nucleus 95 3.3E-4
GOTERM_BP_5 Cellular protein metabolism 66 3.3E-4
GOTERM_BP_5 Protein catabolism 10 4.9E-3
GOTERM_BP_5 Apoptosis 17 5.9E-3
GOTERM_BP_5 Biopolymer modification 38 6.0E-3
GOTERM_BP_5 Biopolymer catabolism 10 6.9E-3
GOTERM_BP_5 Positive regulation of programmed cell death 8 9.1E-3
GOTERM_MF_5 ATP binding 30 1.4E-2
GOTERM_BP_5 Response to unfolded protein 5 1.5E-2
GOTERM_BP_5 Transcription 47 1.5E-2
GOTERM_BP_5 Regulation of nucleobase, nucleoside, nucleotide and nucleic acid metabolism 45 2.7E-2
GOTERM_BP_5 Regulation of programmed cell death 11 3.8E-2
GOTERM_BP_5 Regulation of progression through cell cycle 11 5.1E-2
GOTERM_BP_5 Protein kinase cascade 8 5.3E-2
GOTERM_BP_5 Regulation of protein kinase activity 5 5.6E-2
GOTERM_BP_5 Small GTPase mediated signal transduction 9 5.6E-2
GOTERM_BP_5 Post replication repair 2 6.2E-2
GOTERM_MF_5 Ubiquitin-protein ligase activity 8 6.2E-2
GOTERM_BP_5 Regulation of apoptosis 10 7.4E-2
GOTERM_BP_5 Protein transport 16 7.5E-2
GOTERM_MF_5 Protein kinase activity 15 8.3E-2
KEGG_REACTION Phytoceramide+h2o<=>fattyacid+phytosphingosine 3 8.7E-2
GOTERM_CC_5 Lytic vacuole 6 8.8E-2
KEGG_PATHWAY MAPK signaling pathway 9 9.5E-2
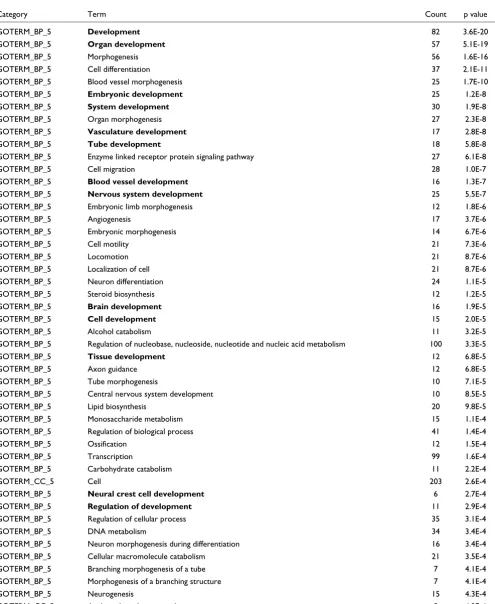
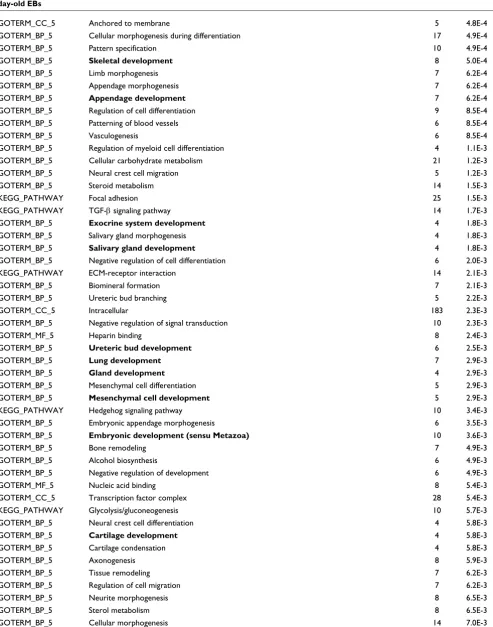
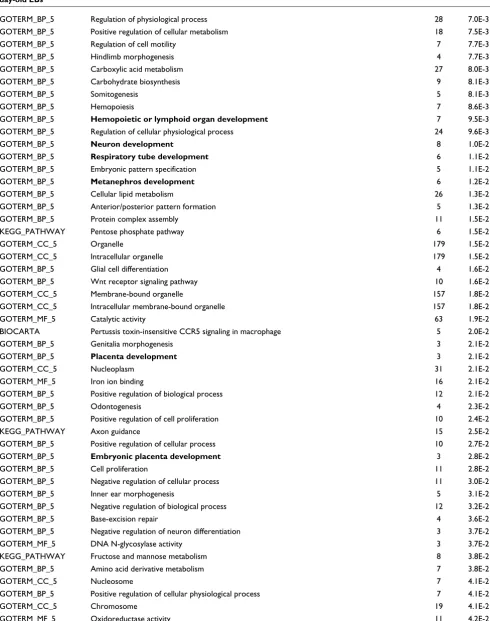
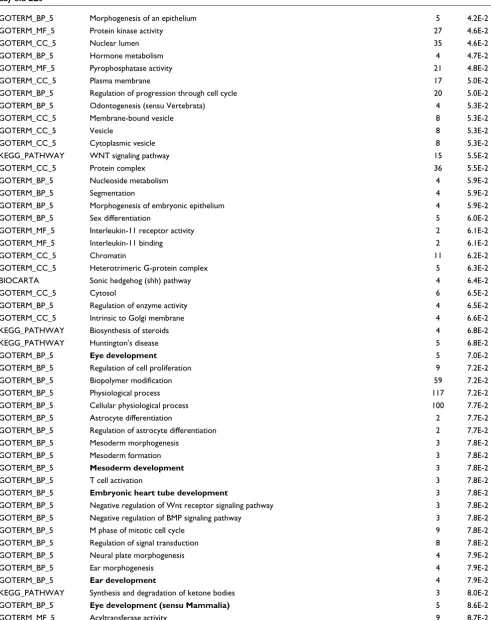
[image:7.612.65.552.126.467.2]the data with the DAVID bioinformatics resource [29]. Com-parative analysis of the expression level of genes in BMP2+ and in control EBs shows downregulated genes belong to sev-eral overrepresented GO categories, such as focal adhesion, TGF-β signaling pathway, extracellular matrix (ECM)-recep-tor interaction and shh signaling pathway (Table 5). Some overrepresented categories are related to the developmental processes (for example, development, organ development, embryonic development and brain development; (Table 5, entries in bold). This is not surprising, since the
[image:8.612.58.556.120.606.2]seven-day-old control EBs can still develop into various somatic precur-sor cells, as indicated in the tables (for example, vasculature development and brain development). Notably, GO catego-ries associated with impaired developmental processes appear not to be characteristic of BMP2+ cells when the expression levels of these genes in undifferentiated ES cells are also taken into account. These results clearly show that the BMP2+ cells are more closely related to the undifferentiated ES cells than to the control EBs with regard to their developmental potential and plasticity.
Table 3
Genes of GO category 'development' upregulated at least two-fold* in BMP2+ cells compared to control cells in seven-day-old EBs
Affymetrix ID Gene name Fold change
1425035_s_at dna (cytosine-5-)-methyltransferase 3-like 14.0
1420086_x_at fibroblast growth factor 4 9.4
1450989_at teratocarcinoma-derived growth factor 9.0
1423477_at zinc finger protein of the cerebellum 1 7.5
1416067_at interferon-related developmental regulator 1 7.0
1456033_at t-box 4 6.8
1426412_at neurogenic differentiation 1 5.7
1418640_at sir2 alpha 4.3
1456341_a_at kruppel-like factor 9 4.1
1424607_a_at xanthine dehydrogenase 3.7
1452240_at bruno-like 4, rna binding protein (drosophila) 3.7
1452179_at phd finger protein 17 3.6
1416455_a_at crystallin, alpha b 3.5
1416953_at connective tissue growth factor 3.2
1428334_at osteopetrosis associated transmembrane protein 1 3.1
1418901_at ccaat/enhancer binding protein (c/ebp), beta 2.8
1421151_a_at eph receptor a2 2.8
1422556_at guanine nucleotide binding protein, alpha 13 2.7
1434009_at glucocorticoid receptor dna binding factor 1 2.6
1434054_at v-maf musculoaponeurotic fibrosarcoma oncogene family, protein g (avian) 2.5
1422057_at nodal 2.5
1436164_at solute carrier family 30 (zinc transporter), member 1 2.5
1422033_a_at ciliary neurotrophic factor 2.5
1449949_a_at coxsackievirus and adenovirus receptor 2.5
1433455_at linker of t-cell receptor pathways 2.5
1425932_a_at cug triplet repeat, rna binding protein 1 2.4
1451383_a_at conserved helix-loop-helix ubiquitous kinase 2.4
1455222_a_at upstream binding protein 1 2.4
1451257_at acyl-coa synthetase long-chain family member 6 2.4
1426858_at inhibin beta-b 2.3
1421624_a_at enabled homolog (drosophila) 2.3
1437540_at mucolipin 3 2.3
1429192_at sloan-kettering viral oncogene homolog 2.2
1452438_s_at taf4a rna polymerase ii, tata box binding protein (tbp)-associated factor 2.2
1436907_at neuron navigator 1 2.1
1450986_at nucleolar protein 5 2.0
1416904_at muscleblind-like 1 (drosophila) 2.0
Genes belonging to GO categories related to the proliferative processes, such as M phase of mitotic cycle and DNA metabolism are specifically downregulated in the BMP2+ cells. Additional data files 6-8 list the genes belonging to the GO 'development' category, TGF-β KEGG pathway and the GO 'M phase' category. The most strikingly downregulated genes from the TGF-β KEGG pathway (Additional data file 7) are Bmp5, Fst (follistatin), Id1 (inhibitor of DNA binding 1) and Tgfβ2 (TGF-β). BMPs are members of the TGF-β super-family of signal molecules, which mediate many diverse bio-logical processes ranging from early embryonic tissue patterning to postnatal tissue homeostasis [30]. WNT, Notch, FGF, Hedgehog and BMP signaling pathways act together during embryogenesis, tissue regeneration and carcinogene-sis [31]. Follistatin is a BMP antagonist that regulates the actions of the TGF-β superfamily members [32].
Selected GO biological process annotations of genes differentially expressed in BMP2+ cells
We analyzed those transcripts that are differentially expressed in BMP2+ cells and involved in selected GO catego-ries of the 'biological process' branch (Additional data file 9). SOURCE [33] was used to obtain GO annotations for the cat-egory 'biological process'. The Genesis GO browser (version 1.7.0) [34,35] was used to identify transcripts of interest belonging to the biological process categories adhesion, cell cycle, cell death, cell-cell signaling, cellular metabolism, development, stress response, signal transduction, transcrip-tion, and transport. Numbers of these transcripts for each selected category are displayed as separate up- and downreg-ulated groups (Additional data file 9, parts B and D).
More stress-related and less developmental genes are identi-fied when the gene expression levels in undifferentiated ES cells are taken into account ('three condition comparative analysis') than when expression levels are compared between BMP2+ cells and control cells alone (pairwise comparison). In the three condition comparative analysis, all 16 cell death-related transcripts are upregulated in BMP2+ cells. When analyzed further, most of them are apoptosis-related genes. This annotation suggests that cell death during ES cell
differ-entiation mainly involves apoptosis. When ES cells are not taken into account in the two condition comparison, some (18 out of 49) cell death transcripts are downregulated in BMP2+ cells. In reference to signal transduction during BMP2+ cell differentiation, more transcripts are differentially upregu-lated than downreguupregu-lated in BMP2+ cells compared to ES cells and control EBs. However, the ratio is reversed when BMP2+ cells are compared only with control EBs. The control EBs differentiat to various cell populations and, thus, more signaling pathways are activated than in BMP2+ cells, which eventually contribute to signaling pathways limited to development.
Hierarchical clustering of genes identified as differentially expressed and involved in development in the pairwise com-parison illustrates how transcripts distribute into co-regu-lated groups and show good reproducibility between experimental replicates (Additional data file 9, part E). Inter-estingly, the experimental conditions 'BMP2+ cells' and 'undifferentiated cells' are more closely related to each other than to the condition 'control EBs', indicating an earlier developmental stage of BMP2+ cells compared to control EBs of the same age (Additional data file 9, part E).
Expression of genes in the BMP2+ cells associated with
plasticity, and mesodermal and NCSC phenotypes BMP2+ cells are still in a state of plasticity
BMP2+ cells significantly upregulate Oct4 and Nanog tran-script expression compared to the control EBs, in which sev-eral somatic cell types develop (Figure 2a,b), but at a level lower than ES cells. This implies that there are some populations of BMP2+ cells with multi-lineage progenitor phenotypes, which are still in a certain state of plasticity and can give rise to different cell fates depending upon the stimuli. This is further confirmed by the upregulated expression of leukemia inhibitory factor (LIF) in the BMP2+ population compared to the control EBs. Interestingly, the transcripts of Activin, Nodal and Cripto are also upregulated in the BMP2+ population compared to the control EBs. Recently, it has been demonstrated that the TGF-β/Activin/Nodal signaling path-way is necessary for the maintenance of pluripotency in ES Genes of GO category 'development' upregulated at least two-fold* in BMP2+ cells compared to control cells in seven-day-old EBs and undifferentiated BMP2 ES cells
Affymetrix ID Gene name Fold change BMP2+ versus BMP2 EBs Fold change BMP2+ versus BMP2 ES cells
1423477_at zinc finger protein of the cerebellum 1 7.5 8.8
1416067_at interferon-related developmental regulator 1 7 7.1
1456033_at T-box 4 6.8 6.4
1434009_at RIKEN cDNA 6430596G11 gene 2.6 3.4
1422033_a_at ciliary neurotrophic factor 2.5 3.2
1425932_a_at CUG triplet repeat, RNA binding protein 1 2.4 2.5
1416904_at muscleblind-like 1 (Drosophila) 2 2.7
[image:9.612.55.555.128.241.2]Table 5
Functional annotations (GO, KEGG, Biocarta) enriched in transcripts downregulated* in BMP2+ cells compared to control cells in seven-day-old EBs
Category Term Count p value
GOTERM_BP_5 Development 82 3.6E-20
GOTERM_BP_5 Organ development 57 5.1E-19
GOTERM_BP_5 Morphogenesis 56 1.6E-16
GOTERM_BP_5 Cell differentiation 37 2.1E-11
GOTERM_BP_5 Blood vessel morphogenesis 25 1.7E-10
GOTERM_BP_5 Embryonic development 25 1.2E-8
GOTERM_BP_5 System development 30 1.9E-8
GOTERM_BP_5 Organ morphogenesis 27 2.3E-8
GOTERM_BP_5 Vasculature development 17 2.8E-8
GOTERM_BP_5 Tube development 18 5.8E-8
GOTERM_BP_5 Enzyme linked receptor protein signaling pathway 27 6.1E-8
GOTERM_BP_5 Cell migration 28 1.0E-7
GOTERM_BP_5 Blood vessel development 16 1.3E-7
GOTERM_BP_5 Nervous system development 25 5.5E-7
GOTERM_BP_5 Embryonic limb morphogenesis 12 1.8E-6
GOTERM_BP_5 Angiogenesis 17 3.7E-6
GOTERM_BP_5 Embryonic morphogenesis 14 6.7E-6
GOTERM_BP_5 Cell motility 21 7.3E-6
GOTERM_BP_5 Locomotion 21 8.7E-6
GOTERM_BP_5 Localization of cell 21 8.7E-6
GOTERM_BP_5 Neuron differentiation 24 1.1E-5
GOTERM_BP_5 Steroid biosynthesis 12 1.2E-5
GOTERM_BP_5 Brain development 16 1.9E-5
GOTERM_BP_5 Cell development 15 2.0E-5
GOTERM_BP_5 Alcohol catabolism 11 3.2E-5
GOTERM_BP_5 Regulation of nucleobase, nucleoside, nucleotide and nucleic acid metabolism 100 3.3E-5
GOTERM_BP_5 Tissue development 12 6.8E-5
GOTERM_BP_5 Axon guidance 12 6.8E-5
GOTERM_BP_5 Tube morphogenesis 10 7.1E-5
GOTERM_BP_5 Central nervous system development 10 8.5E-5
GOTERM_BP_5 Lipid biosynthesis 20 9.8E-5
GOTERM_BP_5 Monosaccharide metabolism 15 1.1E-4
GOTERM_BP_5 Regulation of biological process 41 1.4E-4
GOTERM_BP_5 Ossification 12 1.5E-4
GOTERM_BP_5 Transcription 99 1.6E-4
GOTERM_BP_5 Carbohydrate catabolism 11 2.2E-4
GOTERM_CC_5 Cell 203 2.6E-4
GOTERM_BP_5 Neural crest cell development 6 2.7E-4
GOTERM_BP_5 Regulation of development 11 2.9E-4
GOTERM_BP_5 Regulation of cellular process 35 3.1E-4
GOTERM_BP_5 DNA metabolism 34 3.4E-4
GOTERM_BP_5 Neuron morphogenesis during differentiation 16 3.4E-4
GOTERM_BP_5 Cellular macromolecule catabolism 21 3.5E-4
GOTERM_BP_5 Branching morphogenesis of a tube 7 4.1E-4
GOTERM_BP_5 Morphogenesis of a branching structure 7 4.1E-4
GOTERM_BP_5 Neurogenesis 15 4.3E-4
GOTERM_CC_5 Anchored to membrane 5 4.8E-4
GOTERM_BP_5 Cellular morphogenesis during differentiation 17 4.9E-4
GOTERM_BP_5 Pattern specification 10 4.9E-4
GOTERM_BP_5 Skeletal development 8 5.0E-4
GOTERM_BP_5 Limb morphogenesis 7 6.2E-4
GOTERM_BP_5 Appendage morphogenesis 7 6.2E-4
GOTERM_BP_5 Appendage development 7 6.2E-4
GOTERM_BP_5 Regulation of cell differentiation 9 8.5E-4
GOTERM_BP_5 Patterning of blood vessels 6 8.5E-4
GOTERM_BP_5 Vasculogenesis 6 8.5E-4
GOTERM_BP_5 Regulation of myeloid cell differentiation 4 1.1E-3
GOTERM_BP_5 Cellular carbohydrate metabolism 21 1.2E-3
GOTERM_BP_5 Neural crest cell migration 5 1.2E-3
GOTERM_BP_5 Steroid metabolism 14 1.5E-3
KEGG_PATHWAY Focal adhesion 25 1.5E-3
KEGG_PATHWAY TGF-β signaling pathway 14 1.7E-3
GOTERM_BP_5 Exocrine system development 4 1.8E-3
GOTERM_BP_5 Salivary gland morphogenesis 4 1.8E-3
GOTERM_BP_5 Salivary gland development 4 1.8E-3
GOTERM_BP_5 Negative regulation of cell differentiation 6 2.0E-3
KEGG_PATHWAY ECM-receptor interaction 14 2.1E-3
GOTERM_BP_5 Biomineral formation 7 2.1E-3
GOTERM_BP_5 Ureteric bud branching 5 2.2E-3
GOTERM_CC_5 Intracellular 183 2.3E-3
GOTERM_BP_5 Negative regulation of signal transduction 10 2.3E-3
GOTERM_MF_5 Heparin binding 8 2.4E-3
GOTERM_BP_5 Ureteric bud development 6 2.5E-3
GOTERM_BP_5 Lung development 7 2.9E-3
GOTERM_BP_5 Gland development 4 2.9E-3
GOTERM_BP_5 Mesenchymal cell differentiation 5 2.9E-3
GOTERM_BP_5 Mesenchymal cell development 5 2.9E-3
KEGG_PATHWAY Hedgehog signaling pathway 10 3.4E-3
GOTERM_BP_5 Embryonic appendage morphogenesis 6 3.5E-3
GOTERM_BP_5 Embryonic development (sensu Metazoa) 10 3.6E-3
GOTERM_BP_5 Bone remodeling 7 4.9E-3
GOTERM_BP_5 Alcohol biosynthesis 6 4.9E-3
GOTERM_BP_5 Negative regulation of development 6 4.9E-3
GOTERM_MF_5 Nucleic acid binding 8 5.4E-3
GOTERM_CC_5 Transcription factor complex 28 5.4E-3
KEGG_PATHWAY Glycolysis/gluconeogenesis 10 5.7E-3
GOTERM_BP_5 Neural crest cell differentiation 4 5.8E-3
GOTERM_BP_5 Cartilage development 4 5.8E-3
GOTERM_BP_5 Cartilage condensation 4 5.8E-3
GOTERM_BP_5 Axonogenesis 8 5.9E-3
GOTERM_BP_5 Tissue remodeling 7 6.2E-3
GOTERM_BP_5 Regulation of cell migration 7 6.2E-3
GOTERM_BP_5 Neurite morphogenesis 8 6.5E-3
GOTERM_BP_5 Sterol metabolism 8 6.5E-3
GOTERM_BP_5 Cellular morphogenesis 14 7.0E-3
[image:11.612.57.550.115.742.2]GOTERM_BP_5 Regulation of physiological process 28 7.0E-3
GOTERM_BP_5 Positive regulation of cellular metabolism 18 7.5E-3
GOTERM_BP_5 Regulation of cell motility 7 7.7E-3
GOTERM_BP_5 Hindlimb morphogenesis 4 7.7E-3
GOTERM_BP_5 Carboxylic acid metabolism 27 8.0E-3
GOTERM_BP_5 Carbohydrate biosynthesis 9 8.1E-3
GOTERM_BP_5 Somitogenesis 5 8.1E-3
GOTERM_BP_5 Hemopoiesis 7 8.6E-3
GOTERM_BP_5 Hemopoietic or lymphoid organ development 7 9.5E-3
GOTERM_BP_5 Regulation of cellular physiological process 24 9.6E-3
GOTERM_BP_5 Neuron development 8 1.0E-2
GOTERM_BP_5 Respiratory tube development 6 1.1E-2
GOTERM_BP_5 Embryonic pattern specification 5 1.1E-2
GOTERM_BP_5 Metanephros development 6 1.2E-2
GOTERM_BP_5 Cellular lipid metabolism 26 1.3E-2
GOTERM_BP_5 Anterior/posterior pattern formation 5 1.3E-2
GOTERM_BP_5 Protein complex assembly 11 1.5E-2
KEGG_PATHWAY Pentose phosphate pathway 6 1.5E-2
GOTERM_CC_5 Organelle 179 1.5E-2
GOTERM_CC_5 Intracellular organelle 179 1.5E-2
GOTERM_BP_5 Glial cell differentiation 4 1.6E-2
GOTERM_BP_5 Wnt receptor signaling pathway 10 1.6E-2
GOTERM_CC_5 Membrane-bound organelle 157 1.8E-2
GOTERM_CC_5 Intracellular membrane-bound organelle 157 1.8E-2
GOTERM_MF_5 Catalytic activity 63 1.9E-2
BIOCARTA Pertussis toxin-insensitive CCR5 signaling in macrophage 5 2.0E-2
GOTERM_BP_5 Genitalia morphogenesis 3 2.1E-2
GOTERM_BP_5 Placenta development 3 2.1E-2
GOTERM_CC_5 Nucleoplasm 31 2.1E-2
GOTERM_MF_5 Iron ion binding 16 2.1E-2
GOTERM_BP_5 Positive regulation of biological process 12 2.1E-2
GOTERM_BP_5 Odontogenesis 4 2.3E-2
GOTERM_BP_5 Positive regulation of cell proliferation 10 2.4E-2
KEGG_PATHWAY Axon guidance 15 2.5E-2
GOTERM_BP_5 Positive regulation of cellular process 10 2.7E-2
GOTERM_BP_5 Embryonic placenta development 3 2.8E-2
GOTERM_BP_5 Cell proliferation 11 2.8E-2
GOTERM_BP_5 Negative regulation of cellular process 11 3.0E-2
GOTERM_BP_5 Inner ear morphogenesis 5 3.1E-2
GOTERM_BP_5 Negative regulation of biological process 12 3.2E-2
GOTERM_BP_5 Base-excision repair 4 3.6E-2
GOTERM_BP_5 Negative regulation of neuron differentiation 3 3.7E-2
GOTERM_MF_5 DNA N-glycosylase activity 3 3.7E-2
KEGG_PATHWAY Fructose and mannose metabolism 8 3.8E-2
GOTERM_BP_5 Amino acid derivative metabolism 7 3.8E-2
GOTERM_CC_5 Nucleosome 7 4.1E-2
GOTERM_BP_5 Positive regulation of cellular physiological process 7 4.1E-2
GOTERM_CC_5 Chromosome 19 4.1E-2
[image:12.612.58.548.119.740.2]GOTERM_MF_5 Oxidoreductase activity 11 4.2E-2
Table 5 (Continued)
GOTERM_BP_5 Morphogenesis of an epithelium 5 4.2E-2
GOTERM_MF_5 Protein kinase activity 27 4.6E-2
GOTERM_CC_5 Nuclear lumen 35 4.6E-2
GOTERM_BP_5 Hormone metabolism 4 4.7E-2
GOTERM_MF_5 Pyrophosphatase activity 21 4.8E-2
GOTERM_CC_5 Plasma membrane 17 5.0E-2
GOTERM_BP_5 Regulation of progression through cell cycle 20 5.0E-2
GOTERM_BP_5 Odontogenesis (sensu Vertebrata) 4 5.3E-2
GOTERM_CC_5 Membrane-bound vesicle 8 5.3E-2
GOTERM_CC_5 Vesicle 8 5.3E-2
GOTERM_CC_5 Cytoplasmic vesicle 8 5.3E-2
KEGG_PATHWAY WNT signaling pathway 15 5.5E-2
GOTERM_CC_5 Protein complex 36 5.5E-2
GOTERM_BP_5 Nucleoside metabolism 4 5.9E-2
GOTERM_BP_5 Segmentation 4 5.9E-2
GOTERM_BP_5 Morphogenesis of embryonic epithelium 4 5.9E-2
GOTERM_BP_5 Sex differentiation 5 6.0E-2
GOTERM_MF_5 Interleukin-11 receptor activity 2 6.1E-2
GOTERM_MF_5 Interleukin-11 binding 2 6.1E-2
GOTERM_CC_5 Chromatin 11 6.2E-2
GOTERM_CC_5 Heterotrimeric G-protein complex 5 6.3E-2
BIOCARTA Sonic hedgehog (shh) pathway 4 6.4E-2
GOTERM_CC_5 Cytosol 6 6.5E-2
GOTERM_BP_5 Regulation of enzyme activity 4 6.5E-2
GOTERM_CC_5 Intrinsic to Golgi membrane 4 6.6E-2
KEGG_PATHWAY Biosynthesis of steroids 4 6.8E-2
KEGG_PATHWAY Huntington's disease 5 6.8E-2
GOTERM_BP_5 Eye development 5 7.0E-2
GOTERM_BP_5 Regulation of cell proliferation 9 7.2E-2
GOTERM_BP_5 Biopolymer modification 59 7.2E-2
GOTERM_BP_5 Physiological process 117 7.2E-2
GOTERM_BP_5 Cellular physiological process 100 7.7E-2
GOTERM_BP_5 Astrocyte differentiation 2 7.7E-2
GOTERM_BP_5 Regulation of astrocyte differentiation 2 7.7E-2
GOTERM_BP_5 Mesoderm morphogenesis 3 7.8E-2
GOTERM_BP_5 Mesoderm formation 3 7.8E-2
GOTERM_BP_5 Mesoderm development 3 7.8E-2
GOTERM_BP_5 T cell activation 3 7.8E-2
GOTERM_BP_5 Embryonic heart tube development 3 7.8E-2
GOTERM_BP_5 Negative regulation of Wnt receptor signaling pathway 3 7.8E-2
GOTERM_BP_5 Negative regulation of BMP signaling pathway 3 7.8E-2
GOTERM_BP_5 M phase of mitotic cell cycle 9 7.8E-2
GOTERM_BP_5 Regulation of signal transduction 8 7.8E-2
GOTERM_BP_5 Neural plate morphogenesis 4 7.9E-2
GOTERM_BP_5 Ear morphogenesis 4 7.9E-2
GOTERM_BP_5 Ear development 4 7.9E-2
KEGG_PATHWAY Synthesis and degradation of ketone bodies 3 8.0E-2
GOTERM_BP_5 Eye development (sensu Mammalia) 5 8.6E-2
GOTERM_MF_5 Acyltransferase activity 9 8.7E-2
[image:13.612.56.547.120.740.2]cells [36]. Therefore, the increased levels of the pluripotency associated gene markers Oct4 and Nanog might be explained, in part, by the increased expression of LIF, Activin and Nodal observed in the BMP2+ cells (Figure 2). It is worth mentioning the hypothesis by Niwa et al. [37] that to maintain the undif-ferentiated stem-cell phenotype, Oct-3/4 expression must remain within plus or minus 50% of normal diploid expres-sion. If Oct-3/4 expression is increased beyond the upper threshold level, differentiation into primitive endoderm or mesoderm is triggered. If Oct-3/4 expression is decreased, stem cells are redirected into the trophectoderm lineage. This partly explains the increased levels of Oct-3/4 by the BMP2+ mesodermal lineages [37].
The BMP2+ cells exhibit mesodermal characteristics
The expression levels of nodal, activin, eomesodermin, cripto and mesoderm posterior 2 (Mesp2) was increased in BMP2+ cells whereas the expression of T-bra and Mesp1 was lower in the BMP2+ cells compared to the control EBs (Figure 2). It has been shown that Activin and Nodal, members of the TGF-β superfamily, play pivotal roles in inducing and patterning mesoderm and endoderm, as well as in regulating neurogen-esis and left-right axis asymmetry (for a review, see [38]). Nodal genes have been identified in numerous vertebrate spe-cies and are expressed in specific cell types and tissues during embryonic development [38]. Moreover, Nodal null mouse mutants lack mesoderm. Overexpression of Nodal in mouse ES cells leads to upregulation of mesodermal and endodermal cell markers. These findings support the key role of Nodal for mesoderm formation [39]. Also, it was repeatedly shown that Activin is involved in the mesodermal pattering during Xeno-pus embryo development [40]. Cripto is the founder member of the Cripto/FRL-1/Cryptic (CFC) family. Cripto is expressed in tumor tissues, and studies in the mouse have established an essential role for cripto in the formation of precardiac mes-oderm and differentiation into functional cardiomyocytes [41].
The T-box gene encoding eomesodermin (Eomes) is required for mesoderm formation and the morphogenetic movements of gastrulation. Lack of Eomes abrogates the formation of embryonic and extra-embryonic mesoderm [42]. It has been shown that Eomes is specifically required for the directed movement of cells from the epiblast into the streak in response to mesoderm induction [42]. Interestingly, we found a dramatically low level of T-Brachyury expression in BMP2+ cells compared to the control EBs. This result suggests that the BMP2+ cells represent a subset of a mesodermal pop-ulation whose formation is nearly complete at the time of BMP2 expression, which in turn downregulates T-Brachyury expression. However, this hypothesis does not rule out the possibility that the necessary signals from the non-BMP2 population to induce stronger T-Brachyury expression are eliminated due to puromycin selection. T-Brachyury is an essential gene for the mesoderm formation, as demonstrated in the mouse [43]. Mesp1 and Mesp2 are basic helix-loop-helix transcription factors that are co-expressed in the ante-rior presomitic mesoderm just pante-rior to somite formation in the mouse embryo [44]. Furthermore, it has been shown that Mesp1 has a significant role in the epithelialization of somitic mesoderm and, therefore, it is assumed that Mesp2 is respon-sible for the rostro-caudal patterning process itself in the anterior presomitic mesoderm [44]. Recently, it has been shown that Mesp1 is expressed in almost all of the precursors of the cardiovascular system in the mouse, including the endothelium, endocardium, myocardium and epicardium [45]. Thus, the in vitro derived BMP2+ cells exhibit more mesodermal characteristics. This conclusion is further sup-ported by the derivation of most of the mesodermal tissues and complete absence of endodermal phenotypes from these BMP2 cells in the later stages, as described below. Interest-ingly, Noggin, an antagonist of BMP2, is also expressed in the BMP2+ cells at a level higher than in ES cells but lower than in the control EBs. This contradiction might be explained on the basis that mesodermal cells exress Noggin and its expression is regulated by BMP2 [46,47]. Also, co-expression of Noggin
BIOCARTA Repression of pain sensation by the transcriptional regulator DREAM 3 8.7E-2
BIOCARTA IL12 and Stat4 dependent signaling pathway in Th1 development 4 8.8E-2
GOTERM_BP_5 Anatomical structure formation 3 9.0E-2
GOTERM_BP_5 Formation of primary germ layer 3 9.0E-2
GOTERM_MF_5 Bisphosphoglycerate mutase activity 2 9.0E-2
GOTERM_MF_5 Phosphoglycerate mutase activity 2 9.0E-2
GOTERM_BP_5 Phosphate metabolism 35 9.6E-2
BIOCARTA Rho-selective guanine exchange factor akap13 mediates stress fiber formation 3 9.7E-2
KEGG_PATHWAY Pyruvate metabolism 6 9.8E-2
KEGG_PATHWAY Regulation regulation of actin cytoskeleton 18 9.9E-2
[image:14.612.61.554.112.259.2]*Fold change >2, Student's t-test p value < 0.01. Count indicates the number of genes in the functional annotation category. The p value is from gene enrichment in annotation terms calculated by the Fisher's exact t-test.
Table 5 (Continued)
and glial fibrillary acidic protein (GFAP) in astrocytes has been reported [48].
BMP2+ cells lack endodermal phenotypes
Interestingly, transcripts of α-feto protein (AFP) and Sonic hedgehog (Shh) were not detectable in BMP2+ cells (Figure 2). AFP is a marker for the endoderm-derived hepatocytes. The expression pattern of Shh studied in several species indi-cates that Shh is essential for endoderm-derived organ devel-opment, such as foregut, gut, and gastrointestinal duodenal and pancreas development [49]. Also, other gene markers for endoderm, such as Foxa2, Hnf4a, Sox17, Transthyretin and Gata6 [50-54], are downregulated in the BMP2+ cells. These results show a dramatically reduced level or, more likely, the complete absence of the endodermal cell lineage.
The BMP2+ cell lineage contains neural crest stem cells
and their derivatives
[image:15.612.54.559.82.503.2]The BMP2+ cells showed enriched expression of ectodermal markers neurofilament (NF)-H and NF-M, but it is evident that the BMP2+ cells shared more mesodermal characteristics as described in the previous sections. Further investigation of this contradictory phenomenon led to the conclusion that these ectodermal markers may be more likely expressed by NCSCs. In agreement with our results, it was repeatedly reported that NCSCs share more ectodermal and less mesodermal characteristics [55-58]. Expression of the NCSC-specific p75NTR and Nestin transcripts at higher levels com-pared to the control EBs (Figure 3a,b) confirmed the increased presence of NCSCs in BMP2+ cells. In addition, astrocyte-specific GFAP and melanocyte-specific tyrosine Expression of pluripotent, trophectodermal, mesodermal, and endodermal gene markers in BMP2+ cells
Figure 2
Expression of pluripotent, trophectodermal, mesodermal, and endodermal gene markers in BMP2+ cells. (a) RT-PCR analysis for the representative genes. (b-d) Relative expression level of the genes presented in (a) and additional representative genes as obtained by Affymetrix analysis. The expression levels of each gene were normalized with its maximum level set as 100%. Each result was an average of three independent experiments (Additional data file 13).
BMP2
+ cells
ES cells 4d EBs 7d EBs
(b)
(a)
(c)
(d)
0
Rex1
0
BMP2 T
Eom
es
Mesp
1
Mesp
2
Nod
al
Activ
in
Crip
to-1
0 20 40 60 80 100 120 140
Afp Shh
Foxa2 Hnf4a Sox17
Transthyretin Gata6
Relative expression
Relative expression
Relative expression
Eomesodermin
T-bra
Activin
Cripto-1 BMP2
AFP
Nodal
Nanog Oct4
Mesp1
Mesp2
GAPDH Mash2
Cdx2
Shh
Nanog Oct4
140 120 100 80 60 40 20 120 100 80 60 40 20
ES cell 7d control EB
phosphatase 1 (Tyrp1) in BMP2+ cells (Figure 3a) confirmed the presence of NCSC-derived lineages in the BMP2+ lineage as well. Expression of p75NTR in BMP2+ cells was further con-firmed by immunostaining with an antibody against p75NTR in BMP2+ cells (Figure 3c, left panel). Furthermore, the pres-ence of glial cells in BMP2+ cells has been confirmed by immunostaining with an antibody against GFAP (Figure 3c, right panel). Notably, it has been reported that the differenti-ation of NCSCs into their lineage fates is mainly dependant on the presence of BMP2 at the required threshold level and also the availability of other factors, such as TGFβ1, Wnt1, Ihh and BMP4, in combination [56]. It was well demonstrated that exogenous addition of recombinant BMP2 to cultured NCSCs isolated from chicken explants of cranial and trunk dorsal neural folds from stage 8/9 embryos resulted in the differen-tiation of NCSC into glia, melanocytes and smooth muscle cells [56]. Expression of smooth muscle α actin (SMA) was also detected in the differentiated BMP2+ cells (Figure 4).
It is surprising to note that the local concentration of BMP2 secreted by BMP2+ cells themselves is able to induce the dif-ferentiation of NCSCs into their lineages without the exoge-nous addition of BMP2.
During vertebrate embryonic development, when the noto-chord induces the transformation of surface ectoderm to neu-roectoderm, a multipotential middle cell layer develops with characteristics of both cell types. These cells are the neural crest cells. They migrate dorsolaterally to form the neural crest, a flattened irregular mass between the surface ecto-derm and neuroectoecto-derm. This layer of cells separates into right and left portions and then migrates to various locations within the embryo to give rise to most structures of the peripheral nervous system, such as Schwann and glia cells of the autonomic and enteric nervous systems, endocrine cells, such as the adrenal medulla, and C-cells of the thyroid as well as non-neural tissues, such as pigment cells of the skin and
Analysis of neural crest stem cell associated transcripts in BMP2+ cells
Figure 3
Analysis of neural crest stem cell associated transcripts in BMP2+ cells. (a) RT-PCR analysis for the representative genes associated with NCSCs. (b) Relative expression level of the genes presented in (a) as obtained by Affymetrix analysis. The expression levels of each gene were normalized with its maximum level set as 100%. Each result is an average of three independent experiments (Additional data file 13). (c) Detection of p75 and GFAP in BMP2+ cells labelled by immunohistochemistry. Immunuostainings with anti-p75 (left panel) and anti-GFAP (right panel) to show the presence of NCSCs and the astrocytes, respectively, in BMP2+ cells one day after plating (7 + 1 days in total).
(c)
f ES cells 4d EBs 7d EBs BMP2
+ cells
(b)
50 µm 20 µm
p75 NTR
Nestin
NF-M
GAPDH NF-H SMA Tyrp1
c-Kit
Wnt1
0 20 40 60 80 100 120 140
c-Kit Tyrp1 SMA p75 Nestin NF-M NF-H Wnt1
ES cell 7d control EB
BMP2+
Relative expression
internal organs, smooth muscle of the cardiac outflow tract and great vessels, pericytes, craniofacial bones, cartilage and connective tissues [59,60].
Wnt1 and c-kit are well known mediators of melanocyte dif-ferentiation of NSCS [61,62] and are found to be expressed in the BMP2+ population. The tyrosine kinase c-kit has been found in the cell membranes of haematopoietic stem cells, primordial germ cells and presumptive subepidermal melanocytes [63]. Intriguingly, wnt-1 and BMP2 act synergis-tically to suppress differentiation and to maintain NCSC marker expression and multipotency by combinatorial Wnt1/ BMP2 signaling [64].
The presence of Wnt1 transcripts in the BMP2+ cell popula-tion may be interpreted in two ways: first, Wnt1 may be involved in the maintenance of NCSCs in their pluripotency state in combination with BMP2; and second, Wnt1 may be involved in driving the differentiation of NCSCs into melano-cytes. Both possibilities cannot be ruled out in the BMP2+ cell population since it includes proliferating NCSCs on the one hand (increased cell number when subjected to immunos-taining) and melanocytes in the same culture on the other hand. The local BMP2 and/or Wnt1 gradient may drive the
NCSCs to produce smooth muscle cells, pericytes, or melano-cytes or to remain in their pluripotent state, respectively.
This is the first study that enables us to selectively obtain ES cell-derived NCSCs and their derivatives all at the same time via a BMP2 promoter-based lineage selection approach. The co-expression of Wnt1 and BMP2 indicates the existence of an environment to both keep the NCSCs in stemness and to enable ongoing differentiation of NCSCs to form melano-cytes. Thus, the study of these BMP2-expressing cells during early differentiation of ES cells will pave the way for a better understanding of NCSCs and their differentiation into line-ages. The BMP2+ cells derived from the ES cells may serve as an ideal model for neural crest stem biology in the future since the NCSCs and their derivatives can be selectively enriched by the BMP2 promoter-driven lineage selection approach. In addition, it provides a valuable system where the enriched NCSCs prime themselves to differentiate into their cell specific lineages, since the enriched NCSCs secrete BMP2 and cause a BMP2 gradient, which negates the need for sup-plying exogenous BMP2. Noggin, an inhibitor of BMP2, can be used to keep the NCSCs in a plastic state. Once the proce-dures for maintaing BMP2-derived NCSCs in a state of plas-ticity have been fine tuned, they will be potential candidates Detection of smooth muscle cells after differentiation of the BMP2+ cells
Figure 4
Detection of smooth muscle cells after differentiation of the BMP2+ cells. (a) Expression of SMA in the BMP2+ cells detected by qRT-PCR. (b) Microarray relative expression levels of various smooth muscle specific genes in BMP2+ cells. The expression levels of each gene were normalized with its maximum level set as 100%. Each result is an average of three independent experiments (Additional data file 13). (c) Detection of smooth muscle cells 1 day after plating the BMP2+ cells (7 + 1 days in total; top left), 8 days after plating with puromycin (7 + 8 days in total; top right), 18 days after plating with puromycin (7 + 18 days in total; bottom left) and 18 days after plating without puromycin (7 + 18 days in total; bottom right).
(c)
ES cells 4d EBs 7d EBs BMP2 + cells
SMA
GAPDH
(b)
20 µm20 µm 50 µm
20 µm
0 20 40 60 80 100 120 140
Calponin 1 SM22-alpha SMA
BMP2+
Relative expresion
(a)
for cell replacement therapy, since they can differentiate into any tissue depending upon the local environment of the tissue in which they are injected.
BMP2+ cells contain predominantly smooth muscle
cells
As indicated in Figure 4a, expression of SMA in the BMP2+ cells is enriched compared to the control EBs. In addition, the microarray data confirm the upregulation of SMA and other smooth muscle specific genes, such as those encoding cal-ponin and SM22-α, in the BMP2+ cell population compared to control EBs (Figure 4b). The immunostaining of smooth muscle cells has been performed with an antibody against SMA, 1 day after plating the BMP2+ cells (7 + 1 days in total), 8 days after plating with puromycin (7 + 8 days in total), 18 days after plating with puromycin (7 + 18 days in total) and 18 days after plating without puromycin (7 + 18 days in total) (Figure 4c). Detection of smooth muscle cells even 18 days after puromycin treatment indicates that smooth muscle cells express BMP2 and, therefore, survive the puromycin treatment [65]. It is noteworthy that the number of SMA pos-itive cells was less in the culture in which puromycin treat-ment continued compared to the culture in which puromycin treatment was discontinued. The inhibitory effect in these cultures is more likely due to BMP2 since recent reports dem-onstrated that BMP2 inhibits proliferation of smooth muscle cells [66,67]. Simultaneously, the formation of smooth mus-cle cells from their precursors is crucially dependant on the phenotypic inductive role of BMP2 [68].
BMP2+ cells give rise to cardiomyocytes under EB
conditions
The expression of the cardiac marker genes NKx2.5, MLC-2a, α-cardiac actin and Mef2c is reduced in the BMP2+ cells com-pared to the control EBs (Figure 5a,e). This suggests that cardiomyogenesis is repressed in the BMP2+ cells. Accord-ingly, Mesp1 was repressed (Figure 2a).
EBs prepared from a mixture of BMP2+ cells with wild-type ES cells in ratios of 1:1, 1:2, 1:4, 10:1, 50:1, 1:10 and 1:50, respectively (using the hanging drop protocol and applying the differentiation protocol as outlined in Figure 5b and also previously described [69]), did not augment/delay the onset of contractile activity in comparison to control wild-type EBs as observed on day 12. Also, there were no significant differ-ences in terms of the magnitude of the intensity of the con-tractility (data not shown). This corresponds to the observation that BMP2 added during the differentiation of ES cells did not enhance cardiomyogenesis [70]. Compared to the CGR8 wild-type and β-actin control cells, culturing of the BMP2+ cells for even a further 28 days (35 days in total) in the presence or absence of puromycin did not result in beating clusters of cardiac cells (data not shown). These results sug-gest that the plated BMP2+ cells did not contain mature beat-ing cardiomyocytes at this stage. In order to investigate the cardiomyogenic potential of the BMP2+ cells to differentiate
into cardiac beating cells, EBs were made from the BMP2+ cells using the hanging drop protocol and the differentiation process was observed in comparison to the EBs formed by cells from control EBs. The secondary EBs made from the BMP2+ cells were contracting on day 11, similarly to the sec-ondary EBs formed by cells from seven-day-old control CGR8 wild-type EBs that were not treated with puromycin, as well as EBs made from the β-actin CGR8 clone transfected with β -actin promoter-driven puromycin resistance and EGFP expression cassettes that were treated with puromycin in the same way as the secondary BMP2+ EBs. Notably, the intensity of contraction in the BMP2+ EBs was significantly stronger compared to that in both controls (Additional data file 10). The whole EB was contracting in a jellyfish-like fashion compared to the controls (Figure 5c; Additional data files 11 and 12). The contracting areas persisted for more than a week, which was longer than in the control EBs. In order to investi-gate whether the increased beating activity of the cardiomyo-cytes generated from the BMP2+ cells correlates with increased expression of cardiomyocyte specific transcripts, we determined the expression of α-cardiac actin and α-MHC in secondary EBs at day 11. Increased expression levels of both cardiac specific genes was observed in the EBs generated from BMP2+ cells compared to both the control secondary EBs (Figure 5d). Thus, BMP2+ cells have the capacity to develop into cardiomyocytes. Interestingly, the cardiomyo-genic potential apparently seems to be regulated by the BMP2+ lineage cells only. These findings suggest that the BMP2+ cells are primed to become cardiomyocytes independ-ently of the other, BMP2 negative lineage cells. However, nei-ther the secondary EBs maintained on puromycin nor the contractile secondary EBs when treated with puromycin con-tained cardiomyocytes. The question of whether the cardio-myocyte precursors contained in the BMP2+ cell population are the transient derivatives of the NCSCs or another cell lin-eage needs to be investigated, since NCSCs are also capable of differentiating into cardiomyocytes [59,60]. However, although the BMP2+ cells are capable of differentiating into beating cardiomyocytes, further extensive investigations are required to demonstrate the cardiogenic potential of these cells in detail, as previously described for ES cell-derived car-diomyocytes [71].
Vascular and haematopoietic cell gene markers from the BMP2+ cell population
Expression of c-kit and CD34 and Runx1 indicates the pres-ence of haematopoietic stem cells in the BMP2+ population (Figure 6a,b). Ihh, which is implicated in haematopoiesis and vasculogenesis [72] is also expressed in the BMP2+ cells but its expression level is lower than that of the control cells. Flt-1, also known as vascular endothelial growth factor receptor 1 (VEGFR-1), is a high-affinity tyrosine kinase receptor for vas-cular endothelial growth factor and is normally expressed only in vascular endothelial cells. However, the Flt-1 tran-script was recently found to be expressed in human periph-eral blood monocytes [73]. Monocytes are known to differentiate into a variety of cell types, such as osteoclasts in bone, dendritic cells in the immune system and mature mac-rophages in a number of tissues, for example, Kupffer cells in
liver [73]. Expression of Flt-1 and c-fms in the BMP2+ popu-lation indicates the possible existence of a monocyte-macro-phage lineage in these cells.
BMP2+ cells give rise to osteoblasts and express gene
markers for satellite cells and fibroblasts
[image:19.612.56.554.86.467.2]Expression of osteopontin, Cbfa, osteocalcin and alkaline phosphatase in BMP2+ cells showed the possible occurrence of osteoblasts (Figure 7a). BMP2+ cells plated and maintained in the differentiation medium with puromycin showed Ali-zarin red positive clusters after 18 days (Figure 7b), which indicates the first appearance of osteoblasts. After 35 days of culturing in the presence of puromycin, areas brightly stained with Alizarin red were observed, confirming the occurrence of Differentiation of the BMP2+ cells to cardiac cells
Figure 5
Differentiation of the BMP2+ cells to cardiac cells. (a) RT-PCR analysis of the cardiac markers in BMP2+ cells and other controls. (b) Schematic outline of the protocol used to derive cardiomyocytes from BMP2+ cells. (c) The morphology of the contracting EBs. The red arrows indicate the contracile area(s) in that EB. (d) RT-PCR analysis of the representative cardiac markers in 12 day secondary EBs derived by the hanging drop protocol from single cell suspension obtained from seven-day-old primary EBs generated by the protocol outlined in Figure 1 from CGR8 wild-type EBs without puromycin treatment, β-actin puro EGFP EBs and BMP2 EBs with puromycin treatment (videos of the beating clusters in these populations are provided as Additional data files 10-12). (e) Graph showing the relative expression levels of the genes presented in (a) as obtained by Affymetrix analysis. The expression levels of each gene were normalized with its maximum level set as 100%. Each result is an average of three independent experiments (Additional data file 13).
Troponin T
Mef2c
GAPDH Nkx2.5
(a)
Hand1 Cardiac actin
BMP2 + cells
ES cells 4d EBs 7d EBs
(b)
7 day CGR wt EB 7 day β-actin puro GFP EBs BMP2+ cells
Prepare single cell supension by trypsinisation with a titre of 25,000 cells/ml
Lid
PBS
Medium
Onset of contractile areas Day 2
Day 0 Lid
Day 12
Hanging drop protocol
GAPDH
CGR8 wt BMP2 +
β-actin GFP cells
(d)
100µm
(c)
(e)
200
0 20 40 60 80 100 120 140 160
Troponin T
Nkx2-5 ACTC1 Hand1 Mef2c Gata4 α-MHC Myocd
7d control EB BMP2+
Relative expression
ES cell μm 200μm 200μm
-cardiac actin α