International Journal of Emerging Technology and Advanced Engineering
Website: www.ijetae.com (ISSN 2250-2459, UGC Approved List of Recommended Journal, Volume 8, Issue 4, April 2018)179
Intelligent Techniques for Gene Expression Datasets
Akil Z. Surti
1, Priyanka Sharma
21Research Scholar, GTU, Ahmedabad, India 2Professor, Raksha Shakti University, Ahmedabad, India
Abstract—A DNA Microarrays, size of a microscope slide
or even smaller has made it possible for scientists to perform an experiment to analyse expression levels for tens of thousands of genes at a same time. Microarrays provide a relatively rapid, reliable, reproducible, and quantitative approach for simultaneously monitoring expression levels of thousands of genes. It has been used as a technology for analysing changes in the gene expression level and genomic changes that are caused due to diseases. The analysis of relatively large datasets generated in a typical microarray experiment is better done using artificial intelligence rather than traditional approach. In this paper, we are going to discuss feature selection and classification techniques based on artificial intelligence, which we believe will help improve analysis of gene expressions.
Keywords—DNA, Microarrays, Gene expression analysis,
feature selection, classification, Artificial Intelligence.
I. INTRODUCTION
A biological experiment involves the analysis of huge volume of data. One such type of large-scale experiment involves examining the expression levels of thousands of genes at the same time under a particular condition, called gene expression analysis. DNA Microarray technology makes this possible and the quantity of data generated from each experiment is enormous.
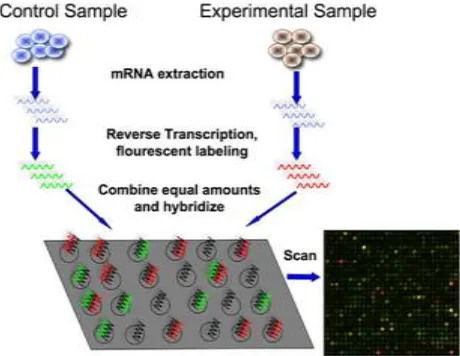
[image:1.612.330.560.208.386.2]DNA Microarrays has become one of the significant analysis tools for biologists / researchers to examine expression levels of the genes in a given sample. DNA microarrays is a size of microscope slide with systematic arrangement of spots that arrange very small amounts of hundreds or thousands of gene sequences on a single slide. A microarray may contain hundreds of spots and each spot may contain few million identical DNA molecules that uniquely correspond to a gene. The spots are created on to the glass slide by robot or with the process of photolithography. The precise location and sequence of each spot is recorded in a computer database.
Fig. 1 Working of a DNA Microarray Technology
To find out which genes are active and which are inactive in a given cell, one must first collect the messenger RNA molecules present in that cell. Then one should label mRNA to the complementary cDNA. The diseased and the normal samples are labeled with different fluorescent dyes. Next, one should place the labeled cDNAs onto a DNA microarray slide. The labeled cDNAs that represent mRNAs in the cell will then hybridize – or bind – to their synthetic complementary DNAs attached on the microarray slide, leaving its fluorescent tag. Then one must use a special scanner to measure the fluorescent intensity for each spot/areas on the microarray slide
International Journal of Emerging Technology and Advanced Engineering
Website: www.ijetae.com (ISSN 2250-2459, UGC Approved List of Recommended Journal, Volume 8, Issue 4, April 2018)180
II. FEATURE SELECTION TECHNIQUES
Microarrays generate thousands of gene expression measurements, which generally are used for study of gene expression differences. Optimum gene selection from such gene expression datasets and their classification plays an important role for disease prediction and diagnosis. In this section we have discussed three feature selection techniques such as Biogeography based Optimization (BBO), Genetic Algorithm (GA) and Artificial Bee Colony (ABC).
A. Biogeography Based Optimization
Biogeography-based optimization (BBO), proposed by Dan Simon [8] in 2008, is a new entrant in the domain of global optimization based on the theory of biogeography. BBO is developed through simulating the emigration and
immigration of species between habitats in the
multidimensional solution space, where each habitat represents a candidate solution. Just as species, in biogeography, migrate back and forth between habitats, features in candidate solutions are shared between solutions through migration operator. Good solutions tend to share their features with poor solutions. However, these features, in the origin good solution, may exist in several solutions, both good and poor solutions, which may weaken exploration ability.
In BBO algorithm, each possible solution is a habitat, and their features that characterize suitability are called suitability index variables (SIVs). The goodness of each solution is named as habitat suitability index (HSI). In BBO, a habitat H is a vector of N values (SIVs) reaching global optima through migration step and mutation step. In original migration, information is shared among habitats based on the immigration rate λi and emigration rate μi which are linear functions of the number of species in the habitat. The linear model can be calculated as follows:
λi = I(1 – i/n) μi = Ei / n
where E is the maximum possible emigration rate, I is the maximum possible immigration rate, n is the maximum number of species, and i is the number of species of the ith solution.
Ranks are assigned to the solutions based on their fitness. The fitness of each island represents the habitat suitability index (HSI) of the island. HSI indicates the suitability the island for species residence. Islands with high HSI have high emigration rate and low immigration rate. Islands with low fitness will be having low emigration rate and high immigration rate.
BBO is successful in selecting a good set of features providing comparable classification results. As compared to very typical implementations of gene selection using genetic algorithms and other EAs like PSO, which usually work over many generations with large population sizes, BBO (that with SVM and RF) for gene selection started showing better results very early with just 40-50 habitats in the ecosystem. 50 simulations each with generations varying from 15 to 40 were performed. The algorithms almost always converged to comparable results by the end of 25 generations with very minute differences in further generations.
B. Genetic Algorithm
Genetic algorithms (GAs) are search methods based on principles of natural selection and genetics. GAs encode the decision variables of a search problem into finite-length strings of alphabets of certain cardinality. In contrast to traditional optimization techniques, GAs work with coding of parameters, rather than the parameters themselves.
GAs are based on an analogy with the genetic structure and behaviour of chromosomes within a population of individuals using the following foundations:
Individuals in a population compete for resources and mates.
Those individuals most successful in each
'competition' will produce more offspring than those individuals that perform poorly.
Genes from `good' individuals propagate throughout the population so that two good parents will sometimes produce offspring that are better than either parent.
A population of individuals are maintained within search space for a GA, each representing a possible solution to a given problem. The GA aims to use selective `breeding' of the solutions to produce offspring better than the parents by combining information from the chromosomes.
The experimental results show that genetic algorithm is capable of finding feature subsets with better classification performance and/or smaller size than each single individual feature selection algorithm does. Besides this, the genetic algorithm can find some important features that are underrated by some individual algorithms. All of these suggest that genetic algorithm might be a viable and feasible approach for feature selection.
C. Artificial Bee Colony
International Journal of Emerging Technology and Advanced Engineering
Website: www.ijetae.com (ISSN 2250-2459, UGC Approved List of Recommended Journal, Volume 8, Issue 4, April 2018)181
A colony of honey bees can extend itself over long distances in order to exploit a large number of food sources at the same time.The searching bees are classified into three categories
1) Employed bees 2) Onlookers bees 3) Scout bees.
All bees that are currently exploiting a food source are known as employed bees. Employed bees exploit food sources and they carry the information about food sources back to the hive and share this information with onlooker bees.
Onlooker bees are waiting in the hive for the information to be shared by the employed bees. The employed bees shares the information about their discovered food sources and scout bees searches for the new food sources. Employed bees share information about food sources by dancing(Waggle dance) in the designated dance area inside the hive. The nature of dance is proportional to the nectar content of food source just exploited by the dancing bee.
An onlooker bee watches the dance and selects a food source according to the probability proportional to the quality of that food source. Therefore, good food sources attract more onlooker bees compared to bad ones. Whenever food source is exploited fully, all the employed bees related with it abandon the food source, and become scout. Scout bees can be visualized as performing the job of exploration, whereas employed and onlooker bees can be visualized as performing the job of exploitation.
As discussed by Ezgi Zorarpaci, ABC algorithm was experimented on fifteen datasets from the UCI Repository which are commonly used in classification problems. The experimental results showed that the proposed ABC algorithm was able to select good features for classification tasks by not reducing or least reducing classification accuracies.
III. CLASSIFICATION TECHNIQUES
Classification, a supervised learning technique is used in various disciplines of science. Classification plays an important role for disease prediction and diagnosis in Gene expression datasets. In this paper we have discussed three classification techniques such as K-Nearest Neighbours (KNN), Artificial Neural Network (ANN) and Support Vector Machine (SVM).
A. K Nearest Neighbours (KNN)
K-nearest neighbor classifier is one of the introductory supervised classifier proposed by Fix & Hodges in 1951 for performing pattern classification task.
The modest version of the K-nearest neighbor classifier algorithms is to predict the target label by finding the nearest neighbor class. The closest class will be identified using the distance measures like Euclidean distance. KNN algorithm is as follows:
Let (Xi, Ci) where i = 1, 2…n be data points. Xi denotes feature values & Ci denotes labels for Xi for each i. Assuming the number of classes as ‗c‘
Ci ∈ {1, 2, … c} for all values of i
Let x be a point for which label is not known, and we would like to find the label class using k-nearest neighbor algorithms.
Calculate ―d(x, xi)‖ i =1, 2,…n; where d denotes the Euclidean distance between the points.
Arrange the calculated n Euclidean distances in non-decreasing order. Let k be a positive integer, take the first k distances from this sorted list. Find those k-points corresponding to these k-distances.
Let ki denotes the number of points belonging to the ith class among k points i.e. k ≥ 0. If ki >kj ∀ i ≠ j then put x in class i.
KNN has several advantages, first in case of mislabelled training tuples, it will not have major effect on classification, second KNN is less prone to bias in in the data and more tolerable to noise since it makes use of several training tuples to determine the class of a test tuple and third it is well suited for multimodal classes.
B. Artificial Neural Network (ANN)
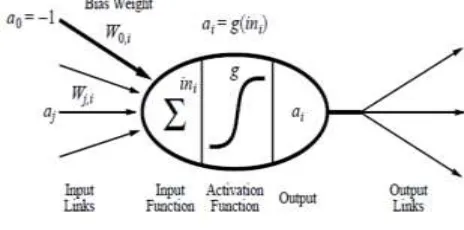
A neural network model which is the branch of artificial intelligence is generally referred to as artificial neural networks (ANNs). ANN is information processing paradigm inspired by biological nervous systems. ANN is composed of a system of neurons connected by synapses and it learns by example.
[image:3.612.335.567.559.674.2]
International Journal of Emerging Technology and Advanced Engineering
Website: www.ijetae.com (ISSN 2250-2459, UGC Approved List of Recommended Journal, Volume 8, Issue 4, April 2018)182
An artificial neural network is made up of many artificial neurons which are correlated together in accordance with explicit network architecture. The objective of the neural network is to convert the inputs into significant outputs. The teaching mode can be supervised or unsupervised. Neural Networks learn in the presence of noiseAs compared to other algorithms, ANN is easy to use, with few parameters to adjust. A neural network learns and reprogramming is not needed. ANN is also easy to implement and is applicable to a wide range of problems in real life.
C. Support Vector Machine (SVM)
Support Vector Machine (SVM), developed by Vapnik & Chervonenkis is an algorithm that was designed for pattern classification but has recently been adapted for finding regression and distribution estimation. Also, it is used in the field of bioinformatics.
[image:4.612.86.269.432.539.2]A SVM builds a hyper-plane or a set of hyper-planes in high or infinite dimensional space, used for classification. The basic idea is shown in figure 3. The data points are identified as being positive or negative, and the problem is to find a hyper-plane that separates the data points by a maximal margin.
Fig. 3 Data Classification
For a dataset consisting of features set and labels set, an SVM classifier builds a model to predict classes for new data points. It assigns data points to one of the classes. If there are only 2 classes then it can be called as a Binary SVM Classifier. SVM classifiers can be of two types: Linear SVM Classifier and Non-Linear SVM Classifier.
In a linear SVM classifier, assumption is made that training examples plotted in space. These data points are expected to be separated by an apparent gap. It predicts a straight hyper-plane dividing 2 classes. The prime focus while drawing the hyper-plane is on maximizing the distance from hyper-plane to the nearest data point of either class. The drawn hyper-plane is called as a maximum-margin hyper-plane.
In the real world, datasets are generally dispersed up to some extent. To solve this problem separation of data into different classes on the basis of a straight linear hyper-plane won‘t be an effective technique. For this Vapnik suggested creating Non-Linear Classifiers by applying the kernel trick to maximum-margin hyper-planes. In Non-Linear SVM Classification, data points are plotted in a higher dimensional space.
In SVM, a separating function can be expressed as a linear combination of kernels associated with the Support Vectors as
where xi denotes the training patterns, yi ∈ {+1, −1} denotes the corresponding class labels and S denotes the set of Support Vectors.
According to Sagar S Nikam, SVM has high accuracy and it works well even if data is not linearly separable in the base feature space
.
IV. CONCLUSION
This paper discussed various artificial intelligence based feature selection (BBO, GA, ABC) and classification (KNN, ANN, SVM) techniques. Each of these methods can be used in various situations as needed where one tends to be useful while the other may not and vice-versa depending on the datasets. Each techniques discussed has its own advantages when applied to gene expression datasets. Based on the conditions, requirements and datasets, each one as needed can be selected based on their performance and feature.
REFERENCES
[1] S. Nikumbh, S. Ghosh and V. K. Jayaraman, ―Biogeography-Based Informative Gene Selection and Cancer Classification Using SVM and Random Forests‖, 2012.
[2] K. Sarvanan, and S. Sasithra, ―Review on Classification based on Artificial Neural Networks‖, International Journal of Ambient Systems and Applications, Vol.2, No.4, 2014.
[3] S. Nikam, ―A Comparative Study of Classification Techniques in Data Mining Algorithms‖, Oriental Journal of Computer Science & Technology, ISSN: 0974-6471, Vol. 8, No. 1, Pg. 13-19, 2015. [4] Y. Lu and J. Han, ―Cancer Classification Using Gene Expression
Data‖.
[5] O. Sutton, ―Introduction to k Nearest Neighbour Classification and Condensed Nearest Neighbour Data Reduction‖, 2016.
International Journal of Emerging Technology and Advanced Engineering
Website: www.ijetae.com (ISSN 2250-2459, UGC Approved List of Recommended Journal, Volume 8, Issue 4, April 2018)183
[7] G. Gunavathi and K. Premalatha, ―Performance Analysis of GeneticAlgorithm with kNN and SVM for Feature Selection in Tumor Classification‖, International Journal of Computer, Electrical, Automation, Control and Information Engineering, Vol. 8, No. 8, 2014.
[8] T. V. Vishal, S. Srinidhi, S. Srividhya, K. Vishnu Kumar and R. Swathika, ―A Survey and Comparison of Artificial Intelligence Techniques for Image Classification and Their Applications‖, International Journal of Science and Research (IJSR), ISSN: 2319-7064, Vol. 5, Issue 4, 2016.
[9] R. Garg and S. Mittal, ―Optimization by Genetic Algorithm‖, International Journal of Advanced Research in Computer Science and Software Engineering, Vol. 4, Issue 4, 2014.
[10] M. P. Padma and G. Komorasamy, ―A modified algorithm for clustering based on particle swarm optimization and k-means‖, International Conference on Computer Communication and Informatics, 2012.
[11] O. A. Mohamed Jafar and R. Sivakumar, ―Ant-based Clustering Algorithms: A Brief Survey‖, International Journal of Computer Theory and Engineering, Vol.2, No. 5, 2010.
[12] R. Radha, ―Gene Expression Analysis‖, International Journal of Advanced Science and Technology, Vol. 33, 2011.
[13] S. Tabakhi, P. Moradi and F. Akhlaghian, ―An Unsupervised feature selection algorithm based on ant colony optimization‖, The International Journal of Intelligent Real-Time Automation, ISSN: 0952-1976, Vol. 32, 2014.
[14] D. Simon, ―Biogeography-based Optimization‖, IEEE Transactions on Evolutionary computation, vol. 12, no. 6, pp. 702-713, 2008 [15]
http://advancedmathematicalresearch.blogspot.in/2015/02/artificial-intelligenceneuronsneural.html
[16] https://www.doc.ic.ac.uk/~nd/surprise_96/journal/vol1/hmw/article1 .html.
[17] http://bitesizebio.s3.amazonaws.com/content/uploads/2011/07/cDN A-microarray-experiment.jpg.
[18] Z. Cai, W. Gong, and C. X. Ling, ―Research on a novel biogeography-based optimization algorithm based on evolutionary programming,‖ System Engineering Theory and Practice, vol. 30, no. 6, pp. 1106–1112, 2010.