International Journal of Emerging Technology and Advanced Engineering
Website: www.ijetae.com (ISSN 2250-2459,ISO 9001:2008 Certified Journal, Volume 4, Issue 1, January 2014)
221
Heart Rate Detection from Photoplethysmography- A
Comparative Study
Priya Ranjan Satapathi
1, Parna Saha
21,2
Calcutta Institute of Engineering and Management, 24/1A Chandi Ghosh Road Kolkata -40
Abstract— Photoplethysmography is a simple way for heart rate detection. However due to low level of detected signal, easily prone to motion artifacts and noise. In this paper DWT method is used to reduce the effect of noise, thereby calculate the heart rate. A comparative study of detecting heart rate using different mother wavelet is also discussed.
Keywords— Heart beats, ECG, Photoplethysmography, Peak detection, Wavelet, DWT, db4.
I. INTRODUCTION
Heart rate or pulse rate is the number of heart beats per minute. The heart rate is one of the significant physiological parameter all critical care units should have to get track of the condition of the heart. Heart rate variation may depend on physical exercises, sleep, drugs, mental stress and other physiological conditions [1-3]. ECG is one of the finest ways to detect heart rate precisely. But ECG lags in the field of patient convenience. The leads and paste used in ECG may cause inconvenience to the patient [4], as a result the variation in heart rate may occur. Recent advancement in medical instrumentation increases the use of photo plethysmography (PPG) for quickest, safest, convenient, simple, easy and economical tool for finding heart rate. [5-6]. PPG has been commonly used in home care, sport medicine, ambulances, during surgery and other continuous patient monitoring system. [7-12]
The PPG is a noninvasive method for recording pulse wave from fingertips. Pulse wave is generated by heart activity and blood circulation through vascular system. The aim of this study is the signal processing and evaluation of bio-signal for diagnosis support use through proper algorithms [13].On comparison of records obtained from big number of measurements done for many patients of the same category. The PPG signal is taken from MIT database.
The main problem of PPG signal is low level of detected signal and noise caused from motion artifacts from movement of the patient. The wavelet transform is used for limiting the noise, so that heart rate can be detected easily and accurately.
II. METHODOLOGY
Wavelet transform are generally used for data compression, edge detection, de-noising etc [5]. Here, wavelet is used for minimizing the noise.
After wavelet decomposition, the high frequency sub bands contain most of the noise and low frequency sub bands most of the signal information.
Noise generated by motion artifacts is mostly minimized by decomposing the PPG signals into a set of wavelet sub bands. The peaks are detected using some threshold value of the reconstructed signal.
Wavelet transform is concept of applying convolution of the signal with a small wave which is shifted from the start to end of the signal. The small wave, called wavelet. This is cause for amplifying a particular frequency based on the scale it uses. As the scale changes, the wavelet transform emphasizes different frequencies in the signal. There are two types of wavelet transform- continuous and discrete wavelet transforms [5].
The continuous wavelet transform (CWT) mathematically represents as
( )
√ ∫ ( ) (
) ….(i)
In the equation child wavelet is the version of mother wavelet which is scaled by a factor a and shifted by t. is the continuous wavelet transform of the signal x(t) .
Discrete wavelet transform (DWT) is used for this experiment analysis because it provides sufficient information for analysis and synthesis of the original signal with significant reduction of computational time [14].In DWT the signal is passed through a series of high pass filters and through a series of low pass filters to analyze the high frequencies and low frequencies respectively. The resolution of the signal which is a measure of amount of detail information of the signal is changed by filtering operation. The frequency scale is changed by upsampling and downsampling.
The unprocessed discrete signal x[n] is passed through half band highpass h[n] and lowpass l[n] filters creating two subbands both sampled at half of the original frequency.
These filters approximate halfband FIR filters that are determined by the choice of wavelet. The bandwidth of each filter output and subband is a fraction of sampling frequency equal to the Nyquist rate of half of the samples can be eliminated. One level of decomposition is expressed by
[ ] ∑ [ ] [ ] ………(ii)
International Journal of Emerging Technology and Advanced Engineering
Website: www.ijetae.com (ISSN 2250-2459,ISO 9001:2008 Certified Journal, Volume 4, Issue 1, January 2014)
222
Where l term denotes the lowpass filter output and h term denotes the high pass filter output [15]. This decomposition is reapplied to the low subband output repeatedly which has the effect of doubling the frequency resolution band reducing the time resolution by the factor of two since half the number of samples now makes up the signal. This subband coding procedure is repeated for a number of levels of decomposition and every decomposion results in half the number of samples and thereby decreasing the time resolution by a factor of 2 and taking half the frequency band there by doubling the frequncy resolution. Only ideal half band filter such as various wavelet filter banks allow the perfect reconstruction of the original signal.III.RESULTS
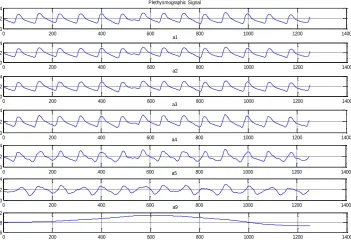
[image:2.595.121.473.319.571.2]PPG data from MIT database is taken for analysis. The input signal is denoised using different mother wavelet and the heart rate is estimated. The acquired data is transformed using wavelet transform with the help of Matlab algorithms, the original data used is sampled 250Hz. the 9th level down sampling will filtered out most of the high frequency component and as well as low frequency component. Different decomposition levels are shown in figure 1.
Figure 1
0 200 400 600 800 1000 1200 1400
0 2 4
Plethysmographic Signal
0 200 400 600 800 1000 1200 1400
0 2 4
a1
0 200 400 600 800 1000 1200 1400
0 2 4
a2
0 200 400 600 800 1000 1200 1400
0 2 4
a3
0 200 400 600 800 1000 1200 1400
0 2 4
a4
0 200 400 600 800 1000 1200 1400
0 2 4
a5
0 200 400 600 800 1000 1200 1400
1.6 1.8 2
International Journal of Emerging Technology and Advanced Engineering
Website: www.ijetae.com (ISSN 2250-2459,ISO 9001:2008 Certified Journal, Volume 4, Issue 1, January 2014)
[image:3.595.112.487.151.681.2]223
Figure 2Figure 3
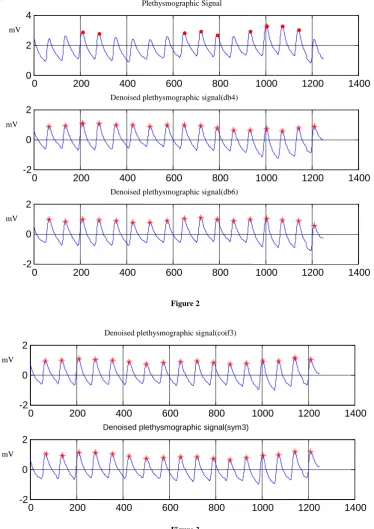
For simplification uniform threshold is taken for peak detection. Peak detection is performed on raw signal before any transformation. Using wavelet transform and denoising, peak detection is performed. Denoising operation was done using different mother wavelet db4, db6, sym3, coif3, bior2.2, bior3.3and haar.
The denoised plethysmographic signals are generated by different mother wavelets, shown in figure2 and figure 3. Heart rate is detected from different denoised data. Table 1 shows a comparative study of heart rate detected after denoising though different mother wavelets. Percentage of error is calculated in Table 2.
0 200 400 600 800 1000 1200 1400
-2 0 2
Denoised plethysmographic signal(coif3)
mV
0 200 400 600 800 1000 1200 1400
-2 0 2
Denoised plethysmographic signal(sym3)
mV
0 200 400 600 800 1000 1200 1400
0 2 4
Plethysmographic Signal
mV
0 200 400 600 800 1000 1200 1400
-2 0 2
Denoised plethysmographic signal(db4)
mV
0 200 400 600 800 1000 1200 1400
-2 0 2
Denoised plethysmographic signal(db6)
International Journal of Emerging Technology and Advanced Engineering
Website: www.ijetae.com (ISSN 2250-2459,ISO 9001:2008 Certified Journal, Volume 4, Issue 1, January 2014)
224
TABLE 1Comparative study of different mother wavelet for heart rate detection Patient
sl.no.
Heart rate from actual data
Heart rate from denoised data(using different mother wavelet)
db4 db6 sym3 coif3 bior2.2 bior3.3 haar
Patient_1 102 102 102 102 102 102 102 114 Patient_2 42 48 54 60 54 48 66 72 Patient_3 84 84 84 84 84 66 84 114 Patient_4 138 144 138 144 138 138 132 156 Patient_5 114 114 108 114 114 114 114 120 Patient_6 72 72 72 72 72 60 66 84 Patient_7 102 108 108 108 108 108 90 120
TABLE 2
Percentage of error of detected heart rates Patient sl.no. Percentage of error for different mother wavelet(%)
db4 db6 sym3 coif3 bior2.2 bior3.3 haar
Patient_1 0 0 0 0 0 0 11.7647 Patient_2 14.2857 28.5714 42.8571 28.5714 14.2857 57.1428 71.4285 Patient_3 0 0 0 0 -21.4286 0 35.7142 Patient_4 4.3478 0 4.3478 0 0 -4.3478 13.0434 Patient_5 0 -5.2631 0 0 0 0 5.2631 Patient_6 0 0 0 0 -16.6667 -8.3333 16.6666 Patient_7 5.8823 5.8823 5.8823 5.8823 5.8823 -11.7647 17.6470
IV. DISCUSSION
Original heart rate is compared with different mother wavelets detecting heart rate from noise free signals, it is found from table 2 that coif3 , db4, sym3 mother wavelet are more appropriate for noise elimination. This result indicates different wavelet down sampled elimination can effectively improve the signal to noise ratio and accurately detect the heart rate.
REFERENCES
[1] Mateo, J. and Laguna, P. 2003. Analysis of heart rate variability in the presence of ectopic beats using the heart timing signal. IEEE Trans. Biomed. Eng., 50, 334-343.
[2] 2. Nakamura, T., Hario, H., Miyashita, S., Chaiba, Y. and Sato, S. 2005. Identification of development and automatic nerve activity from heart rate variability in preterm infants. Biosystems, 79, 117-224.
[3] Makikallio, T. H., Huikuri, H.V., Makikallo, A., Sourander, L.B., Mitrani, R.D, Castellanos, A. and Myerburg, R.J. 2001. Prediction of sudden cardiac death by fractal analysis of heart rate variability in elderly subjects. J. Am. Coll. Cardiol. , 37, 1395-1402. [4] Fu, T.H., Liu, S.H. and Tang, K.T. 2008. Heart rate from
photoplethysmogram waveform using wavelet multi-resolution analysis”, Journal of medical and biological Engg. Tech. Note, 28(4), 229-232.
[5] Soni, S.S. and Namjoshi, Y.A. 2010. Delinearation of raw plethysmograph using wavelets for mobile based pulse oximeters. In Proceedings of 5th ICES, Mobile communication and
computing, 74-84.
[6] Elgendi, M. 2012. On the analysis of fingertip photoplethysmogram signals. Current cardiology reviews, 8, 14-25.
[7] Wendelken, S., Linder, S. and MaGrath, S. 2006. A preliminary study of respiratory variations in the photoplethysmogram during lower body negative pressure, In Proceedings of the 19th IEEE
Int.Symp. on Computer-Based Medical Systems, 391-395. [8] Wong, A., Pun, K.P., Zhang, Y.T. and Hung, K. 2005. A near –
infrared heart rate measurement IC with very low cutoff frequency using current steering technique. IEEE Trans. Circuit Syst.I-Regul.Pap., 52, 2642-2647.
[9] Johnston, W. and Mendelson, Y. 2005. Extracting heart rate variability from a wearable reflectance pulse oximeter. In Proceeding of the IEEE 31st Annual Northeast Bioengineering Conf., 157-158.
[10] Linder, S.P., Wendelken, S. and Clayman, J. 2006. Detecting exercise induced stress using the photoplethysmogram. In Proceeding of 28th Annual Int.Conf. of the IEEE Engineering in
International Journal of Emerging Technology and Advanced Engineering
Website: www.ijetae.com (ISSN 2250-2459,ISO 9001:2008 Certified Journal, Volume 4, Issue 1, January 2014)
225
[11] Yashima, K., Sasaki, T., Kageyama, Y., Odagaki, M. and Hosaka, H. 2005. Application of wavelet analysis to the plethysmogram for the evaluation of mental stress. In Proceedings of the 27th
Annual Conf. of the IEEE Engineering in Medicine and Biology Society , 2781-2784.
[12] Addison, P.S. and Watson, J.N. 2003. Secondary wavelet feature decoupling (SWFD) and its use in detecting patient respiration from the photoplethysmogram. In Proc. of the 25th Annual Int. Conf. of the IEEE Engineering in Medicine and Biology Society, 2602-2605.
[13] Penhaker, M. 2003. Diagnosis support method of plethysmographical records with the use of framework tenets. Journal of medical informatics & technologies, 5,121-127. [14] Polikar, R. 1996. The wavelet tutorial, 329.