AN EMPIRICAL STUDY ON REGIONAL DISPARITIES IN THE LEVEL
OF DEVELOPMENT IN INDIA: STATE WISE ANALYSIS
Mohammed Nizamuddin,
Research Scholar at Centre for Studies in Economics and Planning, Central University of Gujarat, Gandhinagar, Gujarat, India.
ABSTRACT
In this research paper, the levels of development has been analysed for measuring the regional
imbalance among Indian states applying the Wroclaw Taxonomic Method (Ewusi, 1976; Arief,
1982; Narain et.al. 2003, 2009, 2012; and Ohlan, 2013). The level of development was obtained
with the help of composite index based on optimum combination of twenty two socio-economic
and environmental sustainability indicators. The state wise data for the year 2011-12 in respect
of these indicators were utilized for 10 different states of India. The level of development was
estimated separately for economic development, demographic transition, educational
development, health development, environmental sustainability and overall development in order
to get a clear picture of regional disparities. The state of Maharashtra was ranked first in
overall development while state of Bihar was found very deprived in every sector of
development. For achieving identical regional development and improving the quality of life the
potential targets for various socio-economic facilities along with environmental sustainability
have been estimated. The empirical results show that wide disparities in the level of development
exist among the different states. The level of socio-economic development along with
environmental sustainability are found to be statistically significant and positively associated
with the overall development indicating that the growth and progress of all the sectors have been
going hand in hand in economy of the country. The results also show that demographic profile of
the states is the constraint and not significantly influence overall development. The study
suggests that low developed states require immediate attention of the government to improve
Keywords: Regional Disparities, Socio-economic Development, Environmental Sustainability,
Wroclaw Taxonomic Method, Composite Index.
1. INTRODUCTION
Regional disparity is the outcome of unequal regional development that varies from state to state depending upon socio-cultural, demographic, economic and environmental characteristics. Regional disparities lead numerous economic, social, cultural, and environmental problems. The adverse impact could either come through natural resource depletion and/or adverse health consequences of environmental degradation, e.g., air or water pollution (Brandon and Hommann, 1995). Development has been appropriately conceptualized as a process, which improves the quality of life of inhabitants. In fact, development has got no meaning if there is only social and economic development. The dynamic growth is no doubt good in short run but in the pace of dynamism for growth if we ignore environmental degradation then the growth is just a myth. Since, India’s independence, economic planning has been used in the country as an instrument
for bringing about uniform regional development because one main objective of development programmes has been a progressive reduction in regional disparity in the pace of development (Siddiqui and Hussain, 2010). Various five years plans have been planned for enhancing the quality of life of the individuals by providing basic amenities as well as enhancement in their socio-economic well being. The recent decades have also been witnessed an increasing interest in the protection of environmental quality and natural resource availability. Thus, overall development i.e. sustainable development is the development for fulfilling the human need to improve their lifestyles and protecting natural resource base on which we have a tendency to and our future generations rely.
to cause irremediable health damage, impulsive mortality and suicides. Many of them have roots in customary socio-economic unfair means and discrimination which have been compounded or added to by the inequities and exploitation of modern times (UNDP, 2012). Amidst, these challenges the natural environment is continuously damaging. Whatever natural resource base has been damaged it can’t often to the levels that are beyond revival. Natural ecosystems are under threat and decline can be witnessed across most of the country where industrialization, rapid urbanization has been taken place (Shrivastava and Kothari, 2012). The present study is conducted to measure regional disparities in respect to the level of development in the sampled states of India for the year 2011-12 on the basis of twenty two socio-economic and environmental indicators.
2. DEVELOPMENT INDICATORS
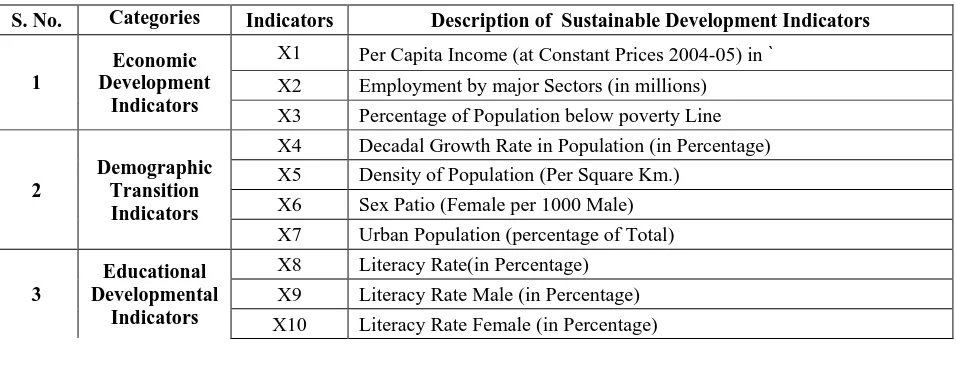
Development is a multidimensional process and its impact can’t be fully captured by a single
[image:3.612.69.547.515.700.2]indicator. A number of indicators when analysed individually do not provide an integrated and easily comprehensible picture of reality. Hence, there is a need for building up of a composite index of development based on optimum combination of all the indicators (Narain, et.al. 2009). Each state faces situational factors of development unique to it as well as common administrative and financial factors. Development indicators common to all the states have been included in the analysis. Composite indices of development have been obtained for different states by using the data on the following developmental indicators.
Table 1 Development Indicators used in the Analysis
S. No. Categories Indicators Description of Sustainable Development Indicators
1
Economic Development
Indicators
X1 Per Capita Income (at Constant Prices 2004-05) in ` X2 Employment by major Sectors (in millions) X3 Percentage of Population below poverty Line
2
Demographic Transition Indicators
X4 Decadal Growth Rate in Population (in Percentage) X5 Density of Population (Per Square Km.)
X6 Sex Patio (Female per 1000 Male) X7 Urban Population (percentage of Total)
3
Educational Developmental
Indicators
X11 Net Enrolment Ratio (NER)
X12 Expenditure on Education (Percentage of Total Expenditure)
4
Health Development
Indicators
X13 Infant Mortality Rate (IMR) X14 Maternal Mortality Ratio (MMR) X15 Crude Birth Rate (CBR)
X16 Crude Death Rate (CDR) X17 Life Expectancy Male in years, X18 Life Expectancy Female in years,
5
Environmental Sustainability
Indicators
X19 Forest cover in Square Km (Percentage of total geographical Area) X20 Proportion of population with sustainable access to safe drinking water X21 Proportion of population with sustainable access to an improved
sanitation
X22 Slum population as percentage of urban population Sources: Compiled and Computed by author
Out of twenty two indicators, eighteen indicators are directly concerned with social and economic development. Four indicators depict the progress of environmental sustainability. Also they are classified in five categories such as economic development, demographic transition, educational development, health status and environmental sustainability indicators. These indicators may not form an all inclusive list but these are the major interacting components of development.
3. DATA COLLECTION AND RESEARCH METHODOLOGY
3.1 Data and Data Sources
The present study is analytical study based on secondary data. The data has been collected from different sources such as census 2011, Office of the Registrar General of India, Ministry of Home Affairs & Economic Survey 2011-12 and 2012-13, Ministry of Finance, Government of India Reports, National Sample Survey Organisation (NSSO) various rounds, Socio-Economic Survey of the selected States, Compendium Ministry of Environment and Forest, Human Development of India Report 2012, Health Survey of India 2011. Reputed published research papers, working papers etc.
There are several statistical methods which are used for estimating the level of development but most of these methods are having their own limitations. The major limitation arises from the assumptions made about the development indicators themselves and their weightage in aggregate index. Keeping in view all the points of limitations of different methods in estimating the level of development, the “Wroclaw Taxonomic Method” developed by Florek et al. (1952) is used in the study. Therefore, it may be used as a similarity measure in establishing development models. Othe examples of its uses include those by Harbinson et al. (1968), Land (1975), Ewusi (1976), Arief (1982), Narain et al. (2003, 2009, 2012), Bhatia and Rai (2004) and Ohlan (2012). A brief introduction of Wroclow Taxonomic method used in the study is in order. Variables for different developmental indicators are taken from different population distributions and these are recorded in different units of measurement. The values of the variables are not quite suitable for combined analysis. Hence, the variables are transformed for the combined analysis as given below.
Let [Xij] be the data matrix giving the values of the variables of ith state and the jth
indicator. Where i = 1, 2,………..,n (No. of states), and j = 1, 2,………, k (No. of indicators). Every state is represented by a vector in a k-dimensional space. Since [Xij] come from different
population distributions and the units of measurement of the variables considered are not uniform. They are not quite suitable for simple addition for obtaining the composite index. Therefore, [Xij] is transformed to standardized indicators [Zij] as follows:
[Zij] =X𝑖𝑗 − 𝑋𝑗
S𝑗 (1) Where 𝑋𝑗 = Mean of the jth indicators and Sj = Standard Deviation of the jth indicators. Now [Zij] is the matrix of standardized indicators. And these are calculated as
𝑋𝑗
= 𝑁 𝑋𝑖𝑗
𝑖=1
N
and 𝑆𝑗 = 𝑋𝑖𝑗 − 𝑋𝑗 2 𝑁
𝑖=1
1/2
direction of the impact of an indicator on the level of development. For example, increase in literacy rate would positively affect the development. For obtaining the pattern of development Ci of the ith state, first calculate square of the deviation of the individual value of a transformed variate from the optimum value. In other words, calculate Pij as:
Pij = 𝑍𝑖𝑗 − 𝑍𝑜𝑗 2
(2)
For each i and j pattern of development is given by
C𝑖 = kj=1Pij/ CV j 1/2 (3)
Where (C.V)j is the Coefficient of variation of the jth indicator in Xij for jth indicators. “Composite index of Development’ or (DI) is given by
DI= Ci / C (4)
for I = 1, 2, 3,………n. Where C = 𝐶 + 3Sdi
Where 𝐶 = Mean of Ci and calculated as
𝐶𝑗
= 𝑁 𝐶𝑖
𝑖=1
N Sdi = Standard Deviation of Ci and calculated as
and 𝑆d𝑖 = 𝐶𝑖 − C 2 𝑁
𝑖=1
1/2
(5)
Smaller the value of Di it will indicate high level of developed in the state, and the higher value of it will indicate low level of development in the state. The value of DI varies from 0 < DI < 1.
3.2.2 Estimation of Developmental Distances between Pairs of States
D𝑖𝑝 = 𝑍𝑖𝑗 − 𝑍𝑝𝑗 2 𝑘
𝑗 =1
1/2
Where i = 1,2,3,………, n and p = 1,2,3,……, n. Here the following relationship are apparent: dii = 0, dip = dpi, and dip ≤ dij + dpj.
These relationships produce the following symmetric matrix which is called the distance matrix.
[dip] = 0 d12 …
d21 0 …
d1𝑛 d2𝑛
⋮ ⋮ ⋮
d𝑛1 d𝑛2 …
⋮ 0
From the above distance matrix, find out the minimum distance for each row. Denote the minimum distance for row i as di, and obtained the Critical Distance (CD) as follows:
CD = 𝑑 + 2 Sdi (6)
Where 𝑑 = mean of di and Sdi = standard deviation of di.
4. EMPIRICAL RESULTS AND DISCUSSIONS
4.1 The Level of Development
The composite indices of development have been worked out for different Indian states for economic sector, demographic transition, educational development, health development, environmental sustainability and overall development. The states have been ranked on the basis of development indices. The composite indices of development along with the rank of the states are given in Table 2.
Table: 2 Composite Indices of Development (C.I.) and Rank of States
S. N
o
STATES
Economi c Sector
Demographic Transition
Educational Sector
Health Sector
Environmental sustainability
Overall Developm
ent
C.I. R C.I. R C.I. R C. I. R C. I. R C. I. R
1 Andhra
2 Assam 0.51 9 0.17 1 0.18 5 0.50 1
0 0.17 1 0.63 7
3 Bihar 0.65 10 0.38 10 0.57 10 0.34 7 0.25 5 0.82 10
4 Gujarat 0.14 3 0.25 7 0.15 2 0.17 5 0.19 2 0.41 2
5 Haryana 0.17 4 0.20 3 0.17 4 0.20 6 0.27 7 0.42 4
6 Karnataka 0.23 6 0.22 6 0.18 6 0.14 3 0.20 3 0.43 5
7 Maharashtra 0.10 1 0.20 4 0.02 1 0.11 1 0.32 9 0.32 1
8 Rajasthan 0.22 5 0.19 2 0.31 7 0.37 8 0.38 10 0.68 8
9 Uttar
Pradesh 0.24 7 0.26 8 0.35 8 0.45 9 0.28 8 0.72 9
10 West Bengal 0.30 8 0.28 9 0.16 3 0.13 2 0.20 4 0.42 3
Note: C. I = Composite Index Score, R = Rank,
Source: Calculated by Author
In case of economic sector, state of Maharashtra was found to be the best developed state whereas the state of Bihar was on the bottom among the selected states of India. The composite index of development in this sector varied from 0.10 to 0.65. In case of demographic transition the state of Assam was on the first position as it have proved to sustain population growth and the state of Bihar, still on the last position. Here the value of composite index varied from 0.17 to 0.38. Similarly in terms of educational development the state of Maharashtra was found on the top whereas again the state of Bihar is on the bottom. The composite indices varied from 0.02 to 0.57. But with respect to health development sector some improvements have been found in the state of Bihar because now state of Assam was found on the last position whereas the state of Maharashtra again on the first position and the value of composite index varied from 0.11 to 0.50. As far as environmental sustainability is concerned the state Assam was found on the top with rank first and the state of Rajasthan was found on the bottom. The main reason behind is the area of forest cover and the values of composite indices varied from 0.17 to 0.38.
most developed states were found to be Maharashtra, Gujarat and West Bengal and three least developed states were found to Rajasthan, Uttar Pradesh and Bihar.
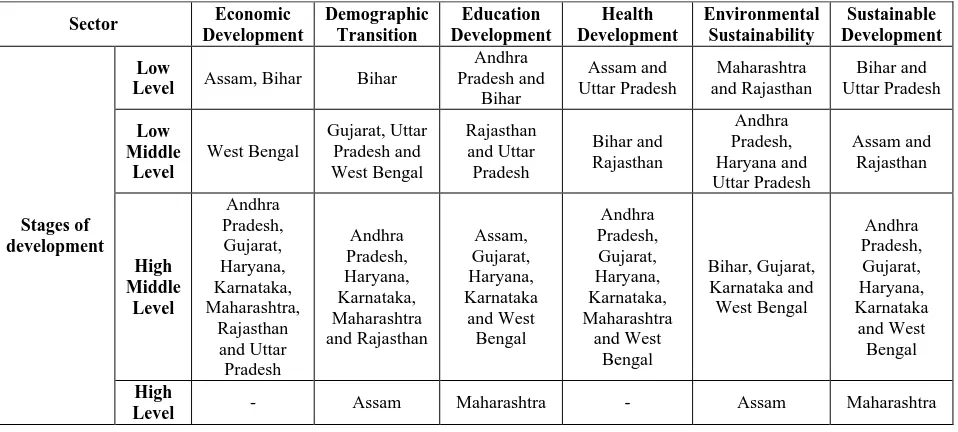
4.2 Different Stages of Development
For classification purposes, a simple ranking of the states on the basis of composite index of development is sufficient. However, a more meaningful characterization of different stages of development would be in terms of suitable fractile classification from the assumed distribution of the mean of composite indices.
Table 3 (a) Number of States in different Stages of Development
S. No
Sector No of
States
Stages of development
Low Low Middle High Middle High
1 Economic Development 10 2 1 7 -
2 Demographic Transition 10 1 3 5 1
3 Education Development 10 2 2 5 1
4 Health Development 10 2 2 6 -
5 Environmental Sustainability 10 2 3 4 1
6 Overall Development 10 2 2 5 1
Source: Calculated by Author
Table 3 (b) Classification of States in different Stages of Development
Sector Economic
Development Demographic Transition Education Development Health Development Environmental Sustainability Sustainable Development Stages of development Low
Level Assam, Bihar Bihar
Andhra Pradesh and Bihar Assam and Uttar Pradesh Maharashtra and Rajasthan Bihar and Uttar Pradesh Low Middle Level West Bengal Gujarat, Uttar Pradesh and West Bengal Rajasthan and Uttar Pradesh Bihar and Rajasthan Andhra Pradesh, Haryana and Uttar Pradesh Assam and Rajasthan High Middle Level Andhra Pradesh, Gujarat, Haryana, Karnataka, Maharashtra, Rajasthan and Uttar Pradesh Andhra Pradesh, Haryana, Karnataka, Maharashtra and Rajasthan Assam, Gujarat, Haryana, Karnataka and West Bengal Andhra Pradesh, Gujarat, Haryana, Karnataka, Maharashtra and West Bengal Bihar, Gujarat, Karnataka and West Bengal Andhra Pradesh, Gujarat, Haryana, Karnataka and West Bengal High
Level - Assam Maharashtra - Assam Maharashtra
Source: Calculated by Author
[image:10.612.69.548.107.323.2]development category. Therefore only state of Maharashtra was found in high developed categories and Uttar Pradesh and Bihar were found in low developed categories.
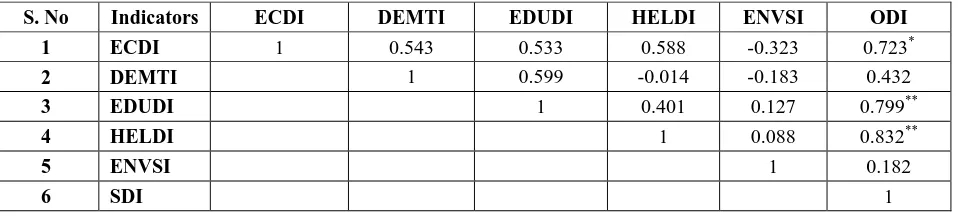
4.3 Inter- Relationship among Different Sectors of Economy
[image:11.612.70.549.277.385.2]For proper development and better level of living, it is essential that the sectors of economy should flourish together. System of education envisages overall development of manpower and human resources required for socio-economic activities. The correlation coefficient between developments of different sectors of economy is given below in Table 4.
Table 4 Pearson Correlation Coefficient between development indices of various sectors
S. No Indicators ECDI DEMTI EDUDI HELDI ENVSI ODI
1 ECDI 1 0.543 0.533 0.588 -0.323 0.723*
2 DEMTI 1 0.599 -0.014 -0.183 0.432
3 EDUDI 1 0.401 0.127 0.799**
4 HELDI 1 0.088 0.832**
5 ENVSI 1 0.182
6 SDI 1
Note: * and ** Correlation is significant at the 0.05 and 0.01 level respectively. Number of Observations N = 10.
Source: Author’s own calculation.
population; density of population and the increasing rate of urbanisation affect the environmental sustainability as well as overall development.
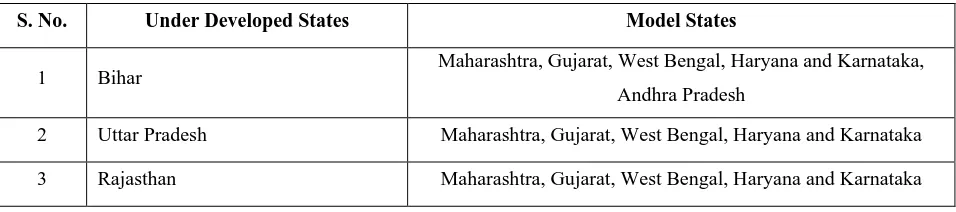
4.4 Potential Targets of Developmental Indicators for Low Developed States
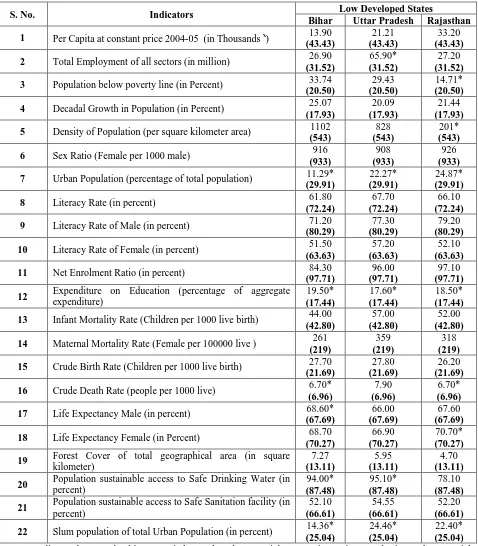
[image:12.612.68.546.420.526.2]It is relatively important to investigate the extent of improvement needed in different development indicators for bringing out progress in the level of development of under developed states. These information will help the policy makers and administration for efficient allocation of resources for enhancement of the level of development of backward states. For estimation of potential targets of developmental indicators for low developed or under developed states model states are identified on the basis of composite index of overall development and the developmental distance between different states. The best value of different indicators among the model states are listed in table 5. Model states are better developed in comparison to low developed states. The states Maharashtra, Gujarat, West Bengal, Haryana, Karnataka and Andhra Pradesh are found to be model states for under developed states of Bihar, Uttar Pradesh and Rajasthan.
Table 5 Model States for Under Developed States
S. No. Under Developed States Model States
1 Bihar Maharashtra, Gujarat, West Bengal, Haryana and Karnataka,
Andhra Pradesh
2 Uttar Pradesh Maharashtra, Gujarat, West Bengal, Haryana and Karnataka
3 Rajasthan Maharashtra, Gujarat, West Bengal, Haryana and Karnataka
Source: Author’s Own Calculation.
Table 6 Estimates of Potential Targets and actual achievements in low developed States
S. No. Indicators Low Developed States
Bihar Uttar Pradesh Rajasthan
1 Per Capita at constant price 2004-05 (in Thousands `) 13.90
(43.43)
21.21
(43.43)
33.20
(43.43)
2 Total Employment of all sectors (in million) 26.90
(31.52)
65.90*
(31.52)
27.20
(31.52)
3 Population below poverty line (in Percent) 33.74
(20.50)
29.43
(20.50)
14.71*
(20.50)
4 Decadal Growth in Population (in Percent) 25.07
(17.93)
20.09
(17.93)
21.44
(17.93)
5 Density of Population (per square kilometer area) 1102
(543)
828
(543)
201*
(543)
6 Sex Ratio (Female per 1000 male) 916
(933)
908
(933)
926
(933)
7 Urban Population (percentage of total population) 11.29*
(29.91)
22.27*
(29.91)
24.87*
(29.91)
8 Literacy Rate (in percent) 61.80
(72.24)
67.70
(72.24)
66.10
(72.24)
9 Literacy Rate of Male (in percent) 71.20
(80.29)
77.30
(80.29)
79.20
(80.29)
10 Literacy Rate of Female (in percent) 51.50
(63.63)
57.20
(63.63)
52.10
(63.63)
11 Net Enrolment Ratio (in percent) 84.30
(97.71)
96.00
(97.71)
97.10
(97.71)
12 Expenditure on Education (percentage of aggregate
expenditure) 19.50* (17.44) 17.60* (17.44) 18.50* (17.44)
13 Infant Mortality Rate (Children per 1000 live birth) 44.00
(42.80)
57.00
(42.80)
52.00
(42.80)
14 Maternal Mortality Rate (Female per 100000 live ) 261
(219)
359
(219)
318
(219)
15 Crude Birth Rate (Children per 1000 live birth) 27.70
(21.69)
27.80
(21.69)
26.20
(21.69)
16 Crude Death Rate (people per 1000 live) 6.70*
(6.96)
7.90
(6.96)
6.70*
(6.96)
17 Life Expectancy Male (in percent) 68.60*
(67.69)
66.00
(67.69)
67.60
(67.69)
18 Life Expectancy Female (in Percent) 68.70
(70.27)
66.90
(70.27)
70.70*
(70.27)
19 Forest Cover of total geographical area (in square
kilometer) 7.27 (13.11) 5.95 (13.11) 4.70 (13.11)
20 Population sustainable access to Safe Drinking Water (in
percent) 94.00* (87.48) 95.10* (87.48) 78.10 (87.48)
21 Population sustainable access to Safe Sanitation facility (in
percent) 52.10 (66.61) 54.55 (66.61) 52.20 (66.61)
22 Slum population of total Urban Population (in percent) 14.36*
(25.04)
24.46*
(25.04)
22.40*
(25.04) Note: *Indicates that actual achievement is better than the potential target. Figures in parenthesis are the potential values of the development indicators based on average of all the sample states.
It is clear some of the indicators have the present value more than that of potential targets. These are as reduction in poverty, density of population and decrease in the rate of urban population where the present value is less than that of the potential targeted value. The present value of expenditure on education is higher; the crude death rate is lower than that of potential targets. The present value of life expectancy of female is higher than that of potential targets value. The state of Rajasthan also succeeded to maintain the slum population, the percentage of total urban population on the considerable limit.
In these under developed states of Bihar, Uttar Pradesh and Rajasthan, also known as BIMARU states government required special attention in various dimensions of development so as to achieve equal and uniform development which include:
(1) Increase per capita real income with the help of creating employment as well as reducing the level of poverty.
(2) Infrastructural deficiencies require immediate government action.
(3) An appropriate check is needed to sustain decadal population growth and gender gap. (4) Enhance the education level and improve the health status in the states as proper medical
facilities are not available in these states.
(5) Construct hospitals and appoint doctors to improve the health status in the state. (6) Provide the facilities to the weaker sections of the society.
(7) The area of total forest cover is extremely low in the states and appropriate action should be taken so as to increase in the forest cover.
(8) The condition of sustainable access to sanitation facilities is very poor it should be enhanced through various schemes by the government of the state.
(9) Decrease the gender gap in each and every dimension of development to maintain the proper equality.
(10) Ensure the environmental sustainability to protect the environment degradation and natural resource base.
(11) To make appropriate utilisation of the states’ resources base.
Therefore, these states will get sustainability if they follow the strategies of the model states. Sustainable development means development in each and every dimension of developmental indicator then the states are said to be sustainable developed state.
5. CONCLUSION AND POLICY IMPLICATIONS
actions are urgently called for. This will require concerted efforts on the part of states governments and the centre. The determination on the part of government, the ruling elite and the people at large is even more important. The analysis described in the study is necessarily confined. Further work is needed in order to carry out comparisons over different time periods because the sustainable development is long term process. As noted by Arief (1982) that comparative studies such as this are primarily directed towards hypothesis generating objectives rather than to hypothesis testing and are suggested as an additional tool for regional planning.
REFERENCES
1) Anand, S., & Sen, A. (2000). Human Development and Economic Sustainability. World Development , 28 (12), 2029-2049. Available at http://www2.econ.iastate.edu/classes
/tsc220/hallam/Readings/AnandSenHumanDevelopmentEconomicSustainability.pdf
2) Arief, S. (1982). Regional Disparities in Malasia. Social Indicators Research, 11(3), 259-267. Available at http://link.springer.com/article/10.1007/BF00351837
3) Bhatia, B. K., & Rai, S. C. (2004). Evaluation of Socio-Economic Development in Small Areas. Project Report New Delhi: Planning Commission, Government of India. Available
at http://planningcommission.nic.in/reports/sereport/ser/std_smlarea.pdf
4) Choudhury, U.D. R. (1992). Inter–State and Intra-State Variations in Economic Development and Standard of Living. Economic and Political Weekly, 27 (49/50), 2651-2655. Available at http://www.jstor.org/stable/4399214
5) Das, A. (1999). Socio- Economic Development in India: A Regional Analysis. Development and Society , 28 (2), 313-345. Available at http://isdpr.org/isdpr/publication/journal/28-2/7Abhiman.pdf
6) Dasgupta, B. (1971). Socio-economic Classification of Districts: A Statistical Approach. Economic and Political Weekly, 6(33), 1763-1774. Available at http://www.jstor.org
/stable/4382379
8) Ewusi, K. (1976). Disparities in Levels of Regional Development in Ghana. Social Indicators Research, 3(1), 75-110. Available at http://link.springer.com/article/10.1007/
BF00286164
9) Florek, K., Łukaszewicz, J., Perkal, J., Steinhaus, H. I., Zubrzycki, S. (1952). Taksonomia. Wrocławska, Przegla˛d Antropologiczny, Poznan´, XVII. Available at
http://unesdoc.unesco.org/images/0000/000019/001919EB.pdf
10) GoI. (2013a). Millennium Development Goals India Country Report 2013. Central Statistical Organisation, Ministry of Statistics and Programme Implementation, New
Delhi: Government of India. Available at http://mospi.nic.in/mospi_new/upload/ MDG_pamphlet29oct2013.pdf
11) GoI. (2013b). Economic Survey, Ministry of Finance, New Delhi: Government of India. 12) Gostowski, Z. (1970). The Use of Taxonomic Measures in Target Setting Based on
International Comparisions. Quality & Quantity, 4(2) 355-363. Available at http://link.springer.com/article/10.1007/BF00199569
13) Kurian, N. J. (2000). Widening Regional Disparities in India: Some indicators. Economic and Political Weekly, 35(7), 538–550. Available at http://www.jstor.org/stable/4408933
14) Kurian, N. J. (2007). Widening Economic & Social Disparities: Implications for India. Indian Journal of Medical Research, 126, 374–380. Available at http://www.ncbi.nlm.nih.gov/pubmed/18032812
15) Kurulkar, R. P. (2009). The Problem of Regional Disparities in Maharashtra State and the Role of the regional Development Board. Journal of Indian School of Political Economy , 261-280. Available at http://www.ispepune.org.in/issue-2009/TheProblemof_regional.pdf 16) Majumder, A., Mazumdar, K., & Chakrabarti, S. (1995). Patterns of inter and intra Regional Inequality: A Socio-economic Approach. Social Indicators Research, 34(3), 325–338. Available at http://link.springer.com/article/10.1007%2FBF01078691
17) Masnavi, M. R. (2007). Measuring Urban Sustainability: Developing a conceptual Framework for Bridging the Gap Between Theoretical Levels and the Operational Levels. International Journal of Environmental Research , 1 (2), 179-187. Available at
18) Mathur, A. (1983). Regional development and income disparities in India: A sectoral analysis. Economic Development and Cultural Change, 31(3), 475–505. Available at http://www.jstor.org/stable/1153210
19) McGranahanan, D. (1972). Development indicators and development models. Journal of Development Studies, 8(3), 91–102. Available at http://www.tandfonline.com/doi/abs /10.1080/00220387208421414
20) Minocha, A. C. (1983). Regional disparities in India: Some Basic Issues. Social Scientist, 11(5), 51–57. Available at http://www.jstor.org/discover/10.2307/3517103
21) Moser, C. (1972). Social indicators? systems methods and problems. Review of Income and Wealth, 19(2), 133–141. Available at http://www.roiw.org/1973/133.pdf
22) Nagraj, R., & Pandey, S. (2013). Have Gujarat and Bihar Outperformed the Rest of India? A Statistical Note. Economic and Political Weekly , XLVIII (39), 39-41. Available at http://www.epw.in/system/files/pdf/2013_48/39.pdf
23) Narain, P., Bhatia, V. K. & Rai, S. C. (2012). Pattern of Regional Disparities in Socio– Economic in West Bengal. Journal of Indian Society of Agricultural Statistics, 65(1), 27– 35. Available at http://isas.org.in/jisas/jsp/volume/vol65/04-Prem%20Narain.pdf
24) Narain, P., Rai, S. C., Sarup, S., & Bhatia, V. K. (2009). Inter-district Variation of Socio- economic Development in Andhra Pradesh. Journal of Indian Society of Agricultural Statistics, 56(1), 52–63. Available at http://js.iasri.res.in/jsp/volume/vol63/3-Prem%20 Narain.pdf
25) Narain, P., Sharma, S. D., Rai, S. C., & Bhatia, V. K. (2005). Estimation of Socio-economic Development of Different Districts in Kerala. Journal of Indian Society of Agricultural Statistics, 59(1), 48–55. Available at http://www.isas.org.in/jsp/volume/vol
59/pnarain.pdf
27) Rajalakshmi, K. (2013). Growing Regional Disparities in India's Development. International Journal of Educational Research and Technology , 4 (3), 47-55. Available
at http://soeagra.com/ijert/ijertsept2013/8.pdf
28) Sardar, S. I. (2010). India: Towards Achieving MDGs in Education. IRS Institute of Regional Studies , XXVIII (1), 1-39. Available at https://www.academia.edu/2333349
29) Sarker, P. C. (1994). Regional imbalances in Indian economy over plan periods. Economic and Political Weekly, 29(11), 621–633. Available at http://www.jstor.org/
stable/4400929
30) Sharma, S. (2006). An Approach to Measure Sustainability: Comparative Evaluation of States of India. Centre of environmental studies, TERI , 1-31. (Conference Proceeding) 31) Siddiqui, F.A. and Hussain, N. (2010). Analysis of Micro Level Socio-Economic
Disparities in Malda District, West Bengal, Asia-Pacific Journal of Social Sciences, 2(1), 39-61. Available at http://papers.ssrn.com/sol3/papers.cfm?abstract_id=1905031
32) Siddiqui, S. (2012). Population Growth and Environmental Degradation in Uttar Pradesh (India)- A Geographical Analysis. African Journal of Social Sciences , 2 (4), 60-72. Available at http://www.sachajournals.com/documents/image/india2012vol4ajss002.pdf 33) Slottje, D. J. (1991). Measuring the Quality of Life Across Countries. The Review of
Economics and Statistics, 73(4), 684–693. Available at http://www.jstor.org/discover
/10.2307/2109407?uid =3738256&uid=3737800&uid=2&uid=4&sid=21104564278893