AN EMPIRICAL STUDY OF CUSTOMER SATISFACTION WITH THE
SERVICE QUALITY OF PRIVATE BANKS USING SERVQUAL MODEL
Dr (Mrs.) Meenu Kumar
Visiting Faculty
School of Future Studies and Planning
Devi Ahilya University, Indore
ABSTRACT
Customer satisfaction is the major concern of all business organizations as satisfied customers
are the most important asset for them. They are the ambassador of good will as well as help in
business expansion. Many models are being used to understand what makes a customer more
satisfied. SERVQUAL model has two parts –one to understand expectations of customers and the
second to know their perception that is what they perceive. The gap between perception and
expectation decides the satisfaction of customers. The present study focuses on customers’
satisfaction from the services provided by private sector banks using SERVQUAL model. Survey
method has been used to collect the primary data on expectations and perception of customers on
five dimensions (Tangibility, Assurance, Empathy, Reliability and Responsiveness) of service
quality and gap is identified. The result suggests that perception of customers on Tangibility,
Responsiveness, Reliability and Assurance are more than expectation while it is less in case of
Empathy.
Key words: Customer Satisfaction, Banks, Services, Expectation, Perception
Introduction:
Banking industry plays an important role in the economic development of a nation. Customers
are the king of the business organizations as all the activities of business revolve around them
whether it is new product development or adding new features or pricing policies etc. The
the more the loyalty and more are the business. Satisfied customers are the ambassador of the
business as their satisfaction echoes outside which help in expansion of the business.
In the era of liberalization, privatization and globalization the business organizations are under
tremendous pressure to attract new customers and retain its existing ones due to very competitive
environment, availability of alternatives as well as many tactics to attract customers. Therefore
service organizations have begun focusing on the customer perceptions of service quality
because it helps in developing strategies that lead to customer satisfaction (Saravanan & Rao),
[1]. Gummesson [2] also emphasized that there is a shift from the focus on goods without much
emphasis on services to a focus on services though paying attention on the goods.
A product is generally tangibles offered by the marketer at a price as these are tangible in nature
determining what makes customers satisfied is easier. But in case of services which are
essentially intangible in nature, and may or may not be associated with physical products, it
becomes difficult to understand customers’ satisfaction.
Customer Satisfaction is a popular and most researched topic in marketing. Most discussions on
customer satisfaction are focused on what customers expects and what they actually receive and
whether their expectations are fulfilled, exceed or unmet.
Kolter and Armstrong [3] defined the customer satisfaction as the customer's perception that
compares their pre-purchase expectations with post purchase perception. Oliver [4] defines
satisfaction as “the consumer’s fulfillment response”, a post consumption judgment by the
consumer that a service provides a pleasing level of consumption-related fulfillment, including
under or over-fulfillment. But Zeithaml & Bitner [5] believe that customer satisfaction is the
customers' evaluation of services after purchase as opposed to their expectation.
According to Wicks & Roethlein [6], organization that consistently satisfy their customers enjoy
higher retention levels and greater profitability due to increased customer’s loyalty.
And therefore it is essential to keep consumers satisfied and this can be done in different ways
and one way is by trying to know their expectations and perceptions of services offered by
service providers
The SERVQUAL service quality model was developed by Parasuraman, Valarie Zeithaml and
Len Berry, [7] in 1985. According to this model the main components of high quality service are
reliability, assurance, tangibles, empathy and responsiveness - that create the acronym RATER.
1. RELIABILITY involves consistency of performance and dependability.
2. RESPONSIVENESS is concerned with the willingness or readiness of employees to
provide service
3. ASSURANCE is to inspire trust and confidence in customers. It is concerned with the
knowledge and courtesy of staff; their ability to inspire trust and confidence.
4. Empathy involves access, communication, understanding the stakeholder etc.
5. TANGIBLES includes the physical evidence of the service like physical facilities,
appearance of personnel and tools or equipment used to provide the service
SERVQUAL Model measures both the customer expectations of service quality in terms of these
five dimensions, and their perceptions of the service they receive. When customer expectations
are greater than their perceptions of received delivery, service quality is deemed low.
Thus this model represents service quality as the discrepancy between a customer's expectations
for a service offering and the customer's perceptions of the service received.
Expectation in case of banks may be what people expect from an ideal bank which depends on
customer’s need, their past experience and the way they get information about the bank, through
relatives or friends etc and also how bank itself communicate and treat a customer. Customers’
perception of performance is what they experienced. The result of this comparison is perceived
service quality (Gronroos, [8], Takeuchi and Quelch, [9]; Parasuraman et al [10].
Objectives of the study
The main objective of the study is to measure customer satisfaction with the service quality of
private banking sectors of Indore through SERVQUAL model. The major objectives of the
To study the difference between perceptions and expectations of Private Sector Bank’s customers on Tangibility.
To study the difference between perceptions and expectations of Private Sector Bank’s customers on Reliability.
To study the difference between perceptions and expectations of Private Sector Bank’s customers on Responsiveness.
To study the difference between perceptions and expectations of Private Sector Bank’s
customers on Assurance.
To study the difference between perceptions and expectations of Private Sector Bank’s
customers on Empathy.
Literature review:
Many studies have been conducted to examine the satisfaction andintention of banking customers (Wirtz, [11]; Laforet and Li, [12]; Bamdad and Rafiei, [13]; Udo
et al., [14]; Gilaninia and Mosavian, [15]; Kazemi and Mohajer, [16]; Samadi and eskandari,
[17]; Grigoroudis et al., [18].
SERVQUAL model has also been used by researchers to study the customer satisfaction. The
brief review is as follows:
Heryanto [19] studied the effect of service quality on customer satisfaction of Indonesian
banks. Various dimensions of service quality like responsiveness, reliability, assurance
tangibility and empathy were defined and customer satisfaction factor like speed, Accuracy, Safe,
Sauvé and Comfort and concluded significant relationship between service quality and customer
satisfaction. The study also revealed that service quality is very important and consists of action
like staff availability, right service at right time, commitment, quick response, competency,
complaint solution, and capability of the staff at bank.
Similarly Navaratnaseelan and Elangkumaran [20] examined the relationship between
service quality and customer satisfaction through SERVQUAL model. In their study the service
quality dimensions such as Reliability, Assurance, tangibility, Empathy, Responsiveness were
correlation analysis revealed that there is significant positive correlation between service quality
and customer satisfaction.
Pooja Rani [21] of conducted a research on customer satisfaction of public sector banks
with SERVQUAL scale and reported that all dimensions of service quality were positively related
with the customer satisfaction.
Another research study titled “Measuring Service Quality in Retail Banking in Context of Gujrat” was conducted by Parmita Mehta [22] with the objective of measuring the service
quality in the banking sector. The study was conducted on 1 public sector bank, 3 private banks
and 2 co-operative banks. Customers were segmented on the basis of their perception in high and
low service quality factors and to understand the relationship between two segments, chi-square
test was performed. The study also defined various dimensions of service quality.
This model was also used by A Albarq [23] to evaluate the impact of service quality on
customer loyalty, with customer satisfaction mediating these variables. The study was conducted
with the customers of five local banks of Riyadh, Saudi Arabia. The study recommended that
improving service quality can improve the loyalty of the customers. Empathy, assurance and
reliability dimension were found to play significant role in satisfying customers.
RESEARCH DESIGN
In this study descriptive cross sectional design has been used to carry out the research.
Population
The population for study is the people of Indore who are having bank account in any of the
public sector banks.
Data Collection Instruments - Questionnaire
Research is based on primary information collected through self administered questionnaire
developed by by Parasuraman, Valarie Zeithaml and Len Berry. Five dimensions -Tangibles,
Reliability, Responsiveness, Assurance, and Empathy of the SERVQUAL model have been
In the SERVQUAL model, the statements are divided into two parts, the first part is meant to
measure the expectations of customers and the second part to measure their perceptions.
Demographic information about customers like gender, age, occupation, qualification, and
frequency of visits to bank has also been collected.
Consumers perceived service quality in banks is assessed by the difference between the
expectation and perception of services experienced by customers in banks. This will help to
identity what items of the SERVQUAL dimensions customers are satisfied.
Scale for measurement: The study it has been carried out on five point scale (5-Strongly agree,
4 –Agree, 3-Neutral, 2- Disagree and 1- Strongly Disagree) to measure both the expectation and
perception of the customers.
Perceptions are based on the actual service they receive in banks and expectations are based on
what they actually find in the banks. Service quality scores are the difference between the
perception and expectation scores (P-E) with a possible range of values from -5 to +5 (-5 stands
for very dissatisfied and +5 means very satisfied). The quality score measures the service gap or
the degree to which expectations exceed perceptions.
The more positive the P-E scores, the higher the level of service quality leading to a higher level
of customer satisfaction.
DATA ANALYSIS
Demographic analysis of sample: The bank customers who were surveyed for the studies are
the respondents for the study. The profile of them has been shown in Table No 1.Table shows
that out of 80 respondents 19 were female and 61 are male. The percent wise distribution of
gender is 76.3 percent male and 23.8 percent are female. On examining the table it has been
found that out of 80 respondents, 50 are married while 30 are unmarried. Thus 62.5 percent
respondents are married and only 37.5 percent are unmarried.
Respondent’s age have been grouped in four groups- 21-30, 31-40, 41-50 and above 50 and the
result shows that 20 respondents out of 80 belongs to 21-30 age group with the percentage of 25
people were above 50 years with the percentage of 16.3 and 7.5 percent respectively.
Respondents were classified in postgraduate, Graduate, below post graduate and above
postgraduate.
Table No 1
Demographic Profile of Respondents
41 respondents are only Graduate whose percentage is 51.3 followed by post graduate whose
number is 25 and percentage is 31.3. Below and above graduate respondents are equal number
and that is 7 with percentage of 8.8. Occupation wise 15 percent respondents are students, 77.5
percent are belongs to service class and only 7.5 percent belongs to business class.
Detailed Analysis of Dimensions of Service quality:
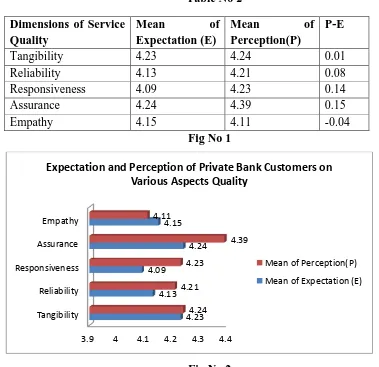
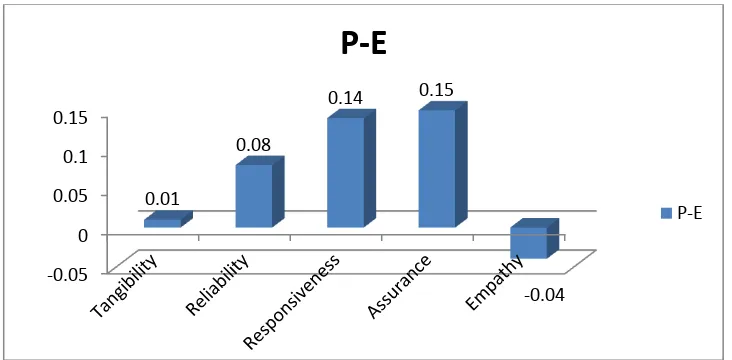
Expectation and perception of customers on different dimensions of service quality: Table No
2 presents the expectation and perceptions of private bank customers. The Table shows that
perception of customers on Tangibility is 4.24 which is more than expectation which is 4.23 As the
difference is 0.01 there is satisfaction on this dimension though nominal. Similarly Perception on
reliability, responsiveness and assurance is 4.21, 4.23, and 4.39 respectively which is more than
their expectations and the value of which are 4.13, 4.09 and 4.24 respectively. The Fig No 1 shows Gender Male
Female
61 19
76.3 23.8
Marital Status Married Unmarried
50 30
62.5 37.5
Age 21-30Years 31-40 Years 41-50 Years Above 50 Years
20 13 41 6 25 16.3 51.3 7.3
Qualification Above Post Graduate Post Graduate Graduate Below Graduate 7 25 41 7 8.8 31.3 51.3 8.8
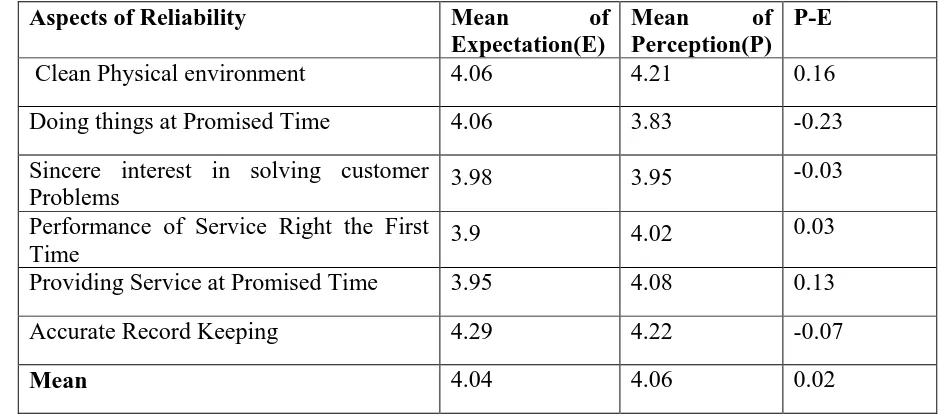
the Perception and expectations of customers on dimensions of services. Fig No 2 represents the gap
[image:9.612.98.477.138.505.2]between perception and expectation.
Table No 2
Dimensions of Service Quality
Mean of
Expectation (E)
Mean of
Perception(P)
P-E
Tangibility 4.23 4.24 0.01
Reliability 4.13 4.21 0.08
Responsiveness 4.09 4.23 0.14
Assurance 4.24 4.39 0.15
Empathy 4.15 4.11 -0.04
Fig No 1
Fig No 2
3.9 4 4.1 4.2 4.3 4.4 Tangibility
Reliability Responsiveness Assurance Empathy
4.23 4.13 4.09
4.24 4.15
4.24 4.21
4.23
4.39 4.11
Expectation and Perception of Private Bank Customers on Various Aspects Quality
As the differences in these cases are 0.08, 0.14 and 0.15 and positive, the customers are found to
be satisfied with the reliability, responsiveness and assurance dimensions of service quality. But
in case of empathy P-E score is -0.04 as the perception is 4.11 and expectation is 4.15. It simply
reveals that there is dissatisfaction on this aspect of service.
Detailed Analysis of Dimensions of Service quality:
1.
Tangibility:
Table No 3 deals with various aspects of tangibility in service provided by the [image:10.612.106.472.85.265.2]private sector banks.
Table No 3
Expectation and Perception of Private Bank Customers on Various Aspects of tangibility
Aspects of Tangibility Mean of
Expectation(E)
Mean of
Perception(P)
P-E
Modern Equipments 4.27 4.35 0.08
Physical Facilities Appealing 4.18 4.21 0.03
Employees well dressed 4.15 4.33 0.18
Service Materials Appealing 4.26 4.24 0.02
Mean 4.24 4.23
Perception is more in the cases of modern equipments, appealing physical facilities, and well
dressed employees which are 4.35, 4.21 and 4.33 respectively. Whereas the expectations in
-0.05 0 0.05 0.1 0.15
0.01
0.08
0.14 0.15
-0.04
P-E
similar cases are 4.27, 4.18 and 4.15 leading to P-E score 0.08, 0.03 and 0.18 which suggests
that customers are satisfied with these aspects. But the expectation in the case of appealing
service materials is 4.26 and the perception in this case is less than the expectations which is
4.24 and the P-E score is -0.02 revealing little dissatisfaction.
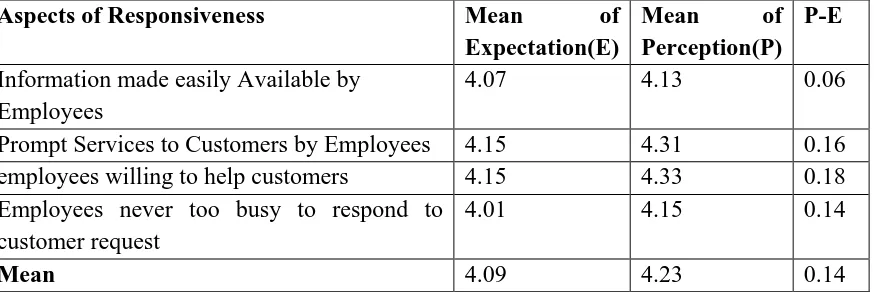
3. Reliability: Table No 4 represents the detailed response of customers on reliability dimension of service quality.
On examining the table it is found that only on three aspects –sincere interest in solving customer
problems, accurate record keeping and doing things at promised time, the perception is less than
customers’ expectation. And therefore the P-E score is -0.03, -0.07 and -0.23 which means
customers expect more than what they get on these aspects of service quality. But on other three
aspects like clean physical environment, performance of service right first time and providing
[image:11.612.76.547.407.615.2]service at promised time customers expects less and are perceiving or getting more
Table No 4
Expectation & Perception of Private Bank Customers on Various Aspects of Reliability
Aspects of Reliability Mean of
Expectation(E)
Mean of
Perception(P) P-E
Clean Physical environment 4.06 4.21 0.16
Doing things at Promised Time 4.06 3.83 -0.23
Sincere interest in solving customer
Problems 3.98 3.95
-0.03
Performance of Service Right the First
Time 3.9 4.02
0.03
Providing Service at Promised Time 3.95 4.08 0.13
Accurate Record Keeping 4.29 4.22 -0.07
Mean 4.04 4.06 0.02
3. Responsiveness: Responsiveness means the response of the employees to the customers and
[image:12.612.78.515.206.352.2]plays vital role in customer satisfaction with any service.
Table No 5
Expectation and Perception of Private Bank Customers on Various Aspects of
Responsiveness
Aspects of Responsiveness Mean of
Expectation(E)
Mean of
Perception(P) P-E
Information made easily Available by Employees
4.07 4.13 0.06
Prompt Services to Customers by Employees 4.15 4.31 0.16
employees willing to help customers 4.15 4.33 0.18
Employees never too busy to respond to customer request
4.01 4.15 0.14
Mean 4.09 4.23 0.14
The result of customer’s expectation and perception on responsiveness has been presented in Table
No 5. The Table reveals that Perception is more than their expectation on all the aspects of
responsiveness. Expectations in the cases of Prompt services to customers by employees,
Employees never too busy to respond to customers, Employees willing to help customers and
Information made easily available to customers are 4.15, 4.01, 4.15 and 4.07 respectively. Whereas
the perceptions in these cases are 4.31, 4.15, 4.33 and 4.13 respectively leading to P-E scores of
0.06, 0.16, 0.18 and 0.14.This simply states that customers perceive more than what they expect on
all aspects of responsiveness.
4.
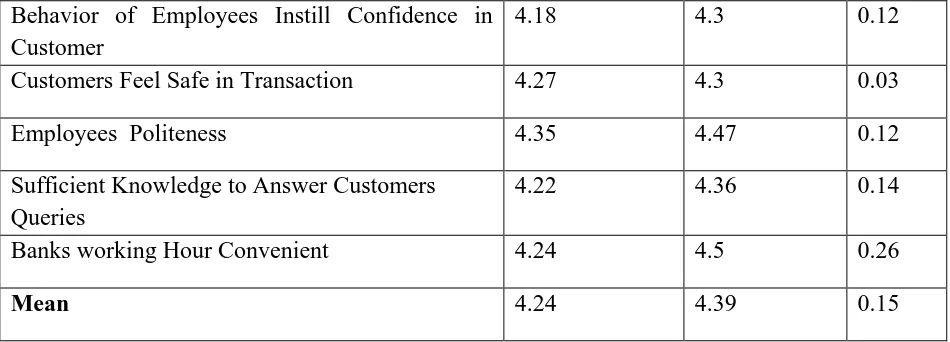
Assurance:
Assurance is another dimension of service quality and it instills confidence incustomers and they are assured that they are availing quality services. The result of bank
customer’s response on this dimension has been depicted in Table No 6. Result indicates that
on all the aspects of assurance customers perception is more than their expectation.
Table No 6
Expectation and Perception of Private Bank Customers on Various Aspects of Assurance
Aspects of Assurance
Mean of
Expectation(E)
Mean of
Behavior of Employees Instill Confidence in Customer
4.18 4.3 0.12
Customers Feel Safe in Transaction 4.27 4.3 0.03
Employees Politeness 4.35 4.47 0.12
Sufficient Knowledge to Answer Customers Queries
4.22 4.36 0.14
Banks working Hour Convenient 4.24 4.5 0.26
Mean 4.24 4.39 0.15
Behavior of employees instilling confidence has perception value 4.3 and expectation value 4.18
with P-E score 0.12, Customers feeling of safe transaction perception value 4.3 and expectation
value 4.27 with P-E value 0.03, and employee’s politeness perception is 4.47 and expectation is
only 4.35 with P-E value of 0.12. Similarly employee’s knowledge base to solve bank related
problems of customers has perception 4.36 whereas the expectations are 4.22 and P-E score 0.14.
The convenient working hour aspects are having perception value of 4.5 exceeding the
expectation value 4.24 with P-E score of 0.26 of customer.
5. Empathy: This dimension of service helps understanding the customers and good compassion
with them. This helps to convert customers into loyal customers. Table No 7 deals with empathy
dimension of service quality. The result indicates that getting individual attention to customers is
the only aspect having expectation value more than perception which is 4.11 and 4.33 and
positive P-E value of 0.22 respectively. On other aspects like personal service to customers.
giving customers best interest at heart by the bank employees and understanding specific needs
of customers, customers expectation is more than perception leading to negative scores of 0.10,
[image:13.612.71.546.87.258.2]-0.09 and -0.03.
Table No 6
Expectation & Perception of Private Bank Customers on Various aspects of Empathy
Aspects of Empathy Mean of
Expectation(E)
Mean of
Individual Attention to customers 4.11 4.33 0.22
Personal Service to Customers by Employees
4.2 3.92 -0.10
Customer's best Interest at Heart 4.17 4.08 -0.09
Understanding Customer's Specific need
4.13 4.1 -0.03
Mean 4.15 4.11 -0.04
FINDINGS AND DISCUSSION
1. The Result of the research shows that perception of Private Banks’ customers on
Tangibility, Responsiveness, Reliability and assurance is more than expectation.
2. But the Perception of customers on Empathy is less than Expectations. Thus the
customers of these banks demand more only on empathy and this is the only facet which
requires improvements for customer’s satisfaction.
3. In going details of Tangibility dimension of Private Banks, it has been found that
customers’ perception is more on all fronts like modern equipments and service providing
materials physical service appealing that is the ambience of banks and appearance of
employees than what they expect.
4. The detailed response of customers on reliability dimension of service quality shows that
only on three aspects –sincere interest in solving customer problems, accurate record
keeping and doing things at promised time, the perception is less than customers
expectation But on other three aspects like clean physical environment, performance of
service right first time and providing service at promised time customers expects less and
are perceiving or getting more from the banks.
5. Private Bank customer’s Perception exceeds Expectation on all aspects of
customers, willingness of employees to help customers and employees never too busy to
respond to customers.
6. In case of Assurance also, result indicates that on all the aspects, customers’ perception is
more than their expectation.
7. The Empathy dimension of service helps understanding the customers and good
compassion with them. This helps to convert customers into loyal customers. The result
indicates that getting individual attention to customers is the only aspect having
Expectation value more than perception giving customers best interest at heart by the
bank employees and understanding specific needs of customers, expectation is less than
perception.
Reference:
1. Saravanan, R. & Rao, K. S. P., Measurement of service quality from the customer’s
perspective – An empirical study, Total Quality Management, Vol. 18. No. 4, 2007,
p.435-449.
2. Gummesson, E., Service Management: An Evaluation and the Future, International
Journal of Service Industry Management, Vol. 4, Number 1, 1994 pp.77-96.
3. Jones, M. A., and Suh, J. Transaction-Specific Satisfaction and Overall Satisfaction: An
Empirical Analysis. Journal of Services Marketing, 14(2), (2000). 147–159.
4. Kotler, P. and Armstrong, Gary.( 1999), Principle of Marketing, Upper Sadle River,
Prentice Hall, Inc.
5. Oliver Richards L., Satisfaction: A Behavioral Perspective on the Consumer. New York:
The McGraw-Hill Companies, Inc. 1997
6. Zeithaml, V.A. and Bitner, M.J., Services Marketing, McGraw-Hill, New York, NY. 2000
7. Wicks, A. M., & Roethlein, C. J., A Satisfaction-Based Definition of Quality, Journal of
8. Parasuraman, A., Zeithaml, V. A., & Berry, L. L., A Conceptual Model of service Quality
and its Implications for Future Research, Journal of Marketing, Vol. 49, 1985. pp 41-50.
9. Gronroos, C., A Service Quality Model and its Marketing Implications, European Journal
of Marketing, Vol.18, Number 4, 1982 pp.36-44.
10.Takeuchi, H and Quelch, J. A., Quality is More than Making a Good Product, Harvard
Business Review, 61, 1983 pp139-146
11.Parasuraman, A., Zeithaml, V. A., & Berry, L. L, SERVQUAL: A Multiple-Item Scale for
Measuring Consumer Perceptions of Service Quality, Journal of Retailing, Vol. 64,
Number 1, 1988 pp.12-40.
12.Wirtz, J., Halo in Customer Satisfaction Measures: The Role of Purpose of Rating,
Number of Attributes and Customer Involvement. International Journal of Services
IndustryManagement, 14 (1), 2003, pp. 96-119
13.Laforet, S. and Li, X., Consumer's Attitudes towards Online and Mobile Banking in
China. International Journal of Bank Marketing, 23 (5), 2005 pp. 362-380
14.Bamdad, N. and Rafiei Mehr Abadi, N, Customer Satisfaction Survey of Bank ATM
Service Quality. Journal of Humanities and Social Sciences and Management, 31(4), 2009
pp. 39-58.
15.Udo, G. J., Bagchi, K. K. and Kirs, P. J, An Assessment of Customer's E-Service Quality
Perception, Satisfaction and Intention. InternationalJournal of Information Management,
30 (6), 2010 pp. 481-492.
16.Gilaninia, S. H. and Moussavian, S. J, Identifies the Factors Affecting the Propensity of
Customers Using Electronic Banking Services. Beyond the Management, 11, 2010 pp.
103–133.
17.Kazemi, M. and Mohajer, Sh., Ranking of Factors Affecting Customer Satisfaction of
Service Quality in the EN Bank of Mashhad. Journal of Industrial Management, 10, 2010
pp. 91–103.
18.Samadi, A. and Skandari, S., The Effect of Service Quality on Customer Satisfaction
MELi Bank of Toysergan City (based on SERVQUAL Model. Journal of Management,
19.Grigoroudis,E.,Tsitsiridi, E. and Zopounidis, C., Linking Customer Satisfaction,
Employee Appraisal and Business Performance: An Evaluation Methodology in the
Banking Sector. Annals of Operations Research, 205 (1), 2012 pp. 5-27.
20.Hery Hyanto, (2011) , Effect of service quality on customer satisfaction with bank Nageri,
Main branch, Padang, International journal of Business and Management Tomorrow, Vol
1 No 2,Nov 2011, pp1-14
21.Navaratnaseelan, J.J. and Elangkumaran,P.,Impact of Servıce Qualıty on Customer
Satısfactıon:A Study on Customers of Commercıal Bank of Ceylon PLC Trincomalee
District ,Reshaping Management and Economic Thinking through Integrating
Eco-Friendly and Ethical Practices Proceedings of the 3rd International Conference on
Management and Economics, 26-27 February 2014 Faculty of Management and Finance,
University of Ruhuna, Sri Lanka ISBN 978-955-1507-30-5
22.Pooja Rani, The Study on the Assessment of Customer Satisfaction in Banking Sector
Through SERVQUAl Scale, International journal of research in Pharmacy and
Management ,Vol 2, Issue 8, Sep 2013
23.Pramita Mehta, Measuring Service Quality in Retail Banking in Context of Gujrat, Ninth
AIMS International conference on Management, Jan 2012,pp38-46
24.Albarq, Applying a SERVQUAL Model to Measure the Impact of Service Quality on
Customer Loyalty among Local Saudi Banks in Riyadh, American Journal of Industrial
and Business Management, Vol. 3 No. 8, 2013, pp. 700-707. doi: