Citation:
Widdop, PAUL and Cutts, D (2011) Cultural Consumption in Scotland: Analysis of the Scottish Household Survey Culture Module. Project Report. Institute for Social Change, University of Manchester.
Link to Leeds Beckett Repository record: http://eprints.leedsbeckett.ac.uk/1319/
Document Version: Monograph
The aim of the Leeds Beckett Repository is to provide open access to our research, as required by funder policies and permitted by publishers and copyright law.
The Leeds Beckett repository holds a wide range of publications, each of which has been checked for copyright and the relevant embargo period has been applied by the Research Services team.
We operate on a standard take-down policy. If you are the author or publisher of an output and you would like it removed from the repository, please contact us and we will investigate on a case-by-case basis.
Ar
ts an
d C
ul
tur
e
CULTURAL CONSUMPTION IN SCOTLAND
ANALYSIS OF THE SCOTTISH
HOUSEHOLD SURVEY CULTURE MODULE
Paul Widdop and David Cutts
Institute for Social Change, University of Manchester
The views expressed in this report are those of the researcher and do not necessarily represent those of the Scottish Government or
Scottish Ministers.
© Crown Copyright 2011
Limited extracts from the text may be produced provided the source is acknowledged. For more extensive reproduction, please contact the
Queens Printers of Scotland, Admail, ADM 4058, Edinburgh EH1 1NG. Email: licensing@oqps.gov.uk
Table of Contents
EXECUTIVE SUMMARY
1. Background and Context of Research 1
2. Consumption of Cultural Activities in Scotland 12
3. Latent Class analysis of Cultural Attendance and Participation in Scotland 17 4. Understanding the Drivers of Cultural Attendance and Participation in 23 Scotland
5. Who are Members of the ‘Low Activity’ Groups? 35
6. Concluding Thoughts 43
Appendix 1: Descriptive Statistics for the Participation and Attendance 52 Indicator Variables
Appendix 2: Discussion and Coding of Variables 70
Appendix 3: What is Latent Class Analysis (LCA)? 73
EXECUTIVE SUMMARY
Introduction
This research was commissioned by the Scottish Government to explore statistical evidence from survey data to establish whether taking part in culture in Scotland depends both on who you are and where you live. Previous descriptive analyses had suggested that some socio-demographic factors were associated with cultural choices. This research quantifies the relative importance of each of these factors and provides a useful addition to existing quantitative and qualitative research evidence in this area. The research provides strong evidence that some demographic factors (e.g. education) are more important than others. Using this information, it will be possible to target those individuals who may be at a disadvantage in terms of engaging with culture.
In this report, we analyse the cultural data from the Scottish Government's Scottish Household Survey Culture (and Sport) Module, examining both attendance and participation in different cultural activities. The Scottish Government aims to overcome and remove barriers that exist for some people to engage with culture, given that evidence suggests that such engagement enhances socialisation and a sense of belonging. Our aim is to look at whether people can be categorized on the basis of their cultural consumption, and then examine whether belonging to those categories can be explained by the socio-demographic characteristics of the individual and wider geographical influences. This information will identify target groups and geographical areas where new initiatives to encourage engagement in culture could be piloted.
separate models were run, one for attendance and one for participation (based on a restricted selection of cultural indicator variables). The Latent Class Analysis showed that there was a sound empirical basis for grouping respondents on the basis of their pattern of activity based on this data. With this modelling approach, we found that four such groupings existed in the SHS data for attendance, and three for participation (see descriptions of groupings below). These groups were labelled according to their characteristics. The key points from this modelling process were:
For attendance:
• Four lifestyle groupings were identified within the data for attendance: these
lifestyle groups were labelled, ‘omnivores’; ‘heritage & libraries’; ‘audio visual arts’; and ‘low attendants’.
• Omnivores: individual members of the ‘omnivores’ are likely to be engaged in
all attendance measures; they are engaged in activities that are traditionally associated with popular and contemporary cultural activities.
• Heritage & Libraries: Members of the ‘heritage & libraries’ group have less
depth to their participation habits compared to ‘omnivores’, and a likely to be engaged in historical sites, museums, and libraries
• Audio Visual Arts: Members of the ‘audio visual arts’ class are differentiated
from other groups through their apparent engagement in activities such as the theatre, cinema and music.
• Low Attendants: The ‘low attendants’ tend to be less likely to be engaged in
any attendance activity.
• The ‘omnivores’ make up 26% of the population (survey); the ‘heritage &
libraries’ group 15%; the ‘audio visual arts’ category 28%; and the ‘low attendants’ 31%.
For participation:
• Three lifestyle groupings were uncovered in the participation field. These were
labelled, ‘omnivores’; ‘home based participants’; and ‘low participants’.
• Omnivores: Individuals who make up the ‘omnivore’ latent group are highly
engaged in all activities associated with participation in this report. In other words, they have great depth and range to their cultural participation behaviours.
• Home-based Participants: They are most likely to partake in reading, craft
work and the visual arts. They are active but much less so than the ‘omnivores’.
• Low Participants: The ‘low participants’ tend to engage in few if any
activities; although 49% of this group will be regular readers of literature this is well below the national average of over 60%.
• The ‘omnivores’ were the smallest group 7%, followed by the ‘home based
participants’ group with 30%. Whilst the ‘low participants’ group were the greatest proportion of the survey with 63%.
• These lifestyle groupings in participation appear clustered in space. High
levels of the ‘omnivore’ group are present in Northern Scotland. The ‘home based participants’ are clustered in the more ruralised areas. While, the ‘low participants’ are concentrated in greater numbers in the East, Central and Southern Scotland.
Individual Characteristics
Having grouped respondents and activities together using the latent class approach, we next looked at the characteristics of individuals that were associated with membership of each class or group. We did this through a multilevel multinomial regression model, which measures associational effects of various socio-demographic variables against the latent class groups, thereby determining who is likely to be a member of what group.
- Attendance
‘heritage & libraries’) were much more likely to be highly educated, and have higher occupational standing. There were gender differences amongst groups, with males more inclined than females to be members of the ‘low attendant’ group, whilst females were more likely to be in the highly engaged group compared to their male counterparts. Age was related to participation in predictable ways. Older people were less likely to participate, whilst the young were more inclined to be engaged in a variety of activities. Individuals in all three active classes measured against the ‘low attendant’ group were significantly more likely to reside in urban areas than rural parts of Scotland.
- Participation
The participation field followed similar patterns to that of the attendance field. Education was the key driver, with the highly educated being much more likely to be active as opposed to inactive. For both active classes (‘omnivores’ and ‘home based participants’) measured against the ‘low participant’ group, gender had a significant effect on class membership. Females were significantly less likely to be ‘omnivores’ than males, but were more likely to be in the ‘home based participants’ group. One clear distinction between attendance and participation was locality. Individuals in both active classes for participation were significantly more likely to live in rural as opposed to urban areas, while the opposite was the case for cultural attendance.
Area Lived In
structures in deprived areas that restricts cultural participation, over and above individual level socio-demographic characteristics.
Low attendants and Low Participants
The final chapter examined those individuals who were disengaged from attending and participating in cultural activities. In total, 28% of individuals surveyed were both ‘low attendants’ and ‘low participants’. Here we examine each field separately.
- Attendance
Individuals who were disengaged from attending cultural events were significantly more likely to have low or no educational qualifications, to be male, from the older age groups, particularly the 65 and over age bracket, and also more likely to be single. It also seems evident that members of the low activity group are significantly more likely to be individually deprived; less likely to be owner occupiers and to come from the highest income bracket, and more likely to suffer long term illness and have no car. Moreover, those living in urban areas are significantly less likely to be members of the low activity group.
- Participation
Conclusion
Using a quantitative approach, it is possible to examine survey findings for taking part in cultural activity and allows estimation of the relative influence that different demographic factors have on taking part. This new information provides cultural policymakers with a tool that allows them to target those groups of people who are at greatest cultural disadvantage, possibly by initiatives promoting activities, shown by this analysis, in which these groups are more likely to take part.
CHAPTER ONE:
BACKGROUND AND CONTEXT OF RESEARCH
Introduction
1.1 The aim of this document is to look for statistical evidence to support current theories on cultural engagement. It is important that the results can be extrapolated to represent the whole population otherwise there is a danger that the findings only relate to the sample that is selected. Statistical evidence in social research is most easily captured by surveys. Up until 2007, there had been no robust statistical data source covering cultural engagement in the whole of Scotland.
1.2 In 2007, the Scottish Government began a random survey of adults resident in Scotland, asking about cultural participation and attending cultural events along with their motivations and attitudes. Collected over two years, the Scottish Household Survey (SHS: Culture and Sport Module) is the first nationally representative survey of cultural consumption in Scotland. It provides a unique insight into the participation and attendance habits of individuals residing in Scotland and for the first time allows a picture of cultural consumption to be drawn.
1.3 As this survey is in module form and is harmonized with the full Scottish household survey, it contains a rich source of socio-demographic information. This enables researchers to examine what type of cultural activity is undertaken by Scottish residents and who does what. We have used the Scottish Household Survey Culture and Sport Module (SHS C&S) data because the sample is a stratified random sample which allows national inference and a wide range of activities including attending libraries and archives offices is covered.
income earners, those with high level qualifications and those living in the least deprived areas were more likely to be participants in cultural activities and attend cultural events.
1.5 We see this current report as a complementary extension to the ‘People and Culture in Scotland 2008’ report, exploring deeper into interesting aspects of the findings, first through social stratification, i.e. the relationship/association with links between education and income on activity; second, the importance of individual level characteristics, age, gender, and marital status on who is engaged in culture and to what levels and those that are culturally excluded; and finally how attendance and participation are influenced by a sense of place.
1.6 Therefore, this report uses the Scottish Government's Household Survey Culture Module to provide robust explanations for the existing patterns of cultural participation and attendance in Scotland.
Aims and Objectives
1.7 The overall aims of the research were to gather evidence to inform the Scottish Government’s understanding of cultural participation and attendance habits of individuals residing in Scotland. This analysis will, for the first time, provide an in-depth statistical analysis of cultural consumption which can inform Scottish Government Culture Policy with target groups and areas where new initiatives to encourage engagement in culture can be put in place.
1.8 In order to meet these aims the research pursued the following objectives:
• Uncover cultural lifestyle types in two domains, namely Attendance and
Participation;
• Use empirical analysis to determine the characteristics of cultural lifestyle
• Determine if cultural lifestyle types differ across different local authority areas
(LA) in Scotland and what influence living in deprived local authority areas, or rural as opposed to urban areas, has on cultural behaviour;
• Examine if the variation in cultural behaviour is still accounted for at the local
authority area level even when controlling for individual level compositional effects and area level characteristics;
• Explore the low-consumer typology group found in the two domains and
examine what activities this group is more likely to be engaged in and their socio-economic/demographic profile;
• Account for the different reasons why certain groups do or do not take part in
or attend cultural events, and make any links between the two.
Methodology and Modelling Approach
1.9 The simplest way at looking at whether socio-demographic factors influence the survey estimation of taking part in culture is to compare the proportion who do an activity in two or more groups. The problem with this is that within those groups, other demographic variables (for example, age) might be unequally distributed. We then do not know whether the difference in participation is due to the first factor of interest or age. The next stage would be to try to make the comparison groups equal for these additional demographic variables. However, there are insufficient observations to do this for all of the demographic factors which, when looked at in isolation, appear to influence taking part.
1.10 A modelling approach establishes where in the data the variation in the results lies rather than trying to test whether the result for one group is different to another. This is a more powerful statistical technique that allows you to control for other demographic factors with less data. We will therefore use such a modelling approach in this analysis.
Module’. First, we will try to identify cultural lifestyle types from the data using an approach which clusters activities and looks at underlying engagement using a tool called latent class analysis (LCA). Second, using the groups defined from the data, we will try to explain which individuals belong to those groups in relation to their socio-demographic variables using a multinomial regression model. Finally, we will try to determine whether any of the variation in the survey data (in terms of belonging to cultural lifestyle groups) is accounted for by the LA in which individuals reside. For this we will use an approach known as multilevel modelling. In the appendix we provide a detailed breakdown and additional technical information on the modelling strategies used. However, below we provide a brief overview of the modelling approaches to demonstrate their overall function and applicability for the research.
Latent Class Analysis
1.12 In this report we use Latent Class Analysis (LCA) to determine which cultural activities can be grouped together on an empirical basis. The aim is to identify sub-groups of respondents on the basis of them doing more or less of different types of cultural activities. For instance, those people who go to museums are also more likely to visit the library. Hence, there may be a correlation between the two variables. Models to explain data do not work well when there is correlation between variables. One way around this is to consider the separate activities in terms of a cluster of activities variable which we don’t measure directly (a latent variable). Whilst it is possible to be subjective and place groupings together based on personal experience, in order to have a greater understanding of cultural engagement, it is far more beneficial to base such a classification on empirical data.
by comparing the statistical fit of models with differing number of classes. The selection is then made on the basis of which model provides the best account of the observed data. Once we have established the number of classes for both cultural attendance and participation, we then assign each individual to a particular class according to their scores on the cultural activity variables. A more detailed explanation of this whole process is outlined in the appendix. At this point, it is then possible to use regression based modelling to determine which factors are associated with membership of a particular class.
Multinomial Regression
1.14 Using the latent variable identified in the LCA as a dependent variable we can investigate the relationship between latent class groups and a set of explanatory variables by regressing them onto this dependent variable. By incorporating stratification variables such as age, gender, health, and family composition to a multinomial regression model, we can set about establishing with statistical significance which factors are associated with membership of a particular class. This modelling approach is similar to a standard logistic regression model using a dependent variable that is indirectly measured by questions covering a range of cultural activities.
Multilevel Modelling
1.16 Multilevel modelling is a methodology which provides a framework for exploring how relationships vary across hierarchical structures, whether these be natural, or introduced to the sample design. The approach is especially useful in this report as it allows us to understand the variability associated with individuals and geography. To do this, the variance left over after consideration of individual level demographic variables is examined to see if it can be explained by residing in the Local Authority area. Initially, the primary purpose of these models is not to identify the causes of attending or participating in a cultural activity but to estimate the sources of variance i.e. how much is attendance and participation in a cultural activity dependent on who you are (socio-demographic variables) and how much is it dependent on where you are?
1.17 This multilevel approach will capture the variation that exists at the individual level and LA level simultaneously, determining the effect of place on fostering cultural lifestyles, after controlling for composition and context.
SHS Culture Data
1.18 The SHS Culture (and Sport) Module pooled across 2007 and 2008 collated cultural data from 6,764 adults via face to face interviews. Households were drawn from the postcode address file, with interviews conducted randomly from a selected member of the household aged 16 or over. The fundamental aim of the SHS Culture (and Sport) Module is to collect data on the cultural consumption behaviours and attitudes of the population. The Module is therefore a representative sample of adults aged 16 and over who are resident in Scotland.
in culture, the engagement with the survey and accuracy of answers may be poor. The cultural variables selected in our modelling approach are derived from questions on whether the respondent did an activity (yes or no). Information about whether an individual did an activity more than once a week etc is not examined here. Similarly, this study does not evaluate the experience and whether it is something the respondent wants to do in the future. Here the focus is on whether a respondent does an activity or not as it provides a comprehensive overview of cultural lifestyle in Scotland.
Cultural Indicators
1.20 Due to data constraints it was necessary to limit the analysis to a reduced selection of cultural participation and attendance variables. However, the selection did have a strong theoretical basis to ensure that both popular and more ‘high brow’ activities were covered.
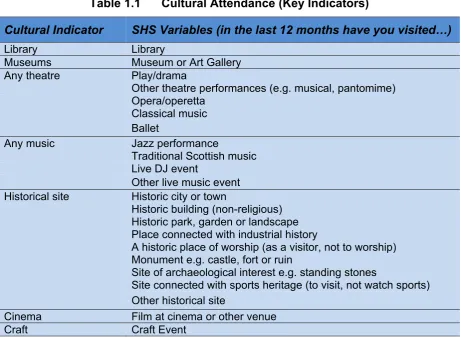
Table 1.1 Cultural Attendance (Key Indicators)
Cultural Indicator SHS Variables (in the last 12 months have you visited…)
Library Library
Museums Museum or Art Gallery Any theatre Play/drama
Other theatre performances (e.g. musical, pantomime) Opera/operetta
Classical music Ballet
Any music Jazz performance
Traditional Scottish music Live DJ event
Other live music event Historical site Historic city or town
Historic building (non-religious) Historic park, garden or landscape Place connected with industrial history
A historic place of worship (as a visitor, not to worship) Monument e.g. castle, fort or ruin
Site of archaeological interest e.g. standing stones
Site connected with sports heritage (to visit, not watch sports) Other historical site
Cinema Film at cinema or other venue
Craft Craft Event
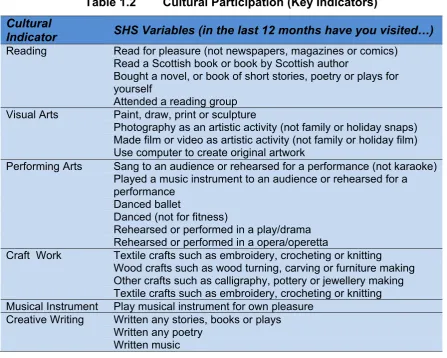
Table 1.2 Cultural Participation (Key Indicators) Cultural
Indicator SHS Variables (in the last 12 months have you visited…) Reading Read for pleasure (not newspapers, magazines or comics)
Read a Scottish book or book by Scottish author
Bought a novel, or book of short stories, poetry or plays for yourself
Attended a reading group Visual Arts Paint, draw, print or sculpture
Photography as an artistic activity (not family or holiday snaps) Made film or video as artistic activity (not family or holiday film) Use computer to create original artwork
Performing Arts Sang to an audience or rehearsed for a performance (not karaoke) Played a music instrument to an audience or rehearsed for a performance
Danced ballet
Danced (not for fitness)
Rehearsed or performed in a play/drama Rehearsed or performed in a opera/operetta
Craft Work Textile crafts such as embroidery, crocheting or knitting Wood crafts such as wood turning, carving or furniture making Other crafts such as calligraphy, pottery or jewellery making Textile crafts such as embroidery, crocheting or knitting Musical Instrument Play musical instrument for own pleasure
Creative Writing Written any stories, books or plays Written any poetry
Written music
Socio-Demographic Variables
1.23 One of the key aims of the research was to determine the socio-demographic factors associated with membership of a particular class. We identified from the SHS Culture Module a number of socio-demographic characteristics which might predict membership of each latent class for cultural attendance and participation in Scotland.
is coded to seven categories ranging from the highest level degree (level 5) to no qualifications (Education Base = No Qualifications).
1.25 Other important socio-demographic variables have been shown to be associated with cultural attendance and/or participation in Scotland (People and Culture in Scotland, 2008). To reflect this we include age; gender; marital status; limiting long-term illness; car ownership (access to a car); tenure and urban-rural identifier. These will serve as control variables to remove the possibility of any hidden confounding effects with those of income and education. This research seeks to test whether these variables do have subtle effects on choice of cultural lifestyle, alongside the more dramatic influences previously demonstrated for income and education.
Area Level Variables
1.26 It is important to clearly identify which spatial scale this analysis will be set at. We know that individuals reside in households that are situated in neighbourhoods. These neighbourhoods are located in administration wards, which are located in local authorities, and further grounded by region. Therefore, these spatial scales will have contextual or composition (macro level factors) forces that may influence participation and attendance habits. Ideally we would take into account local geographical influences (including social networks, budget and what facilities are nearby). Unfortunately, the SHS Module data only allows study at the larger local authority area. This might capture some but not all of the more local influences.
simply an artefact of population composition. After we have taken account of area level deprivation, we make the assumption that any variance in the data still outstanding can be explained by residing in the Local Authority area.
Report Structure
CHAPTER TWO: CONSUMPTION OF CULTURAL ACTIVITIES IN
SCOTLAND
Introduction
2.1 In this chapter, we use a combination of summary statistics and cross-tabulations to gain an insight into those who attend and engage in cultural activities across Scotland. Whilst we are aware of the comprehensive descriptive analysis in the ‘People and Culture in Scotland’ report, the indicators here differ (some are derived variables combining several activities) and require exploration here. This chapter will therefore include an in-depth exploration of the relationship between our chosen cultural indicators and various stratification variables. We will then end this chapter by mapping attendance and participation in these cultural activities across the thirty-two Local Authority areas of Scotland.
2.2 We define attendance as visiting a cultural event or activity on one or more occasions in the past 12 months. Seven cultural activities are examined: Library, Theatre, Music event, Cinema, Historical Site, Museum and Craft event.
2.3 Participation refers to those individuals who have actually taken part or been engaged in a cultural activity on one or more occasions over the past 12 months. Here six cultural activities are examined: Visual Arts, Reading, Performing Arts, Craft Work, Playing a Musical Instrument and Creative Writing.
Attendance
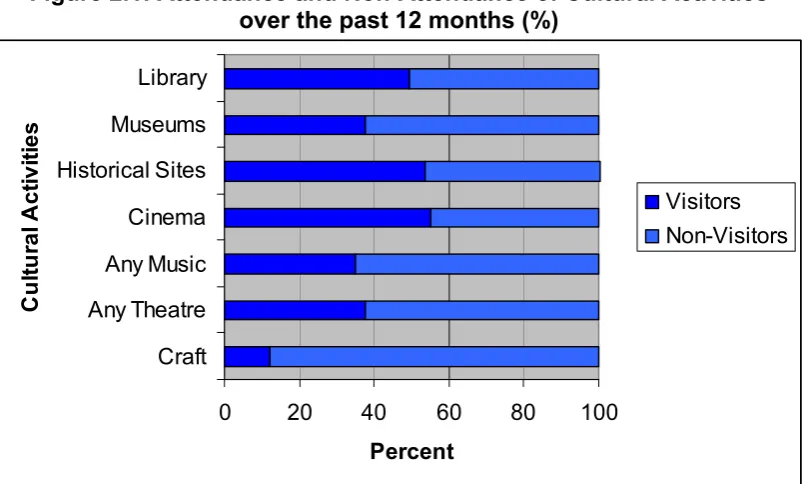
[image:24.595.98.500.295.537.2]2.5 Of the seven indicators used in this study, the most popular attractions are historical sites and the cinema, with more than half of the people sampled reporting attending such venues (see figure 2.1). Libraries are also popular with just under half the population reporting that they attended. Visiting theatre based activities, museums, and music events share similar levels of engagement with over one third of the population attending these activities. Around 12% of respondents report attending Craft events.
Figure 2.1: Attendance and Non-Attendance of Cultural Activities over the past 12 months (%)
0 20 40 60 80 100
Craft Any Theatre Any Music Cinema Historical Sites Museums Library C u lt u ral A ct ivi ti es Percent Visitors Non-Visitors Participation
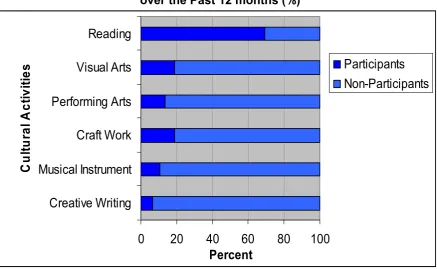
these activities. As regards craft work, levels of participation were only slightly higher than other activities, with one fifth of the population reported to partake in this activity. The descriptive data suggests that categories of cultural participation generally show a lower uptake than the categories of cultural attendance selected in this study.
Figure 2.2: Participation and Non-Participation of Cultural Activities over the Past 12 months (%)
0 20 40 60 80 100
Creative Writing Musical Instrument Craft Work Performing Arts Visual Arts Reading
Cu
lt
u
ra
l Ac
ti
v
it
ie
s
Percent
Participants Non-Participants
Demographic breakdown of participation and attendance
2.7 The breakdown of participation and attendance by demographic variables is shown in the appendix. Education, income and age show the strongest association. These are likely to be important factors in any model to explain cultural lifestyle choice. In sum we found the following interesting patterns:
− Those with the highest qualifications and most disposable income are more
− Of those who attended and participated, women are more likely than men to
report being active.
− Attendance by age varies according to the cultural activity consumed. In the
attendance field several cultural activities are popular with the youngest group aged 16-29. Indeed, there is a negative relationship between attendance and age for the cinema, going to a music event and visiting the library, although the latter is consumed in healthy numbers by all age groups. In participation, there is evidence of a negative relationship between age and the visual arts, creative writing and playing a musical instrument: as age increases, participation in these activities decreases.
Examining Geography: Mapping Cultural Consumption by Local Authority
2.8 To fully understand cultural behaviour, it is important not to ignore the influence that the context in which people live out their daily lives imparts on their participation habits. Any form of cultural engagement will undoubtedly be influenced by place, not only through interaction with people they reside with but also through location, as this interaction must take place somewhere. Furthermore, access to facilities and opportunity structures in more urban areas will perhaps act as an additional influence, as well as other environmental (macro level) factors. Therefore, place is as important as the previous measures in determining cultural participation. The results are shown in appendix 1. It is clear that there are clusters of local authorities with a similar proportion of people engaged in culture and so geography is likely to be a factor which influences cultural choices.
Next Step
CHAPTER THREE: LATENT CLASS ANALYSIS OF CULTURAL
ATTENDANCE AND PARTICIPATION IN SCOTLAND
Introduction
3.1 In this report, we use Latent Class Analysis (LCA) to examine which activities can be meaningfully grouped together on an empirical basis to form cultural lifestyle groups (based on the indicators of attendance and participation). Cultural lifestyles are formed through consumption habits of various activities, which can be captured through a Latent Class Analysis (LCA). The LCA model reduces a large number of observations to a smaller number of classes or categories on the basis of responses to a vector of variables. The LCA will uncover the cultural lifestyle typologies that exist, the size of these typologies, and the probabilities of consuming a cultural indicator given membership of a given lifestyle group (typologies). For attendance and participation, we used the activities defined in table 1.1 and table 1.2.
group, and the probabilities of participating in different activities given membership of each group.
Latent Class Model of Cultural Attendance
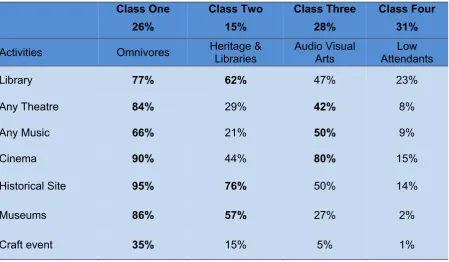
[image:29.595.73.523.303.565.2]3.3 The latent class model of cultural attendance is shown in Table 3.1. We can identify four lifestyle groups or classes from the data. We have named these groups as follows: ‘omnivores’, ‘heritage & libraries’, ‘audio visual arts’ and ‘low attendants’.
Table 3.1 Latent Class Model of Cultural Attendance in Scotland
Class One Class Two Class Three Class Four
26% 15% 28% 31%
Activities Omnivores Heritage & Libraries Audio Visual Arts Attendants Low
Library 77% 62% 47% 23%
Any Theatre 84% 29% 42% 8%
Any Music 66% 21% 50% 9%
Cinema 90% 44% 80% 15%
Historical Site 95% 76% 50% 14%
Museums 86% 57% 27% 2%
Craft event 35% 15% 5% 1%
Class 1: Omnivores
and are highly likely to visit historic sites (95%). Despite it being their least popular activity, this group is the most likely to visit craft event (35%).
Class 2: Heritage & Libraries
3.5 There is a cluster defining a consumption typology which we have termed ‘heritage & libraries’, which reflects the characteristic behaviour of those in this group. An individual assigned to this group has a high probability of visiting places of historic interest, museums and libraries, yet rejects other indicators such as the theatre, music and the arts. They are specifically predisposed to enjoy heritage, museums and libraries to the exclusion of other activities, although their consumption of such activities is not as high as those individuals in the omnivore group.
Class 3: Audio Visual Arts
3.6 This group represents 38% of the population. It has been labelled here the ‘audio visual arts’ group, as members of this class are highly engaged with the cinema, and too a lesser degree music and the theatre. Indeed, a member of this class has a 70% probability of visiting the cinema, which is clearly their cultural activity of choice, although the probability of them attending music events and theatres is high relative to the national average attendance for these activities (as shown earlier in the document – see Figure 2.1). This is not the case for visiting museums, historic sites, libraries and craft events.
Class 4: Low Attendants
events or places at all, it is most likely to be the library, although the probability of visiting is still low.
Latent Class Model of Cultural Participation
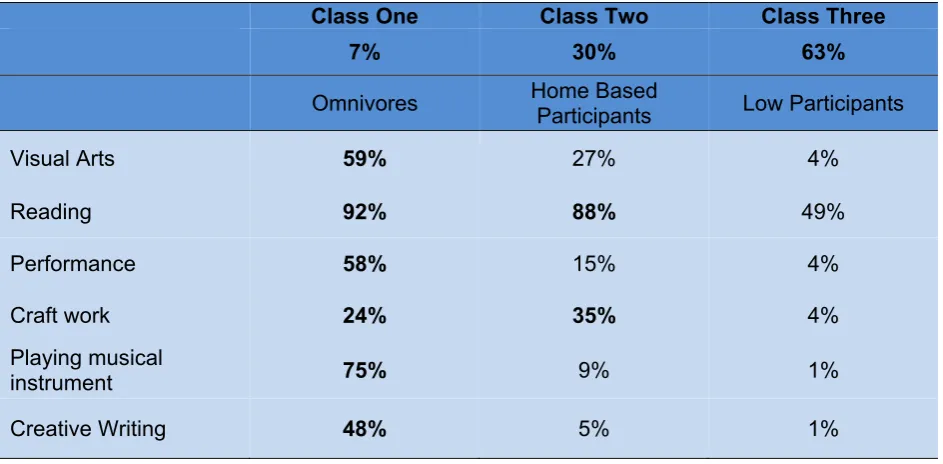
[image:31.595.67.539.359.591.2]3.8 The latent class model of cultural participation is shown in Table 3.2. We can identify three lifestyle groups or classes from the data. We have named these groups as follows: ‘omnivores’, ‘home based participants’ and ‘low participants’. The following will examine each of the typologies created through the latent class model, and attempt to understand these types of individuals in relation to their participation habits.
Table 3.2 Latent Class Model of Cultural Participation in Scotland
Class One Class Two Class Three
7% 30% 63%
Omnivores Home Based Participants Low Participants
Visual Arts 59% 27% 4%
Reading 92% 88% 49%
Performance 58% 15% 4%
Craft work 24% 35% 4%
Playing musical
instrument 75% 9% 1%
Creative Writing 48% 5% 1%
Class 1: Omnivores
more likely to participate in all of the cultural activities than members of the other groups. An individual who is a member of this group is particularly likely to read for pleasure (92%), play a musical instrument (74%) and rehearse or perform an activity classed as the performing arts (58%). Individuals in this group, based on their conditional probability of consumption have an insatiable hunger for all cultural pursuits chosen in this study.
Class 2: Home Based Participants
3.10 This group represents 30% of the population. This group is labelled the ‘home based participants’ because they have a high probability of reading and engagement in craft based activities, both of which can done in the home environment. An individual assigned to this group has an 89% probability of reading literature and 38% of partaking in craft based activities. While they are modest in their engagement in arts and performance they do not reject these forms and take part in these activities, but at more modest levels.
Class 3: Low Participants
3.11 This class of participators are the least likely to partake in any of the cultural activities identified. They represent nearly two thirds of the population. This ‘low participant’ group reject both highbrow and popularised cultural activities. If they participate in any cultural activities at all, it is most likely to be reading, although the probability of participating in reading is still well below the average.
Mapping Lifestyle Groups by Local Authority Areas
attendance and participation are under and over represented. This provides evidence for an effect of geography on choice of cultural lifestyle. We cannot assume that this geography factor only affects those people currently living in that local authority; it may affect anybody who might live there.
Next Step
CHAPTER FOUR: UNDERSTANDING THE DRIVERS OF CULTURAL
ATTENDANCE AND PARTICIPATION IN SCOTLAND
Introduction
4.1 During this section of the report, we determine the key drivers of cultural attendance and participation in Scotland. Here we use different modelling techniques to explain cultural behaviour by taking account of the factors which influence the individual as well as determining whether consumption varies by geographical area after controlling for individual and area level predictors of cultural behaviour.
4.2 We will study attendance and participation in two separate models. The latent classes identified earlier are treated as categorical dependent variables in our models. The individual level explanatory variables include education, income, gender, age, tenure, car access, marital status, limiting long-term illness and an urban-rural identifier for where the individual resides. We also include an explanatory variable at the Scottish local authority level (2006 multiple index of deprivation or SIMD: 15% by rank of most deprived areas) to act as a proxy for both compositional and contextual effects. The explanatory variables used in this analysis were discussed in the Executive Summary. However, a detailed overview of how each explanatory variable was constructed is provided in the appendix.
multinomial distribution. In probability theory, a multinomial distribution is a generalisation of the binomial distribution. The counts at the different combinations are also assumed to be independent of each other with a fixed total. The categories for attendance and participation are not ordinal, so the following models are characterised as unordered multinomial regression models. A detailed overview of this modelling technique is provided in the appendix.
4.4 The Scottish data has a hierarchical sample design – individuals sampled within Scottish local authority areas. To estimate the spatial source of variation in cultural attendance and participation, a hierarchical or multilevel modelling is necessary. Hierarchical or multilevel modelling is a methodology which provides a framework for exploring how relationships vary across hierarchical structures, whether these be natural, or introduced in the sample design. The approach is used to gauge the variability associated with each level of the hierarchy. For our analysis, the purpose of this statistical technique is to model the variation in cultural attendance and participation among individuals within Scottish local authority areas. If variation at the local authority level still exists once individual and area level variables are taken into account, then this would suggest that processes operating in these places (local authority areas) impact on cultural behaviour. In summary, where individuals reside has important influence on cultural attendance and participation in Scotland. A more in-depth account of multilevel modelling, why it is was chosen and its benefits is provided in the appendix.
4.6 The following sections examine the key drivers of cultural attendance and participation. Here we are modelling the latent typologies of attendance and participation as derived and explained in Chapter 3. Two levels (individual and LA) were stated in the multilevel regression. For ease of interpretation, we provide a summary table of the model results containing only those variables which were found to be statistically significant (at the 95% confidence level) and whether they had a positive or negative effect. We also interpret the model findings in terms of relative risk. This is defined as the ratio of the probability of choosing one outcome category over the probability of choosing the reference category is often referred as relative risk (and it is also more commonly known as odds). For example, we can determine from the model results how many times a female is more likely to be a member of a particular attendance or participation group than a male. We do however provide full details of the model results (coefficients/standard errors) and residual plots with confidence intervals in the appendix.
Key Drivers of Cultural Attendance
4.8 Gender has a significant relationship with class membership when compared against the reference category ‘low attendants’. Females are 1.9 times more likely than males to be members of the ‘omnivore’ class than ‘low attendants’. The odds for both the ‘heritage & libraries’ group and the ‘audio visual arts’ class, are 1.4 times respectively. This confirms that females rather than males are more likely to members of these classes than of the ‘low attendants’ group. The results here identify that the real gender divide is between attendance (different levels) and non-attendance.
4.9 Age is also an important indicator of cultural attendance. Here we use the base category age 30-45 or middle age. The results suggest older people are significantly less likely to attend cultural events. They are significantly less likely to be ‘omnivores’ or in the ‘heritage & libraries’ or ‘ audio visual arts’ class when compared against ‘low attendants’. A similar pattern exists for the 45-64 age group although not for those in the ‘heritage & libraries’ class who have a high probability of visiting places of historic interest and museums. Those in the younger age group 18-29 are 1.5 times more likely than the middle age group to be members of the ‘audio visual arts’ class than ‘low attendants’. This reflects their penchant for visiting the cinema and music events.
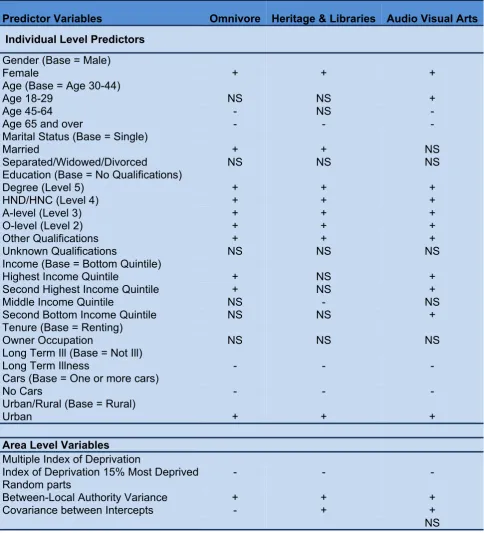
Table 4.1 Multinomial Multilevel Model of Cultural Attendance: Summary Table
Predictor Variables Omnivore Heritage & Libraries Audio Visual Arts
Individual Level Predictors
Gender (Base = Male)
Female + + +
Age (Base = Age 30-44)
Age 18-29 NS NS +
Age 45-64 - NS -
Age 65 and over - - -
Marital Status (Base = Single)
Married + + NS
Separated/Widowed/Divorced NS NS NS
Education (Base = No Qualifications)
Degree (Level 5) + + +
HND/HNC (Level 4) + + +
A-level (Level 3) + + +
O-level (Level 2) + + +
Other Qualifications + + +
Unknown Qualifications NS NS NS
Income (Base = Bottom Quintile)
Highest Income Quintile + NS +
Second Highest Income Quintile + NS +
Middle Income Quintile NS - NS
Second Bottom Income Quintile NS NS +
Tenure (Base = Renting)
Owner Occupation NS NS NS
Long Term Ill (Base = Not Ill)
Long Term Illness - - -
Cars (Base = One or more cars)
No Cars - - -
Urban/Rural (Base = Rural)
Urban + + +
Area Level Variables
Multiple Index of Deprivation
Index of Deprivation 15% Most Deprived - - -
Random parts
Between-Local Authority Variance + + +
Covariance between Intercepts - + +
NS
4.11 Both long term illness and no cars are proxies for individual deprivation. Those individuals with a long term illness or no cars are significantly less likely to be members of all three classes when compared against the ‘low attendants’ group. Owner occupation was included as a measure of affluence but didn’t have an effect on membership of the three lifestyle groups.
4.12 Urban areas usually have a high population density and are more likely to house cultural attractions. Therefore, individuals living in urban areas are likely to have higher levels of cultural attendance than those in rural areas perhaps because they have greater opportunities for cultural attendance. This is borne out by the results. When compared with the ‘low attendants’, living in an urban area as opposed to a rural location has a significant positive effect on membership of the three lifestyle groups. It has the largest effect on the ‘omnivores’, the utmost consumer group. Those living in urban areas are 1.3 times more likely than those from rural locations to be members of the ‘omnivore’ class than of ‘low attendants’.
4.13 We also included an area level predictor: SIMD (multiple index of deprivation - 15% most deprived areas). When compared with the ‘low attendant’ reference group, living in a more deprived local authority area is significantly negatively associated with membership of the three lifestyle groups. It has the largest negative effect on the ‘omnivores’, who tend to live in more affluent areas. Yet similar patterns are found for the ‘heritage & libraries’ and the ‘audio visual arts’ class when compared against the ‘low attendant’ group. It is therefore apparent that those with low levels of cultural attendance tend to live in those Scottish local authorities’ areas which are the most deprived.
Key Drivers of Cultural Participation
4.15 The multilevel multinomial model for participation (see Table 4.4) follows the same format as the attendance model, with a different dependent variable. Here participation which contains three categories (‘omnivores’, ‘home based participants’ and ‘low participants’) is the dependent variable. Using the ‘low participant’ latent class as the reference category means that for a particular demographic, the coefficient given under one latent class is that for the predictive power of belonging to that class relative to belonging to the ‘low participant’ class.
4.16 Education, as it was for attendance, is a key driver of cultural lifestyle variation. In addition, gender appears a salient measure of class membership. While other variables offer some statistically significant findings, it is education and gender which appear to be the largest determinants of segregating the different latent lifestyle classes. The following will examine these key socio-demographic drivers.
educated to Level 4, twice as likely if they have a Level 3 attainment level, and over 1.5 times more likely if they have a Level 1 or 2 grade.
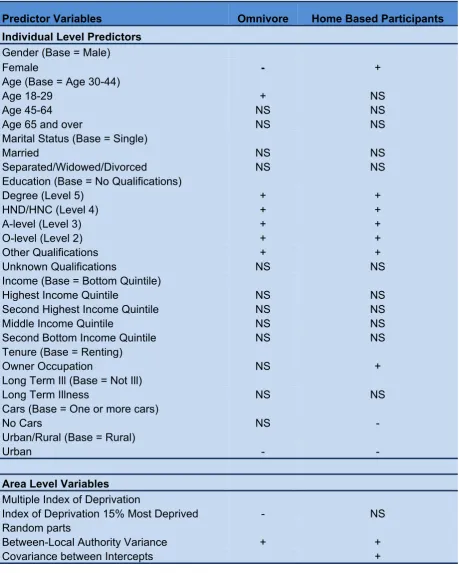
Table 4.4: Multinomial Multilevel Model of Cultural Participation: Summary
Predictor Variables Omnivore Home Based Participants Individual Level Predictors
Gender (Base = Male)
Female - +
Age (Base = Age 30-44)
Age 18-29 + NS
Age 45-64 NS NS
Age 65 and over NS NS
Marital Status (Base = Single)
Married NS NS
Separated/Widowed/Divorced NS NS
Education (Base = No Qualifications)
Degree (Level 5) + +
HND/HNC (Level 4) + +
A-level (Level 3) + +
O-level (Level 2) + +
Other Qualifications + +
Unknown Qualifications NS NS
Income (Base = Bottom Quintile)
Highest Income Quintile NS NS
Second Highest Income Quintile NS NS
Middle Income Quintile NS NS
Second Bottom Income Quintile NS NS
Tenure (Base = Renting)
Owner Occupation NS +
Long Term Ill (Base = Not Ill)
Long Term Illness NS NS
Cars (Base = One or more cars)
No Cars NS -
Urban/Rural (Base = Rural)
Urban - -
Area Level Variables
Multiple Index of Deprivation
Index of Deprivation 15% Most Deprived - NS
Random parts
Between-Local Authority Variance + +
Covariance between Intercepts +
4.18 Once education is controlled for, the other stratification measure that is used, namely income, is not significant. That is, income does not influence membership of the ‘home based participant’ and the ‘omnivore’ class measured against the ’low participant’ group.
4.19 Gender is also a key driver across the participation lifestyle classes. Females are significantly less likely to be ‘omnivores’ than males when compared against the reference category ‘low participants’. In effect, females are 1.3 times more likely to be ‘low participants’ than an ‘omnivore’. Yet, the opposite is true for membership of the ‘home based participant’ class. Here, females are twice more likely than males to be ‘home based participants’ than ‘low participants’.
4.20 Generally, age does not influence group membership in the participation model. However, there is one statistically significant finding and it involves the young age cohort (18-29) in the ‘omnivore’ class. Young people are twice more likely to be ‘omnivores’ than ‘low participants’. Furthermore, marital status and disability measures do not offer any significant insight into class membership.
4.22 As with the attendance model, we include one predictor at the local authority area level of the model: multiple index of deprivation (15% most deprived areas). An area’s deprivation is also significant when comparing ‘omnivores’ against the ‘low participants’. Indeed, a local authority area in the top 15% most deprived is more likely to have ‘low participants’ in their relative populations compared to ‘omnivores’. There is no significant effect of area level deprivation on membership of the ‘home based participants’ group.
4.23 The model results also show that there is significant unexplained variation between local authorities in the membership of each of the three lifestyle groups for cultural participation, even after controlling for individual and area level factors. Like cultural attendance, the variation is fairly small but significant at the 95% confidence level (see appendix 4 for full details). This implies that unexplained processes operating at the local authority area level matter and that place is a significant influence on cultural participation even after accounting for individual and area level factors. Moreover, those local authorities with high (low) membership of a latent class (‘omnivore’, ‘home based participants’ and ‘low participants’) were also significantly more likely to have high (low) membership of other classes. A full statistical explanation of the findings is discussed in the appendix.
Next Step
CHAPTER FIVE: WHO ARE MEMBERS OF THE ‘LOW ACTIVITY’
GROUPS?
Introduction
5.1 In Chapter Four, we examined the key drivers of cultural attendance and participation in Scotland. The latent class analysis (described in Chapter Three) derived categorical dependent variables with more than two values for both cultural attendance and participation. To reflect this, an unordered multinomial regression model was used and explanatory variables were added at the individual level to gauge the key drivers of cultural attendance and participation. We also wanted to take into account the variation in cultural consumption between Scottish local authority areas and explain any existing variation after controlling for both individual and area level factors, including explanatory variables at the Scottish local authority level to act as a proxy for both compositional and contextual effects.
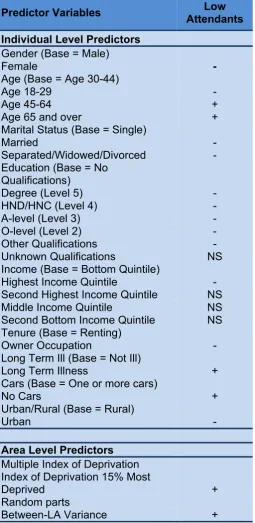
5.2 The multilevel multinomial regression analyses in Chapter Four used the low activity groups (‘low attendants’ for cultural attendance and ‘low participants’ for cultural participation) as the reference category. The models show that those in these low attendants or participants groups are generally more likely to be male, old and less likely to be highly educated and be on a high income. At the area level, those local authorities that are amongst the top 15% deprived are more likely to have a greater proportion from these low activity groups.
include the equivalent individual level and area level variables as discussed previously in Chapter Four.
5.4 Descriptive statistics show that 28% of individuals in SHS are both ‘low attendants’ and ‘low participants’. However, as in Chapters 3 and 4, the purpose of this report is to model attendance and participation separately. The outcome for cultural attendance is a binary variable (‘Low Attendants’ group: yes/no). The same applies to participation, except the binary outcome variable is ‘Low Participants’: yes/no. Separate logistic models are used to assess the influence of independent variables on the odds of being in the low activity group or not. A multilevel analysis is used to model the relationship between membership of the low activity group for attendance and participation separately and a number of independent variables. Two levels (individual and local authority) are stated in our multilevel logistic regression.
5.6 For ease of interpretation, we provide a summary table (see Table 5.1) of the model results containing only those variables which were found to be statistically significant (at the 95% confidence level) and whether they had a positive or negative effect. We also interpret the model findings in terms of odds (as defined in Chapter 4). We do however provide full details of the model results (coefficients/standard errors) and residual plots with confidence intervals in the appendix 5.
Key Drivers of Low Cultural Attendance
5.7 There is a negative linear relationship between education and membership of the ‘low attendants’ group. When compared against the reference category ‘no qualifications’, the higher the educational attainment the less likely an individual has low levels of cultural attendance. In other words, members of the low activity group are significantly more likely to have low levels of educational attainment when compared with those who are active.
5.8 Those with low levels of cultural attendance (in the low activity group) have other defining individual characteristics. They are significantly more likely to be male, from the older age groups, particularly the 65 and over age bracket, and also more likely to be single. For instance, those aged over 65 are 1.9 times more likely to be in the ‘low attendants’ class than other lifestyle groups.
Table 5.1 Multilevel Binary Logistic Model of Low Cultural Attendance: Summary Table
Predictor Variables Low Attendants Individual Level Predictors
Gender (Base = Male)
Female -
Age (Base = Age 30-44)
Age 18-29 -
Age 45-64 +
Age 65 and over +
Marital Status (Base = Single)
Married -
Separated/Widowed/Divorced - Education (Base = No
Qualifications)
Degree (Level 5) -
HND/HNC (Level 4) -
A-level (Level 3) -
O-level (Level 2) -
Other Qualifications -
Unknown Qualifications NS
Income (Base = Bottom Quintile)
Highest Income Quintile -
Second Highest Income Quintile NS
Middle Income Quintile NS
Second Bottom Income Quintile NS Tenure (Base = Renting)
Owner Occupation -
Long Term Ill (Base = Not Ill)
Long Term Illness +
Cars (Base = One or more cars)
No Cars +
Urban/Rural (Base = Rural)
Urban -
Area Level Predictors
Multiple Index of Deprivation Index of Deprivation 15% Most
Deprived +
Random parts
Between-LA Variance +
5.10 At the local authority level, there is a positive association between individuals living in the most deprived local authorities and membership of the ‘low attendants’ group. Living in those Scottish local authority areas that are the most deprived along with being individually deprived are the key drivers of low cultural attendance.
5.11 As with the models in Chapter Four, we used a multilevel approach to determine whether there was any unexplained variation at the local authority level which could be accounted for by individual and area level variables. Initially, a statistical test was conducted to determine whether there are significant differences between Scottish local authorities. This was found to be the case (full details of the tests and results can be found in the appendix) and validated the use of the multilevel approach. To determine the variation at the local authority level where the outcome variable is binary requires a more complicated procedure than when the variable being measured is continuous. For ease of interpretation, we explain the process and detail how this is achieved in the appendix 5. However, as table 5.1 shows, 1% of the variation is at the local authority level and it is statistically significant. This is fairly small, but nevertheless suggests that evidence of a local authority effect on low cultural attendance is not just a product of selection effects – that is of people with similar characteristics living in close proximity to each other.
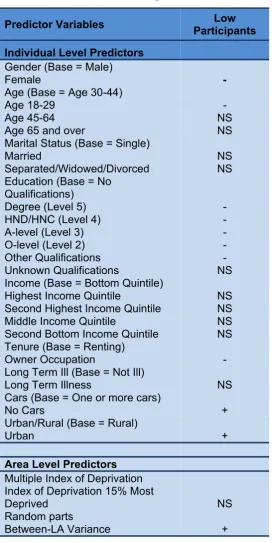
Key Drivers of Low Cultural Participation
5.13 Those with low levels of cultural participation (in the ‘low participants’ group) have other defining individual characteristics. Members of the ‘low participants’ group are significantly more likely to be male and less likely to be from the youngest age bracket. Both the other age bands are non-significant when compared against the 30-44 middle age category, while neither marital status nor income is a determinant of membership of the low ‘participants’ group.
5.14 Despite there being no discernible effect of having a long term illness on low cultural participation, there is some evidence that members of the ‘low participant’ group are significantly more likely to be individually deprived. As with cultural attendance, not only are such individuals more likely to be less educated, they are also significantly less likely to be homeowners. Moreover, they are 1.3 times more likely not to own a car. In contrast to cultural attendance, members of the ‘low participant’ group are significantly more likely to live in urban areas as opposed to rural parts of Scotland.
Table 5.2 Multilevel Binary Logistic Model of Low Cultural Participation: Summary Table
Predictor Variables Low Participants Individual Level Predictors
Gender (Base = Male)
Female -
Age (Base = Age 30-44)
Age 18-29 -
Age 45-64 NS
Age 65 and over NS
Marital Status (Base = Single)
Married NS
Separated/Widowed/Divorced NS Education (Base = No
Qualifications)
Degree (Level 5) -
HND/HNC (Level 4) -
A-level (Level 3) -
O-level (Level 2) -
Other Qualifications -
Unknown Qualifications NS
Income (Base = Bottom Quintile)
Highest Income Quintile NS
Second Highest Income Quintile NS
Middle Income Quintile NS
Second Bottom Income Quintile NS Tenure (Base = Renting)
Owner Occupation -
Long Term Ill (Base = Not Ill)
Long Term Illness NS
Cars (Base = One or more cars)
No Cars +
Urban/Rural (Base = Rural)
Urban +
Area Level Predictors
Multiple Index of Deprivation Index of Deprivation 15% Most
Deprived NS
Random parts
Between-LA Variance +
Next Step
CHAPTER SIX: CONCLUDING THOUGHTS
Introduction
6.1 The overall aim of the project was ‘to determine if cultural lifestyle typologies existed for attendance and participation in Scotland, and what the key drivers were that determined these lifestyle groupings’. Here we examine each of the main research objectives and discuss the implications of our findings.
Are there cultural lifestyle types in Attendance and Participation?
6.3 Exploring the lifestyle groupings in both fields (attendance and participation) offers an interesting insight into cultural consumption in Scotland. For both attendance and participation, there is a group who are generally the most likely to take part in all of the activities listed. These are the ‘omnivores’ and they exist in both domains, although their number is less in the participation field. They consume a wide variety of culture (both popular and highbrow). At the opposite end of the spectrum, both fields contain lifestyle groups who share similar consumption patterns in that they are either ‘low attendants’ or ‘low participants’ in any form of cultural activity. They do not engage in exclusive cultural activities and although they are slightly more likely to engage in more popularised activities (go to the cinema/library or read for pleasure) such consumption patterns are still well below the average. In both fields, these lifestyle groups appear to be less culturally engaged.
Using empirical analysis to determine the characteristics of cultural lifestyle types measured by stratification and other socio-demographic variables
6.5 We found clear evidence from the data that individuals with similar cultural patterns tend to be alike in socio-demographic characteristics. Evidence points to consumption in Scotland being socially stratified, with educational attainment the key driver in conditioning lifestyles. The higher an individual is educated the more likely they are to be active in attendance and participation. The highest educated are more likely to be ‘omnivores’ in both fields than all the other groups and are more likely to be active in other groups as opposed to those in the low activity groups. A status order clearly exists. In each of these fields, the culturally excluded (‘low attendants’ and ‘low participants’), are statistically more likely to be individuals of low educational attainment. Scottish cultural consumption (attendance and participation) appears to fit an omnivore-univore framework rather than the traditional Bourdieusian elite to mass homology model (for more details see Peterson, 2005). In simple terms, we stress that the highly educated are distinguished from other groups by a depth and range of consumption habits, rather than adherence to elitist cultural activities that promote their position in society.
6.6 Underlying the statistical results, several different processes are at work in shaping individuals’ patterns of cultural consumption. While our results give gravitas to the proposition that educational stratification is centrally involved in the differentiation of lifestyle types, it is also clear that other factors facilitate and inhibit cultural lifestyles:
the basis of education but to take into account the salience of other determinants on the membership of particular lifestyle groups.
Determine if cultural lifestyle types differ across different local authority areas in Scotland and what influence living in deprived local authority areas, or rural as opposed to urban areas has on cultural behaviour
6.8 Individuals living in urban areas are likely to have higher levels of cultural attendance than those in rural areas perhaps because they have greater opportunities for cultural attendance. But for participation, we may expect the results to differ. This is borne out by our findings. Living in an urban area has a positive effect on membership of the three cultural attendance lifestyle groups (‘omnivore’, ‘heritage & libraries’ and ‘audio visual arts’) particularly for the former. However, for participation, those living in rural areas are more likely to be members of the two lifestyle groups (‘omnivore’ and ‘home based participants’). Not only are the types of participation activities analysed here more receptive to individuals in less urbanised areas but the attendance opportunities in urban areas clearly mean that individuals tend to be more selective and therefore may participate less in some activities.
consumption behaviour, observable even when the principal theoretical individual level and area level characteristics are accounted for. However, it is important to identify that we make no leaps of faith to identify what contextual mechanisms are accounting for these local authority forces. That is, we can only assume that the unexplained variation at the local authority level may be due to the inbuilt culture of the area or the value different local authorities place on enhancing attendance and participation through funding, advertising or local programmes.
6.10 To ignore the fact that individuals reside in different places, that they cluster in space, that they interact in these places and space, and that environmental forces impact on behaviour, is to ignore the role the local authority level plays on the individual cultural behaviour. While it remains apparent that the traditional social order is still intact, and other social cleavages have become important, it is also clear that where an individual resides inhibits or facilitates cultural behaviour. Place clearly matters. Yet whilst one of the limitations of this analysis is the inability to take of other micro-spatial scales, particularly the importance of the household and the processes underpinning household behaviour on attendance and participation, these findings, for the first time in the cultural field in Scotland, show that geography is empirically vital to deliver a meaningful analysis of cultural behaviour. Its importance and influence both theoretically and empirically should therefore not be ignored.
of ways. However, previous evidence suggests that opportunity structures in the poorer areas are less conducive to consumption activities than more affluent areas (Macintyre et al 2003). Our model findings concur with this evidence. Deprivation is clearly an inhibitor to consumption; living in deprived areas will impact on cultural behaviour not simply because of the presence of more non-consumers, but because the environment in which an individual finds themselves provides fewer opportunities for developing cultural behaviour.
Examine if the variation in cultural behaviour is still accounted for at the local authority area level even when controlling for individual level compositional effects and area level characteristics
example, individuals clustered within households) so that the importance of geography on consumption patterns can be fully explained. Nonetheless, the existence of variation at the local authority level suggests that even at this large geographical scale, where you live is important. For policymakers, overcoming barriers to participation will be much more difficult in some areas than in others. However, to determine whether interactions at smaller scales are more important to overcome requires further but necessary research.
Explore the low-consumer typology group found in the two domains and examine what activities this group is more likely to be engaged in and their socio-economic/demographic profile
6.13 We found that there was a non-consumer typology group in both the attendance and participation fields. Combined, this non-active group represented 28% of all individuals surveyed. Although the groups in each field are of different sizes, they do have similar traits. Members of both have low educational attainment, are significantly more likely to be male, less likely to be from the younger cohort, and crucially they are significantly more likely to be individually deprived and reside in areas that are more deprived. While it is too simplistic to state that members of this group do not take part in any activity, it is clear that these lifestyle groups are slightly more likely to attend or participate in the more easily accessible activities (visiting libraries/reading for pleasure) that require less knowledge and economic and cultural capital. However, it is important to remember that we only based these lifestyles from the cultural indicators in the SHS Culture Module. It is possible that these groups may be active in other forms of culture not measured here, especially those activities that are based in the home.
Account for the different reasons why certain groups do or do not take part in or attend cultural events, and make any links between the two