INTRODUCTION
The Trauma and Injury Severity Score (TRISS) is an injury se-verity scoring system developed by combining a patient’s age,
Injury Severity Score (ISS), and Revised Trauma Score (RTS).1 Despite its known limitations,2-6 TRISS is used worldwide for benchmarking trauma outcomes.7-11 The TRISS coefficient, which is used to give the variable weights, derived from an ordi-nary logistic regression of the Major Trauma Outcome Study (MTOS) database created in the U.S. in 1987.12 In 1995, revi-sions were made by the American College of Surgeons Com-mittee on Trauma.3 Most of the recent studies involving Asian populations9-11 used the MTOS-derived coefficient revised in 1995. However, owing to a great deal of progress in the trauma care system, it has been steadily proposed that the coefficients be revised again. In fact, various studies are available on the topic.13-16 In particular, the TRISS coefficients 2009 revision study published in 201013 proposed a new set of coefficients upon an analysis of U.S. National Trauma Data Bank (NTDB) and
Na-The Applicability of Trauma and Injury Severity Score
for a Blunt Trauma Population in Korea and a Proposal
of New Models Using Score Predictors
Kyoungwon Jung
1, Yo Huh
1, John Cook-Jong Lee
1, Younghwan Kim
1, Jonghwan Moon
1,
Seok Hwa Youn
1, Jiyoung Kim
2, Juryang Kim
2, and Hyoju Kim
21Division of Trauma Surgery, Department of Surgery, Ajou University School of Medicine, Suwon; 2Ajou Regional Trauma Center, Ajou University Hospital, Suwon, Korea.
Purpose: The purpose of this study was to verify the utility of existing Trauma and Injury Severity Score (TRISS) coefficients and to propose a new prediction model with a new set of TRISS coefficients or predictors.
Materials and Methods: Of the blunt adult trauma patients who were admitted to our hospital in 2014, those eligible for Korea Trauma Data Bank entry were selected to collect the TRISS predictors. The study data were input into the TRISS formula to obtain “probability of survival” values, which were examined for consistency with actual patient survival status. For TRISS coefficients, Major Trauma Outcome Study-derived values revised in 1995 and National Trauma Data Bank-derived and National Sample Project-derived coefficients revised in 2009 were used. Additionally, using a logistic regression method, a new set of coefficients was derived from our medical center’s database. Areas under the receiver operating characteristic (ROC) curve (AUC) for each pre-diction ability were obtained, and a pairwise comparison of ROC curves was performed.
Results: In the statistical analysis, the AUCs (0.879–0.899) for predicting outcomes were lower than those of other countries. How-ever, by adjusting the TRISS score using a continuous variable rather than a code for age, we were able to achieve higher AUCs [0.913 (95% confidence interval, 0.899 to 0.926)].
Conclusion: These results support further studies that will allow a more accurate prediction of prognosis for trauma patients. Fur-thermore, Korean TRISS coefficients or a new prediction model suited for Korea needs to be developed using a sufficiently sized sample.
Key Words: Injury Severity Score, Korea, trauma, trauma centers
pISSN: 0513-5796 · eISSN: 1976-2437
Received: August 26, 2015 Revised: January 24, 2016 Accepted: January 25, 2016
Corresponding author: Dr. Kyoungwon Jung, Division of Trauma Surgery, De-partment of Surgery, Ajou University School of Medicine, 164 World cup-ro, Yeong-tong-gu, Suwon 16499, Korea.
Tel: 82-31-219-4452, Fax: 82-31-219-7765, E-mail: [email protected]
•The authors have no financial conflicts of interest.
© Copyright: Yonsei University College of Medicine 2016
This is an Open Access article distributed under the terms of the Creative Com-mons Attribution Non-Commercial License (http://creativecomCom-mons.org/licenses/ by-nc/3.0) which permits unrestricted non-commercial use, distribution, and repro-duction in any medium, provided the original work is properly cited.
tional Sample Project (NSP) large data sets. Recent European and Japanese studies8-11,17-19 have produced new coefficients or devised a new scoring system by modifying the TRISS predic-tors. However, such a discussion is non-existent in Korea, where the trauma care system is not as well established, and no such databases have been compiled.
The Korean government has been attempting to develop a plan to establish regional trauma care centers across the nation, which was set motion in 2012. In addition, the Korea Trauma Data Bank (KTDB) was established in 2013 by mandating reg-istration of trauma victims at the institutes participating in the project. However, various hurdles have hindered its progress, and no notable outcomes have been attained thus far. The current study aimed to verify the utility of the existing TRISS coefficients by using the data collected in 2014 and to improve the quality of data entered through the course of the study. Additionally, the study aimed to propose a new trauma mor-tality or survival prediction model with a new set of TRISS co-efficients or predictors composing TRISS, which would allow a more accurate prediction of prognosis for trauma patients.
MATERIALS AND METHODS
Hospital setting and patient data
The medical center where the authors are employed is a tertia-ry university hospital visited by approximately 17000 trauma patients annually, approximately 2000–3000 of whom receive in-patient treatment. Since being selected for the regional trau-ma center project in 2013 by the government, our medical cen-ter has been equipped with 20 intensive care unit beds, a two-bed resuscitation room for trauma cases (T-bay), and two op-eration rooms specialized for trauma victims. The level of the facility corresponds to that of a U.S. Level-I trauma center. The facility is run by 12 dedicated trauma faculty members, includ-ing four general surgeons, one thoracovascular surgeon, one emergency physician, one neurosurgeon, four orthopedic sur-geons, and one radiologist.
Of the trauma patients who were admitted to our medical center in 2014, those eligible for KTDB entry were selected, and TRISS predictors such as age, ISS, and RTS were collected. ISS was coded by three nurses (one trauma program manager and two trauma coordinators), whose work was confirmed by spe-cialists in the trauma care center. For RTS calculation, the ini-tial systolic blood pressure (SBP), respiratory rate (RR), and Glasgow Coma Scale (GCS) measured at emergency room ad-mission were used.
Study sample (inclusion and exclusion criteria)
KTDB inclusion criteria were as follows:
1) Disease status of “causes other than disease”.
2) Status of “hopeless discharge,” “discharge,” “transfer,” “ad-mission,” or “deceased”.
3) Diagnosis data at emergency room (ER) discharge, diag-nosis data codes of S or T at hospital discharge (with the exclu-sion of certain codes).
• Trauma registration exclusion codes:
- Superficial injury, blister: S00.01, S00.21, S00.31, S00.41, S00.51, S00.91, S10.11, S10.81, S10.91, S20.11, S20.31, S20.41, S20.81, S30.81, S30.91, S40.81, S50.81, S60.81, S70.81, S80.81, S90.91
- Insect bite (nonvenomous): S00.02, S00.22, S00.32, S00.42, S00.52, S00.82, S00.92, S10.12, S10.82, S10.92, S20.12, S20.32, S20.42, S20.82, S30.82, S30.92, S40.82, S50.82, S60.82, S70.82, S80.82, S90.82
-Foreign body: T15–T19 -Poisoning: T36–T65
- Superficial injuries involving multiple body regions, injury of unspecified body region: T00.8, T14.0
Although the trauma victims who died in the emergency department despite resuscitation efforts were included, those who had an ISS that could not be measured were excluded. Ul-timately, only the blunt trauma patients 15 years of age and older were included in the study.
The TRISS model
TRISS coefficients, which are used to give the variable weights, were originally estimated from ordinary logistic regression models in 198712 and then revised in 19953 using the MTOS database coordinated by the American College of Surgeons Committee on Trauma. In the TRISS model, if the patient is 15 years of age and older, different coefficients are used accord-ing to the type of injury mechanism (blunt or penetrataccord-ing). The current study involved only trauma patients 15 years and older. TRISS determines the probability of survival (PS) of a patient using the following formula:
PS=1/(1+e-b)
b=α+βage×age+βRTS×RTS+βISS×ISS
Here, α is an injury mechanism type (blunt or penetrating) coefficient, βage is an age coefficient, βRTS is an RTS coefficient, and βISS is an ISS coefficient. RTS is calculated using the fol-lowing formula, where βRR is an RR coefficient, βSBP is an SBP coefficient, and βGCS is a GCS coefficient.
RTS=βRR×RR+βSBP×SBP+βGCS×GCS
Ultimately, the above formulas can be reorganized into the following formula:
b=α+βage×age+βRR×RR+βSBP×SBP+βGCS×GCS+βISS×ISS
The TRISS coefficient and statistical analyses
with actual patient survival status. For TRISS coefficients, MTOS-derived values revised in 19951,12 and NTDB-derived coeffi-cients and NSP-derived coefficoeffi-cients revised in 200913 were used. Particularly in the study on the TRISS coefficients revi-sion that was performed in 2009, analyses were conducted on the complete and imputed values. Here, “complete” cases were those patients with valid non-missing data for all covariates, and “imputed” data were those covariates with invalid or miss-ing data converted usmiss-ing a statistical method.13 Areas under the receiver operating characteristic (ROC) curve (AUC) for each prediction ability were obtained, and a pairwise comparison of ROC curves was performed using the Hanley and McNeil method. Additionally, using a logistic regression method, a new set of coefficients were derived from our medical center’s da-tabase (Ajou Trauma Data Bank, ATDB), and several of the TRISS predictor variables were modified in an aim to identify a model superior to the existing TRISS model. Subsequently, AUCs were obtained and compared with the existing data. We set out to modify several of the TRISS predictor variables to identify a model with superior predictive or explanatory pow-er. We evaluated the quality of the model using the power of explanation of the model (-2 log likelihood, Nagelkerke R2) and its calibration (Hosmer-Lemeshow test) and discriminative power (for the AUC).
We used SPSS version 22 (IBM Corp., Armonk, NY, USA) and MedCalc version 15.6.1 for Windows (MedCalc Software bvba, Broekstraat, Mariakerke, Belgium) for statistical analyses. Sig-nificance of statistical differences was attributed to p values< 0.05.
Ethics statement
This study was approved by the Institutional Review Board of Ajou University Hospital (IRB No. AJIRB-MED-MDB-15-195). Informed consent was waived by the board due to the obser-vational nature of the study.
RESULTS
Of the trauma patients treated at our medical center in 2014, a total of 2307 trauma patients met the eligibility requirements for KTDB data entry. A total of 2022 patients (87.6%) were 15 years or older, 1841 (91.0%) of whom were blunt trauma pa-tients. TRISS scores of 1791 patients were obtained, upon ex-clusion of 50 death on arrival (DOA) patients. Forty-five pa-tients (2.5%) were further excluded owing to missing data among TRISS predictor variables, which resulted in a total of 1746 patients enrolled in the study (Fig. 1). Table 1 displays the participants’ basic demographic data and TRISS predictor variables.
[image:3.595.300.540.329.714.2]Male participants accounted for 64.9% (1133 patients) of the total, patients 55 years and younger accounted for 58.2% (1016 participants), and close to half of all participants (794 partici-pants, 45.5%) were patients transferred from another hospital
Fig. 1. A diagram of the patients’ enrollment. KTDB, Korea Trauma Data Bank.
Inclusion
Exclusion
A total of cases for KTDB data entry 2307
Injury mechanism, penetrating 181
Age, <15 years old 285
Deaths on arrival 50
Missing data 40
Age, ≥15 years old 2022
Injury mechanism, blunt 1841
Cases admitted in our department 1791
[image:3.595.42.283.522.709.2]A total of cases enrolled in the study 1746
Table 1. Demographic Characteristics and the Trauma and Injury Sever-ity Score Predictor Variables for Blunt Adult Trauma Patients (≥15 yrs) from the Ajou Trauma Data Bank (Total Number of Patients=1746)
Number of patients (%) Sex
Male 1133 (64.9)
Female 613 (35.1)
Age (yrs)
<55 1016 (58.5)
≥55 730 (41.8)
Transfer from
Other hospital 794 (45.5)
Incident location directly 952 (54.5) RR (breaths/min)
>29 26 (1.5)
10–29 1720 (98.5)
SBP (mm Hg)
1–49 1 (0.1)
50–75 27 (1.5)
76–89 33 (1.9)
>89 1685 (96.5)
GCS
3 32 (1.8)
4–5 20 (1.1)
6–8 47 (2.7)
9–12 60 (3.4)
13–15 1587 (90.9)
ISS
Median (Q1, Q3) 9 (4, 14)
>15 435 (24.9)
Discharge status
Alive 1660 (95.1)
Dead 86 (4.9)
to our trauma center. In the case of RR, no patient was found with an RR of 0–9, which corresponded to a coded value of 0, 1, or 2. In the case of SBP also, only one patient with an SBP of 0–49 mm Hg was found. On the other hand, age, GCS, and ISS exhibited a relatively even distribution. The median ISS value was 9 points, and the number of patients with ISS >15 was 435 (24.9%). A total of 86 patients died, yielding a crude mortality rate of 4.9% (86 of 1746) in the study (Table 1).
Table 2 displays the coefficients calculated for the TRISS predictor variables obtained from the existing database, as well as the coefficients estimated via a logistic regression performed with our medical center’s data. Fig. 2 displays the ROC curves created to examine the utility of the TRISS value (PS) obtained by plugging in the coefficients. Table 3 displays the calculated AUC values. The values indicate that ATDB (0.899)>MTOS (0.888)>NTDB-imputed (0.885)>NTDB-complete (0.880)> NSP-imputed (0.879)>NSP-complete (0.878), with associated 95% confidence intervals (CI) showing a tendency to overlap
[image:4.595.55.554.86.175.2]with one another. However, pairwise comparison of ROC cur-ves indicated that ATDB had a significantly higher value than those of the others (Table 4).
Table 2. Estimated Coefficients of the Trauma and Injury Severity Score Predictor Variables from Each Database
Database Intercept RR SBP GCS ISS Age
MTOS -0.4499 0.2351 0.5923 0.7574 -0.0835 -1.7430
NTDB-complete 1.1323 -0.0657 0.5649 0.7485 -0.0760 -1.8465
NTDB-imputed 1.6494 0.0095 0.4260 0.6307 -0.0795 -1.6216
NSP-complete 1.4983 -0.0852 0.3918 0.7562 -0.0745 -1.8157
NSP-imputed 2.0281 -0.0691 0.2470 0.6965 -0.0748 -1.6924
ATDB -0.4263 0.2130 0.5366 0.5023 -0.0834 -0.9776
[image:4.595.55.296.210.443.2]RR, respiratory rate; SBP, systolic blood pressure; GCS, Glasgow Coma Scale; ISS, Injury Severity Score; MTOS, Major Trauma Outcome Study; NTDB, National Trauma Data Bank; NSP, National Sample Project; ATDB, Ajou Trauma Data Bank.
Table 3. AUCs and Associated 95% CIs from Unweighted Logistic Regres-sion Models for the Trauma and Injury Severity Score (TRISS) Model Revised in 1995 (MTOS), the TRISS Model Revised in 2010 (NTDB, NSP), and the TRISS Model Revised in 2015 by the Authors (ATDB)
Model coefficients AUC SE* 95% CI†
MTOS 0.888 0.0195 0.872 to 0.902
NTDB-complete 0.880 0.0203 0.864 to 0.895 NTDB-imputed 0.885 0.0196 0.870 to 0.900 NSP-complete 0.878 0.0205 0.862 to 0.893 NSP-imputed 0.879 0.0205 0.863 to 0.894
ATDB 0.899 0.0183 0.884 to 0.913
AUC, area under the receiver operator characteristic curve; SE, standard er-ror; CI, confidence interval; MTOS, Major Trauma Outcome Study; NTDB, Na-tional Trauma Data Bank; NSP, NaNa-tional Sample Project; ATDB, Ajou Trauma Data Bank.
[image:4.595.315.552.254.343.2]*Hanley and McNeil, †Binomial exact.
Table 4. Pairwise Comparison of Receiver Operator Characteristic Curves of Model Coefficients
Model coefficients
Difference
between areas 95% CI p value
MTOS vs. NTDBc 0.0077 0.0017 to 0.0137 <0.001* MTOS vs. NTDBi 0.0025 -0.0017 to 0.0068 0.149 MTOS vs. NSPc 0.0097 0.0016 to 0.0178 <0.001* MTOS vs. NSPi 0.0092 0.0004 to 0.0179 0.001* MTOS vs. ATDB 0.0111 -0.0020 to 0.0241 0.027* NTDBc vs. NTDBi 0.0052 0.0005 to 0.0098 0.014* NTDBc vs. NSPc 0.0020 -0.0010 to 0.0051 0.074 NTDBc vs. NSPi 0.0015 -0.0028 to 0.0058 0.440 NTDBc vs. ATDB 0.0187 0.0013 to 0.0361 0.004* NTDBi vs. NSPc 0.0072 0.0019 to 0.0125 0.002* NTDBi vs. NSPi 0.0066 0.0011 to 0.0121 0.003* NTDBi vs. ATDB 0.0136 -0.0006 to 0.0278 0.015* NSPc vs. NSPi 0.0005 -0.0010 to 0.0021 0.659 NSPc vs. ATDB 0.0207 0.0023 to 0.0392 0.002* NSPi vs. ATDB 0.0202 0.0017 to 0.0387 0.003* CI, confidence interval; MTOS, Major Trauma Outcome Study; NTDBc, Nation-al Trauma Data Bank-complete; NTDBi, NTDB-imputed; NSPc, NationNation-al Sam-ple Project-comSam-plete; NSPi, NSP-imputed; ATDB, Ajou Trauma Data Bank. *Statistically significant.
Fig. 2. Receiver operating characteristic curves for the TRISS models from each database. TRISS, Trauma and Injury Severity Score; MTOS, Major Trauma Outcome Study; NTDBc, National Trauma Data Bank-complete; NTDBi, NTDB-imputed; NSPc, National Sample Project-complete; NSPi, NSP-imputed; ATDB, Ajou Trauma Data Bank.
100
80
60
40
20
0
0 20 40 60 80 100 MTOS NTDBc NTDBi NSPc NSPi ATDB
100-specificity (%)
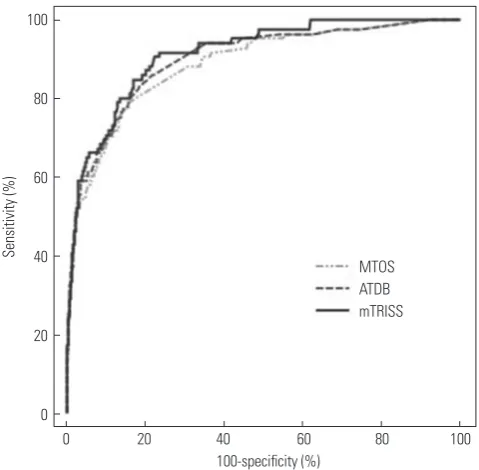
[image:4.595.315.554.431.648.2]When certain TRISS predictor variables were modified (mTRISS) in an aim to identify a model superior to the exist-ing TRISS model, we discovered that convertexist-ing “coded age” into “continuous age” alone (b=α+βage×continuous value of age+
βRR×RR+βSBP×SBP+βGCS×GCS+βISS×ISS) produced a model with a higher AUC value (0.913) and greater explanatory power (-2 log likelihood=437.652 vs. 455.739, R2=0.408 vs. 0.380, respec-tively) than the existing TRISS model. In other words, the new model developed in the current study (mTRISS) had an ex-planatory power of 40.8%, which was greater than what was derived from regression of the existing TRISS model’s predic-tor variable (38.0%). In addition, the model’s calibration and fit were verified using the Hosmer-Lemeshow test results (χ2= 7.487, p value=0.510) (Table 5). Although pairwise compari-son of the ROC curves (mTRISS vs. ATDB derived model) did not indicate statistically significant differences (p value= 0.064), a comparison with the MTOS-derived model, which had previously shown the most favorable results among the existing models, indicated a superior discriminative power (p value=0.003) (Table 6, Fig. 3).
DISCUSSION
Although numerous injury severity scoring systems have been introduced historically, TRISS, which is developed by consid-ering both the anatomical variables and physiologic factors, is currently accepted as the most effective method for bench-marking trauma outcomes.7-11 Nevertheless, many Korean cir-cumstances differ from those of the U.S., where the scoring system was developed. In particular, given that significant dif-ferences are found in the level of treatment provided to trau-ma patients, indiscriminately applying the trautrau-ma survival pre-diction model of another country when treating patients in
Korea is bound to result in difficulties. In other words, verifica-tion based on a Korean trauma populaverifica-tion is needed sooner rather than later. Thus, developing a new set of TRISS coeffi-cients or a new prediction model will be highly beneficial.
The current study applied the existing TRISS coefficients to the adult blunt trauma population of a single trauma center in Korea. The results found AUC values of 0.878–0.888, which was lower than those of existing foreign studies (AUC: 0.896– 0.928),13,14 indicating lower utility. However, for a more accurate comparison, further research involving a sample size compa-rable to that of the databases used in the foreign studies is need-ed. Nevertheless, the fact that a new coefficient closely approxi-mating 0.9 was obtained in the current study is encouraging (AUC=0.899, 95% CI=0.884–0.913), considering that the value is significantly higher than those of other models and that the study sample only consisted of a single trauma care center’s small scale database (ATDB) (Table 2).
[image:5.595.45.541.91.141.2]The Ministry of Health and Welfare established the KTDB in 2013, which has been collecting data from select regional trau-ma centers ever since. However, owing to the lack of a clear “data dictionary,” the quality of registered data is questionable. Furthermore, despite the designation of a trauma care center in each region, a trauma patient transport system has not yet Table 5. AUC, Power of Explanation, and Calibrations of Models
Regression models AUC 95% CI -2 log likelihood Nagelkerke R2 Hosmer-Lemeshow test
χ2 p value
cAGE, RTS, ISS 0.899 0.884 to 0.913 455.739 0.380 9.750 0.283
yAGE, RTS, ISS 0.913 0.899 to 0.926 437.652 0.408 7.249 0.510
[image:5.595.300.540.170.405.2]AUC, area under the receiver operator characteristic curves; CI, confidence interval; cAGE, coded value of age; yAGE, age year; RTS, Revised Trauma Score; ISS, Injury Severity Score.
Table 6. Pairwise Comparison of Receiver Operator Characteristic Curves of Modified Trauma Injury and Severity Score, ATDB, and MTOS-De-rived Models
Model coefficients
Difference
between areas 95% CI p value
mTRISS* vs. ATDB 0.0140 -0.0008 to 0.0287 0.064 mTRISS* vs. MTOS 0.0250 0.0086 to 0.0415 0.003 CI, confidence interval; MTOS, Major Trauma Outcome Study; ATDB, Ajou Trauma Data Bank.
*The new Trauma Injury and Severity Score model determined by modifying the “coded age” value to a “continuous age” variable from the ATDB.
Fig. 3. Receiver operating characteristic curves for MTOS, ATDB, and modi-fied TRISSs. MTOS, Major Trauma Outcome Study; ATDB, Ajou Trauma Data Bank; mTRISS, modified Trauma and Injury Severity Score.
100
80
60
40
20
0
0 20 40 60 80 100 MTOS
ATDB mTRISS
100-specificity (%)
[image:5.595.44.280.207.258.2]been firmly established, resulting in many patients being shuf-fled from one hospital to another until they are finally admitted. Moreover, the lack of clear definitions pertaining to parame-ters such as initial vital signs and GCS has added to the confu-sion commonly experienced in these circumstances. SBP, RR, and GCS, which were used in the study to calculate TRISS, are the initial measurements taken at our medical center. Howev-er, considering that 45.5% of patients are transferred from an-other hospital (Table 1), it is an assumption to consider these measurements as the initial values fitting the definition of TRISS. Certain patients may have been admitted after an intu-bation performed at a previous hospital, while others may have been on sedatives administered at a previous hospital, which interferes with accurate measurement of initial RR and initial GCS. There is also the possibility that fluid, blood transfusion, or inotropes used during a previous resuscitation effort at an-other hospital may have elevated the initial SBP. It should be noted that there were no initial RR values below 9 and only one case of initial SBP below 50 in the study. It is thought that these factors negatively affected the predictive power and ex-planatory power of the model, resulting in a lower AUC value than those of the existing foreign studies. All cases, regardless of transfer, were included in this study, as the enrolled popu-lation would have been too small to draw significant results statistically if the cases transferred from other hospitals had been excluded. A follow-up large-scale study is needed to fur-ther examine these issues. Additionally, a clear and specific “data dictionary” is imperative at this point.
Regarding the comparison of outcomes by regional trauma care centers for benchmarking, the MTOS-derived coefficient revised in 1995 and the NTDB-imputed data coefficient revised in 2010 are thought to be suitable for the current circumstanc-es in Korea (Table 2, 3, and 4). However, we would like to rec-ommend use of the MTOS coefficient in particular. No statis-tically significant difference was found when the ROC curves of the two coefficients were compared (0.888 vs. 0.885, p val-ue=0.149, respectively) (Table 3 and 4). However, it should also be considered that most of the recent TRISS studies8,9,11 used the MTOS coefficients and that coordinators of the trauma centers in Korea mostly estimate the TRISS while using the TRISS calculation program at TRAUMA.ORG (a trauma infor-mation website run by a British trauma surgeon; calculations use MTOS-derived coefficients).20
Further multi-institutional large-scale studies are needed in order to develop a new set of TRISS model coefficients or a so-called Korean trauma outcome prediction model. The model developed in the current study capitalized on such an asser-tion (Table 5). We modified several of the existing TRISS pre-dictor variables in an aim to identify the most robust model via regression analysis. Although a more in-depth analysis could not be performed due to the insufficient sample size, we were able develop a model with a higher AUC value (0.888 vs. 0.913, respectively, p value=0.003) than the existing TRISS model
(MTOS-derived) simply by converting the “coded age” into a continuous value (Table 6, Fig. 3). This conversion was per-formed as our previous research on risk factors for trauma mor-tality showed that a continuous value of age could be a better predictor for trauma outcome while other converted values re-garding SBP, RR, or GCS could not.21 The model shows a greater explanatory power (R2 of 0.408=40.8% vs. 38.0%, respectively) than the existing TRISS combination (coded age value, RTS, ISS), and the Hosmer-Lemeshow test results (χ2=7.487, p value= 0.485) verified a good fit and calibration of the model (Table 5). If such an encouraging result could be obtained with a single trauma care center’s small-scale data, a more robust model may be identifiable through a study using multi-institutional data, such as the KTDB.
The current study had several limitations. Owing to the na-ture of TRISS, which is calculated by combining various predic-tor variables, a greater accumulation of data tends to result in a model with greater utility. However, the current study involv-ed a small sample accumulatinvolv-ed over a relatively short period of time, compared with other studies. Additionally, given that our medical center is a tertiary care center, the sample in the study may not have represented Korea’s overall trauma pa-tient population. Such a limitation has been frequently men-tioned in other foreign TRISS studies as well.11,13-15,17 Further-more, selection bias may have been a factor in cases where va-riables were not clearly defined. Nevertheless, although existing large-scale studies12-14 showed a large level of missing data (over 10%), the amount of missing data in the current study was rela-tively less at 5.2% (95 of 1841). In fact, the current study’s sam-ple, which was extracted from a single medical center, was tr-eated by the same medical staff following the same protocol, and the fact that data entry also followed the same set of guide-lines may have contributed to the increased homogeneity of the data, despite the small sample size. In order to address all of these limitations, randomized multi-institutional studies are needed. However, under the current Korean circumstances where the trauma database has only started to be established, much more time and effort will need to be invested first.
REFERENCES
1. Boyd CR, Tolson MA, Copes WS. Evaluating trauma care: the TRISS method. Trauma Score and the Injury Severity Score. J Trauma 1987;27:370-8.
2. Cayten CG, Stahl WM, Murphy JG, Agarwal N, Byrne DW. Limita-tions of the TRISS method for interhospital comparisons: a multi-hospital study. J Trauma 1991;31:471-81.
3. Champion HR, Sacco WJ, Copes WS. Injury severity scoring again. J Trauma 1995;38:94-5.
4. Hannan EL, Mendeloff J, Farrell LS, Cayten CG, Murphy JG. Valida-tion of TRISS and ASCOT using a non-MTOS trauma registry. J Trauma 1995;38:83-8.
5. Gabbe BJ, Cameron PA, Wolfe R. TRISS: does it get better than this? Acad Emerg Med 2004;11:181-6.
6. Demetriades D, Chan L, Velmanos GV, Sava J, Preston C, Gruzinski G, et al. TRISS methodology: an inappropriate tool for comparing outcomes between trauma centers. J Am Coll Surg 2001;193:250-4. 7. Glance LG, Osler T. Beyond the major trauma outcome study:
benchmarking performance using a national contemporary, pop-ulation-based trauma registry. J Trauma 2001;51:725-7.
8. Nakahara S, Ichikawa M, Kimura A. Simplified alternative to the TRISS method for resource-constrained settings. World J Surg 2011;35:512-9.
9. Deshmukh VU, Ketkar MN, Bharucha EK. Analysis of Trauma Out-come Using the TRISS Method at a Tertiary Care Centre in Pune. Indian J Surg 2012;74:440-4.
10. Chan CK, Yau KK, Cheung MT. Trauma survival prediction in Asian population: a modification of TRISS to improve accuracy. Emerg Med J 2014;31:126-33.
11. Kimura A, Chadbunchachai W, Nakahara S. Modification of the Trauma and Injury Severity Score (TRISS) method provides better survival prediction in Asian blunt trauma victims. World J Surg
2012;36:813-8.
12. Champion HR, Copes WS, Sacco WJ, Lawnick MM, Keast SL, Bain LW Jr, et al. The Major Trauma Outcome Study: establishing na-tional norms for trauma care. J Trauma 1990;30:1356-65.
13. Schluter PJ, Nathens A, Neal ML, Goble S, Cameron CM, Davey TM, et al. Trauma and Injury Severity Score (TRISS) coefficients 2009 revision. J Trauma 2010;68:761-70.
14. Schluter PJ. Trauma and Injury Severity Score (TRISS): is it time for variable re-categorisations and re-characterisations? Injury 2011;42:83-9.
15. Schluter PJ. The Trauma and Injury Severity Score (TRISS) revised. Injury 2011;42:90-6.
16. Rogers FB, Osler T, Krasne M, Rogers A, Bradburn EH, Lee JC, et al. Has TRISS become an anachronism? A comparison of mortality between the National Trauma Data Bank and Major Trauma Out-come Study databases. J Trauma Acute Care Surg 2012;73:326-31. 17. Gunning AC, Leenen LP. Applicability of the predictors of the his-torical trauma score in the present Dutch trauma population: mod-elling the TRISS predictors. J Trauma Acute Care Surg 2014;77: 614-9.
18. Wong GK, Teoh J, Yeung J, Chan E, Siu E, Woo P, et al. Outcomes of traumatic brain injury in Hong Kong: validation with the TRISS, CRASH, and IMPACT models. J Clin Neurosci 2013;20:1693-6. 19. Brockamp T, Maegele M, Gaarder C, Goslings JC, Cohen MJ,
Lefer-ing R, et al. Comparison of the predictive performance of the BIG, TRISS, and PS09 score in an adult trauma population derived from multiple international trauma registries. Crit Care 2013;17:R134. 20. TRAUMA.ORG. [accessed on 2016 January 1]. Available at: http://
www.trauma.org/index.php/main/article/387/.