5
X
October 2017
Analysis of Consumer Behavior on SCM Related
Factors Using Data Mining: A Case Study of the
Indian E-Commerce Industry
Manpreet Singh1, Lalit Jyani2, Rachna Verma3, Lalit Rajpurohit4, Pradeep Goswami5 1,4
Department of Production and Industrial Engineering, MBM Engineering College Jodhpur, 342001, Rajasthan, India 3
Department of Computer Science and Engineering, MBM Engineering College Jodhpur, 342001, Rajasthan, India 2,5
Department of Mechanical Engineering, MBM Engineering College Jodhpur, 342001, Rajasthan, India
Abstract: The electronic commerce (e-commerce) supply chain management (SCM) or ECSCM is a new and rapidly developing area of study in India and abroad. At the same time there are several challenges faced by e-commerce. These challenges lead to customers refraining from its use due to poor experiences while shopping online. According to industry experts, these issues are mostly pertaining to inefficient SCM. To confirm it, three hypotheses are proposed on discussions with the industry experts. First hypothesis states negative correlation of problems faced with overall customer satisfaction. Second states negative correlation of problems faced with the factors re-establishing trust. Third hypothesis states positive correlation of factor re-establishing trust with the overall satisfaction. A survey has been launched fetching replies from 401 Indian e-commerce consumers. The responses are processed by a statistical tool named Smart PLS 3.0 and the proposed hypothesis are checked by creating a suitable model. The results confirmed the three proposed hypothesis. The survey provides a clear understanding of demands, problems faced and solutions proposed by consumers themselves. The knowledge generated through this work could prove to be a win-win situation for both consumers and e-commerce companies. The consumers could be benefited by enhanced shopping experience according to their preferences. The e-commerce companies will be benefitted with better consumer loyalty which ultimately leads to increased profits.
Keywords: E-commerce, supply chain management, data mining, consumer behavior.
I. INTRODUCTION
Today all businesses are making their mark on internet to reach maximum number of customers, expanding business and generating larger revenues. But, with growth comes several challenges and issues. These obstacles if not handled properly, make the respective company loose customer loyalty and hence business. But, if these obstacles are well addressed, not only the business prospects and customer loyalty are maintained but it further attracts a larger number of new customers as well. These obstacles could be easily known by taking feedback from the customers. Considering the Indian e-commerce industry in this case, and after analyzing various research papers, the attention is focused on the supply chain management (SCM) related issues pertaining in this industry. Electronic commerce supply chain management (ECSCM) is a new and rapidly developing area of study in India and abroad given the exponential growth of e-commerce in every sector of the market. In conventional and e-business, its effective implementation could build trust for consumers or ineffective implementation could break that trust. Every company takes appropriate measures to curb out the elements of distrust.
Direct implementation inculcates various costs and risks involved for its success or failure, there the best options seems taking customer reviews for a lot and extrapolating the results. For this, a survey has to be launched asking questions to the customers which depict their view points. The obtained data cannot be processed through manual methods as it is large data, therefore data mining techniques are used for processing, translating, analysis and drawing useful inferences out of it.
A. Research objectives
The main objective of this study is to validate the conformance / non-conformance of the hypothesis which are stated as follows:- 1) Hypothesis 1: The problems faced by e-commerce customers tend to create a sense of distrust i.e. negatively affects overall
satisfaction.
3) Hypothesis 3: The factors that re-establish trust tends to increase overall satisfaction i.e. factors that re-establish trust are positively co-related to overall satisfaction.
B. Organization of paper
The next section discusses a detailed study of the existing literature, which is followed by research methodology used in this work. After this, analysis and interpretation of data collected through survey is performed with the help of statistical software Smart PLS 3.0. Finally, the conclusions of this work are presented.
II. LITERATURE REVIEW
A. E-commerce and Supply Chain Management
E-commerce has also been an important part to support and reinforce the above mentioned efforts of supply chain by helping in lowering / diminishing transaction costs and improving information sharing amongst the partners [Johnson and Whang, 2002].According per Welch [2008] despite several achievements, failures are also a reality which were/ are perhaps the result of complexities existing at the interface of these two fields (i.e. SCM and E-commerce).Patil and Brig. Divekar [2014] state the role of SCM and inventory management in e-commerce in various ways. They state that risk, loss of customers, low customer satisfaction and other challenges associated with e-commerce like reverse logistics, demand variations, seasonal fluctuations etc are all related to SCM.
B. E-commerce in India
Kabir and Hasin [2010]discussed that the shift of conventional commercial activities to e-commerce in the recent times and further shifting and inclination of the markets towards mobile commerce or m-commerce. This study evaluates success factors and its effects and gives an evaluation model to determine drawbacks & opportunities. They designed and conducted a customer survey where trust was one of the several factors considered.Reddy and Brig. Divekar [2014] discuss how efficient delivery, careful shipment and COD are vital for e-commerce and also the challenges that they are facing the most these days. They discuss how important it is for even a world e-commerce giant like Amazon.com to understand customer expectations and cater to it before expecting profits in the market. This clearly shows how important it is for any organization, big or small, to pay heed to customer requirements and anticipate their behavior using available techniques in order to hold its grounds in this era of online competition.
C. E-commerce and trust
According to Greatorex and Mitchell [1994] the perceived risks (distrust) are related to perception and psychology of the buyer. Mark et al. [1987] defined perceived risk (distrust) as a conceived risk, comprising individual’s knowledge and values. Therefore, any e-commerce company should first evaluate and predict buyer’s behavior [Layton 2005] i.e. what psychology affects the customers to go with or not to go decisions and then they should set proposals and develop strategies accordingly.Every company is working really hard for it and the key for an e-com company to achieve long term success against competitors and thereby to gain competitive advantage is to build consumer trust [Kenney 1999, Suh and Han 2003, Pabion and Fygensen 2006]. Jiang et al. [2008] mention several surveys showing that now it’s a customer’s psychology to shop with the sites they trust.Angelika et al. [2014] discuss how the perceived risk (or distrust) negatively affects e-business.The authors discuss the strategies to reduce risk and increase trust in online shopping by various methods. Jones and Leonard [2008] state that lack of trust is one of the most common reasons why people hesitate to use commerce. The information shared by customers through word of mouth advertizing on e-commerce websites can facilitate customers trust and believe in those establishments [Bock et al., 2012].
D. Data mining and e-commerce
Building a system to take advantage of the mined knowledge can be a substantial undertaking.
III. RESEARCH METHODOLOGY
In this section, the research methodology for this paper is presented. Under this will be mentioned about how to proceed towards our aim of hypothesis checking and knowledge generation.
A. Introduction
Consumer behaviour is the study of individuals, groups, or organizations and the processes they use to select, secure, use, and dispose of products, services, experiences, or ideas to satisfy their needs and wants. It is also concerned with the social and economic impacts that purchasing and consumption behaviour has on both the consumer and wider society [Kuester and Sabine, 2012].
The study of consumer behaviour is concerned with all aspects of purchasing and consumption behavior as well as all persons involved in purchasing decisions and consumption activities. Research has shown that consumer behaviour is difficult to predict, even for experts in the field [Armstrong, 1991].
B. Sampling plan
Sampling is a process of obtaining the information about the entire population by examining a part of it. The effectiveness of a research depends on the sample size selected for the survey.
1) Sample site: It is the place where the research is conducted. In this study, the survey was conducted for the e-commerce consumers in the states of Rajasthan, New Delhi, Punjab, Madhya Pradesh and Gujrat.
2) Sampling unit: The sampling unit describes ‘who is to be surveyed?’ in the study, here the sampling unit are the e-commerce consumers.
3) Sample size: For the purpose of a proper survey, there needs to be a proper calculation of the number or respondents to be considered to get as accurate as possible results. In this study the sample size is taken to be 401 respondents. The figure of 401 respondents is concluded based on calculations of the following statistical formula.
C. Calculations for the sample size
Many researchers have worked on the sample size of respondents and arrived at a generalized formula for the computation of the sample size for the survey data. For a 95% confidence level and maximum variability with 0.05 level of precision, the sample size is calculated from the following formula [Cochran, W.G. 1963], using the suggested
value:-Based on above data we get the sample size n=385(approx.) Therefore, we will have a minimum of the sample size n=385 (minimum). Though in this study, the sample size is taken to be 401, in order to be certain to have as accurate results as possible. Concluding this chapter of research methodology, we now move on to the next chapter to discuss the data collection in the coming chapter.
IV. DATA COLLECTION AND CODING
A. Introduction
The next step after knowing the sample size is determination of the questions to be asked to the respondents. It is very essential to carefully select these questions because only correct questions will lead to correct data and ultimately correct knowledge generation. Therefore, for devising the questionnaire, experts from different spheres were contacted and their replies were recorded regarding the topic. The experts considered were from the following backgrounds:-
N= p*q (z/e)2
where: N=sample size
p=0.5(maximum variability) q=0.5(1-p)
z=1.96[the z(95%) score associated with the degree of confidence]
1) Academics
2) Handicraft business 3) E-commerce company 4) Website development 5) SCM expert
And after considering their replies, a general questionnaire was formed. The pilot study of this questionnaire was conducted on the same panel of experts who contributed to the formulation of this survey and their responses were recorded. Henceforth the survey was launched to the general respondents via online links and hard copy forms.
B. Questionnaire administration
The survey was launched to the respondents via online and by-hand medium, around 150 results were obtained through online and around 250 responses were obtained through survey being filed by hand. After getting 401 responses the survey was stopped and responses were saved for further actions.
C. Data conversion and coding
Since the above generated data is in the mixed form of text and numerals, it is not possible for the statistical softwares like IBM SPSS and SmartPLS to process it and derive any inferences out of it. Therefore we were required to convert this data in numeric form. For this we considered the survey results and based on the ranks obtained by each variable their coding was done. The one having the highest rank was allotted the highest number out of the given variables. In this way the individual question responses were converted to numeric form. For the identification of a response from the entire survey, the previously obtained codes were added as decimals after the respective question numbers. Please consider the following example for further clarification:-
The results obtained for question number 11 i.e. the proposed solutions selected by customers that would re-establish their trust in online shopping is as per the figure 1.
Figure 1: Factors that re-establish trust (chart obtained through Google forms)
From figure 1, we write down the variable in form ranks obtained as follows:-
Table 1: Rank ad code for question 11 responses
S.No. Variable Name Percentage inclination Rank Numeric code
1 Website guarantee 32.8 % 2 5
2 Full money refund 44% 1 6
3 Govt Regl. Auth. 6.8% 4 3
4 Third Party Cert. 2.4% 6 1
5 Bank Guarantee 5.4% 5 2
6 Service facility 7.1% 3 4
Table 2: Data coding scheme
Sr. No. Question Variables Numeric code
1 Gender Female 1
Male 2
2 Age
18-25yrs 4
26-30yrs 3
<18yrs 2
>30yrs 2
3 Region
Rajasthan 5
New Delhi 4
Gujrat 3
Punjab 2
Madhya Pradesh 1
4 Profession
Student 5
Private Co. Employee 4
Self Employed 3
Govt. Employee 2
Unemployed 1
5 Spending capacity
<Rs.1000/- 4
Rs. 1000-3000/- 3
Rs. 3001-5000/- 2
> Rs. 5000 1
6 What you mostly shop for
Clothes / Accessories 4
Electronics 3
Literature 2
Consumable goods 1
7 Preferred website
Amazon 6
Flipkart 5
Myntra 4
Snapdeal 3
Paytm 2
Jabong 1
8 Good points of preferred website.
Best competitive market rates 5
Authentic product 4
On time delivery 3
Latest range of products 2
Convenient exchange policy 1
9 Disliked websites
Snapdeal 6
Jabong 5
Paytm 4
Myntra 3
Flipkart 2
Amazon 1
10 Reason for dislike
Poor quality product 4
Delayed delivery 3
Faulty product sent 2
Lack of convenience exchange policy 1
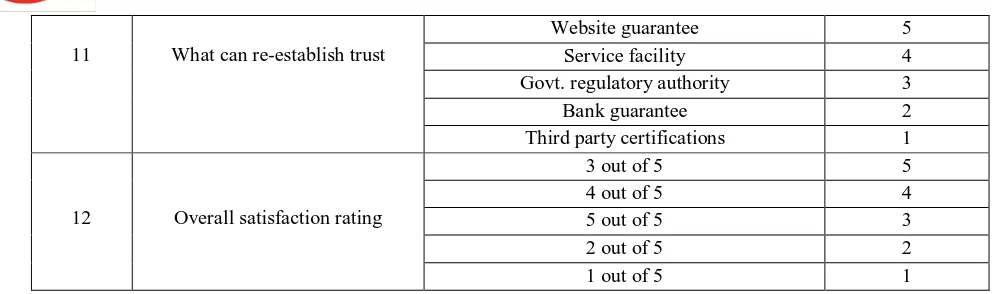
11 What can re-establish trust
Website guarantee 5
Service facility 4
Govt. regulatory authority 3
Bank guarantee 2
Third party certifications 1
12 Overall satisfaction rating
3 out of 5 5
4 out of 5 4
5 out of 5 3
2 out of 5 2
1 out of 5 1
[image:7.612.51.548.69.216.2]Note: For the ease of conversion and calculation, the responses marked as ‘others’ are considered as 0.Hence, after conversion all the data it is changed to the numerical form, an example of 10 readings is shown below where Q1-Q12 are questions 1-12 and numerals are the responses as marked by respondents.
Table 3: Final coded data
Q1 Q2 Q3 Q4 Q5 Q6 Q7 Q8 Q9 Q10 Q11 Q12
2 3 5 1 4 4 5 4 6 4 5 4
2 4 2 5 1 4 6 5 5 4 5 4
2 3 5 4 1 2 5 4 5 4 4 4
2 3 5 4 3 4 5 2 5 1 5 5
2 2 5 2 2 4 5 4 6 4 5 4
2 4 5 5 4 4 4 5 6 4 5 2
2 4 5 4 3 3 6 5 4 3 3 3
2 4 2 2 3 3 5 5 0 1 4 4
2 3 5 4 2 4 6 3 2 4 0 2
V. TOOLS USED
The selection of tools is a very important task in performing analysis on the collected data as this may prove to be the reason of a successful or unsuccessful survey. The tool used for this study is a statistical software named Smart PLS 3.0, the reason we selected this software is that, it is through statistics one can perform a study over the collected data through analysis, interpretation, presentation and organization. In all the available statistical methods, we selected regression analysis as it a method used to establish relationship among variable. Regression analysis also gives us knowledge that which of the independent variable are related to the dependent variables. In our case we want to establish a relationship between the variables under ‘problems faced’ section and related them to the overall satisfaction. Now, the standard approach of regression analysis which is most importantly applied in data fitting is least square method. For the use in data like ours of social sciences, we use partial least squares method. The partial least squares method is also a form of structural equation modeling (SEM). The term structural equation modeling (SEM) refers to a diverse set of mathematical models, computer algorithms, and statistical methods that fit networks of constructs to data. Through SEM dependence of latent variable (dependent variables) on quantifiable variable can be evaluated. Also, through SEM the inter-relationship between one or more latent variables can be defined.
VI. DATA ANALYSIS AND INTERPRETATION
A. Regression analysis of the proposed hypothesis (using SmartPLS tool)
Now, we will check and confirm the proposed hypothesis H1, H2 and H3. For this we run the data in a statistical software viz SmartPLS 3.0. SmartPLS is a software with graphical user interface for structural equation modeling (SEM) using the partial least squares (PLS) method. The software could be used in empirical research to analyze collected data (e.g. from surveys) and test hypothesized relationships.
becomes our latent variable (dependent variable) and the above mentioned options become the quantifiable variables. Their construct will be seen as follows:-
Figure 2: Problems faced with its variables
This construct of the ‘problems faced’ is to be related to ‘overall satisfaction’. Now, we relate ‘overall satisfaction’ to the idea of purchase intensions. The relation can be done because it is understood that if a customer is satisfied with the deal he/she will definitely build a sense of trust towards e-shopping and hence will come back to shop and/or do business with e-commerce. So, the final construct will look like the one below:-
Figure 3: Problems faced and overall satisfaction (purchase intensions) relationship
[image:8.612.70.489.537.706.2]Similarly, the above construct can be extended by linking the factors that would ‘re-establish trust’ to the problems faced and purchase intensions. The factors that re-establish trust can also be considered as ones promoting recommendations or word of mouth publicity by existing customers to possibly newer customers. Therefore, the above construct evolves to the one as follows:-
Figure 4: Problems faced relationship with overall satisfaction and factors that re-establish trust
Problems Faced(dep endent variable)
Poor quality product Faulty product Lack of convenient exchange policy
Delayed delivery
Purchase intensions
Overall
Satisfactio n
Factors that re-establish
Now, we create and run the same constructs in the SmartPLS 3.0 software for SEM calculations for PLS algorithm and bootstrapping. PLS algorithm will give the positive or negative relationship amongst the latent variables and quantifiable variables, and between one or more latent variables. Whereas, bootstrapping will let us know whether the obtained results are significant or not. For a 95% confidence level and maximum variability with 0.05 level of precision, a value of ≥1.96 is required. Let us see how these values comes out to be for our data.
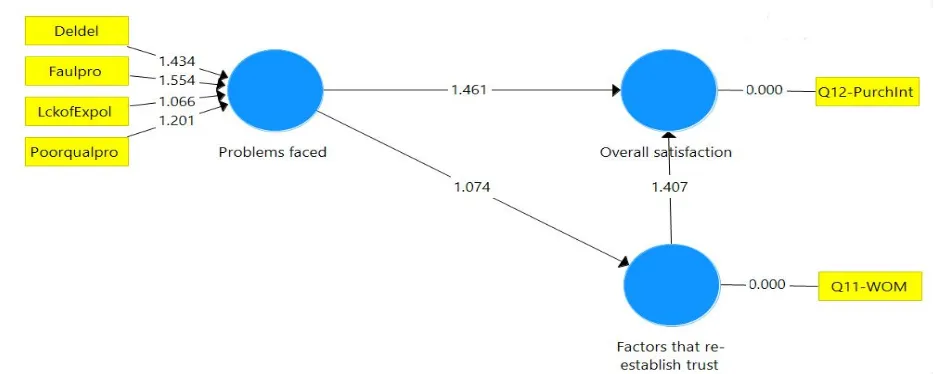
[image:9.612.71.542.160.351.2]B. Smart PLS model
Figure 5: PLS model
Analysis:We can clearly see from figure 5 that quantifiable variables like delayed delivery, lack of convenient exchange policy and poor quality product are positively related to the latent variable of ‘problems faced’. This means that more the number of issues like delayed delivery, lack of convenient exchange policy and poor quality product occur, the greater will be the problems faced by the customers. This stands true practically too. Now, the variable ‘faulty product sent’ seems to be negatively related to problems faced. That means according to this model, an increase in issues of faulty product sent will decrease the ‘problems faced’ by customers. However, this result doesn’t seem to be a practical result.
The problems faced are negatively related to both overall satisfaction and factors that re-establish trust. This means that an increase in ‘problems faced’ will lead to a decrease in ‘overall satisfaction’ and ‘factors that re-establish trust’. This result can be practically related too.
The ‘factors that re-establish trust’ are positively related to ‘overall satisfaction’. This means an increase in ‘trust’ will lead to an increase in ‘overall satisfaction’. This result can be practically related.
C. Smart PLS Bootstrapping
[image:9.612.74.541.533.720.2]Analysis- The figure 6 shows the significance values between variables. We know that for a 95% confidence level and maximum variability with 0.05 level of precision, a value of ≥1.96 is required. But in our survey, this value of ≥1.96 cannot be achieved. Hence we can say that our results are not significant. This gives us the following interpretations like:- the survey weakly supports the hypothesis that problems faced by customers tend to reduce their overall satisfaction, the survey weakly supports the hypothesis that problems faced by customers tend to be sorted by the factors that re-establish trust and the survey weakly supports the hypothesis that the factor that help re-establish trust amongst the customers tend to increase overall satisfaction.
VII. CONCLUSIONS
From the above results and their interpretations, it is stated that the problems faced by customers tend to decrease their trust and overall satisfaction. This decrease in trust and overall satisfaction ultimately leads to negative effects on purchase intentions and word of mouth publicity for the company specific. This leads to loss of loyal customers and hence loss in revenues.Though the results are indicative as they give the same co-relation as proposed in the hypothesis, but they cannot be said to be conclusive as it ceases to be confirmed through significance testing.For further confirming of the said hypothesis, larger number of data is required to more carefully analyze and infer results.
VIII. DISCUSSION AND ANALYSIS
It is evident from the results obtained that though the proposed hypothesis is confirmed i.e. the problems faced by e-commerce customers tend to create a sense of distrust i.e. negatively affects overall satisfaction. Another relationship that we can see through our study is that when there are problems faced by the e-commerce customers, it tends to decrease trust in factors that re-establish consumer trust. A positive relationship was found between factors that re-establish trust and overall satisfaction. This shows that the factors to re-establish trust raisesthe overall satisfaction level of the e-commerce customers. Thus, through this study the analysis of consumer requirements is performed. The online shopping preference of consumers, problems faced by them and solutions proposed are clearly highlighted. This is supported by the hypothesis testing.
However, these results could not prove their significance. There can be several reasons responsible for this result like fewer amount of data gathered, the respondents perception is different as the proposed hypothesis and wrong answers provided by the respondents etc.
REFERENCES
[1] Greatorex, M., & Mitchell, V.W, 1994, Modelling consumer risk reduction preferences from perceived loss data. Journal of Economic Psychology, 15, 4, 669-685.
[2] Layton, T.P, 2005, Informatin Security Awareness: The psychology behind the technology. Bloomington: AuthorHouse.
[3] Mark S. Ackerman and Donald T. Davis, Jr., 1987, Privacy and Security Issues in E-Commerce, Review chapter for the New Economy Handbook (Jones, ed.), in press.
[4] N. Anubhav Reddya; Brig. Rajiv Divekar, 2014, A Study Of Challenges Faced By E-Commerce Companies In India And Methods Employed To Overcome Them. Symbiosis Institute of Management Studies Annual Research Conference (SIMSARC13).
[5] Stevens, 1989, "Integrating the Supply Chain", International Journal of Physical Distribution & Materials Management, Vol. 19 Iss: 8, pp.3 – 8.
[6] Suh, B., & Han, I., 2003, The impact of customer trust and perception of security control on the acceptance of electronic commerce. International Journalof Electronic Commerce, 7, 3, 135–161.