5
X
October 2017
Study on Nonlinear Behavior of Human Hard
Tissue Based On Isotropic Damage Model
Suhas N1, K Vijay Kumar2, Dr. Chandrashekhar Bendigeri3 1,2
PG student, 3Associate Professor, Department of Mechanical Engineering, University Visvesvaraya College of Engineering, Bengaluru, Karnataka, India
Abstract: The main aim of this study is to formulate and develop a nonlinear isotropic damage model using C-Program which can capture the nonlinear behavior of human hard tissues under stress which the current commercial Finite Element Analysis (FEA) software’s does not have. Finite element models in current commercial packages used to investigate injury mechanisms often fail to examine the effects of variation in geometry or material properties on mechanical behavior of human hard tissue. The study is carried out by implementing the Mazars isotropic damage theory for a rectangular plate of specified dimensions which can be used as an implant by considering the properties similar to that of a human bone and studying its behavior with human bone using the material property degradation method algorithms developed in C-Program. The analysis, specifically meshing of the rectangular plate with iso-parametric quadrilateral elements, the boundary conditions and the explicit loading conditions were implemented using the algorithms developed in C-Program and the resulting displacement were studied using COMSOL software. A computational numerical model of human hard tissues is developed by considering the nonlinear behavior. Human hard tissues is considered as an application. The 2-D shell element is considered for initial analysis. The model is meshed using quadrilateral elements and analyzed using the finite element developed in COMSOL. In present work the construction of a three-dimensional (3D) femur bone from 3D optical scanning has been carried out to import it in the finite element commercial software to create a 3D model. The finite element method is applied to find the stress distribution and displacement in static loading condition on human femur model.
Keywords: Hard tissue, Isotropic Damage Model, Geometric nonlinearity, Femur bone, FEA
I. INTRODUCTION
Human hard tissue is a group of cells with a similar structure, working together for a specific function. The hard tissues of humans are bones, tooth enamel, dentin etc. The main function of human bone is to form the skeletal structure, enable locomotion and protect the various organs of human body. Bone is porous, nonhomogeneous, anisotropic and nonlinear in nature. Human body is subjected to static and varying loads caused by daily activities or special events like running, climbing or accidents. Apart from its main functions the internal structure of bone is maintained and adapted to its external environment by a process called remodeling. Remodeling process will remove micro-damage and increases the fatigue lifetime of human bone. Implants and prostheses are used to support the fractured bone or to replace the missing bone. FEA that are used to design implants, prostheses and to investigate injury mechanisms, often fail to examine the effects of variation in geometry or material properties of human bone. Human femur bone is considered as an application. Femur bone is the longest, heaviest and strongest bone in human body. Femur bone fracture is one of the serious injury to body, often resulting due to an accident or due to aging. To carryout FEA on human bone a new model with algorithm is developed and it follows the line of previously published methods and works.
II. METHODOLOGY
In order to implement a specific theory based deformation for nonlinear analysis, programming languages like C, Python, MATLAB etc is very helpful as the nonlinear deformations can be controlled as per theory by functions and matrices. The detailed procedure about this work and experimentation methods is outlined below.
A.Steps carried out in the Present work
Fig. 1: Steps carried out in Present work
III. CONTINUUM DAMAGE MECHANICS
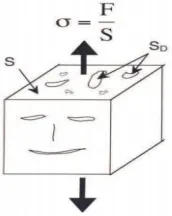
Damage mechanics is one of the most important and interesting branches of solid mechanics although it is still developing, it has already been applied to many engineering problems. The pioneer of the damage parameter proposal was Murzewski, who put forward a probabilistic interpretation of the decohesion parameter. Following in his footsteps, Kachanov, then Rabotnov formulated the famous equation of damage growth under creep conditions for the uniaxial state of stress. Within the classical approach, a very simple measure of the damage amplitude in a given plane is obtained by measuring the area of the intersection of all defects with that plane. For example, based on fig. 2, it is readily observed that the effective area of the sample subjected to uniaxial tension is S
− SD. S represents the cross sectional area and SD represents the defects trace in the considered plane. The following positive scalar
d is then commonly considered as a damage variable in the above 1D experiment and it is written as d = SD/S.
Fig. 2: Cross section of a damage material
The isotropic damage models are based on the simplifying assumption that the stiffness degradation is isotropic, i.e., stiffness moduli corresponding to different directions decrease proportionally and independently of direction of loading. Consequently, the damaged stiffness matrix is expressed as
= (1− )
where is elastic stiffness matrix of the undamaged material and d is the damage parameter. Initially, d is set to zero, representing the virgin undamaged material, and the response is linear-elastic. As the material undergoes the deformation, the initiation and propagation of micro-defects decreases the stiffness, which is represented by the growth of the damage parameter . For = 1 , the stiffness completely disappears. In the present context, the ‘D’ matrix represents the secant stiffness that relates the total strain to the total stress
[image:3.612.176.439.75.280.2] [image:3.612.265.351.430.538.2]Similarly, to the theory of plasticity, a loading function is introduced. In the damage theory, it is natural to work in the strain space and therefore the loading function is depending on the strain and on an additional parameter k, describing the evolution of the damage. Physically, k is a scalar measure of the largest strain level ever reached. The loading function usually has the form
( , ) = ̃( )−
Where ̃ is the equivalent strain, i.e., the scalar measure of the strain level. Damage can grow only if current state reaches the boundary of elastic domain ( = 0 ). This is expressed by the following loading/unloading conditions
f ≤ 0, k ≥ 0, kf = 0
It remains to link the variable k to the damage parameter d. As both k and d grow monotonically, it is convenient to postulate an explicit evolution law = ( ). The important advantage of this explicit formulation is that the stress corresponding to the given strain can be evaluated directly, without the need to solve the nonlinear system of equations. For the given strain, the corresponding stress is computed simply by evaluating the current equivalent strain, updating the maximum previously reached equivalent strain value and the damage parameter and reducing the effective stress according to
= (1− ) .
A.Theory & Assumptions
1) The non-linear static analysis and geometric non-linearity is considered.
2) Material is considered to be homogeneous, isotropic and linear elastic. Dynamical effects are neglected.
3) Deformations are large to use finite deformation theory (Geometric non-linearity).
B. Mazars damage model
In the continuum damage mechanics formalism, a damage variable d represents the amount of deterioration due to crack growth. Damage plays an essential role in the weakening of the material's stiffness. Mazars model describes the fracture behaviour by an isotropic scalar damage variable d, which enters the constitutive stress-strain relationship:
= (1− )
The damage is described by two different evolution laws for the development of damage under tension and compression. The total damage is given by a linear combination of these two:
= ∝ × + ∝×
Where dt and dc are the damage variables in tension and compression, respectively. They are combined with the weighting
coefficients αtand αc.
The tensile damage and compressive damage is given by the relation
= 1− (1− )−
exp[ ( − )]
= 1− (1− )−
exp[ ( − )]
with At, Ac, Bt and Bc are materials parameters . They are obtained using tensile and compression tests.
The tensile and compressive weights, αtand αc are derived from principal stresses. The tensile principal stresses and the material
stiffness define the tensile principal strains
∈ = 〈 〉
These define the weights from
∝ =
The compressive strains are computed from the difference between principal strains and tensile strain:
= −
depend on the principal strains: = 1 if > 0, 0 otherwise.
k is a state variable to memorize the maximum value of the effective tensile strain, which is defined by the principal strains in tension.
= 〈 〉 + 〈 〉 + 〈 〉
Here 〈.〉 means the Macaulay brackets (negative values replaced by zero). k is updated (and therefore the damage increases) only if exceeds its historical maximum. The state k is initialized to k0. Initially, its value is k0, which can be related to the peak stress ft
of the material in uniaxial tension:
=
The above specified theory of damage model is written in C-program using functions and matrices.
IV. STUDY OF STRESS VARIATION AND VALIDATION OF ALGORITHMS DEVELOPED IN C-PROGRAM
A. Tensile Test on Human Cortical bone
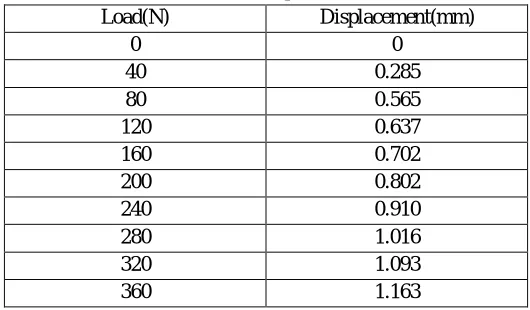
Tensile test is done to study the behaviour of bone under tensile load on Universal Testing Machine (UTM). The specimen is held in pneumatic fixtures and load is applied. Pneumatic fixture helps in gripping of verify fragile objects and also gripping force increases as the applied tensile is increased. This reduces the fixture errors seen usually while testing porous objects. Tensile test on prepared cortical bone specimen is carried in Metallurgical Laboratory. The displacements measured for different loads is as shown in table 1. The dimensions of the specimen is gauge length = 38mm, width = 11.86 mm and thickness = 1.82mm.
Test results: Peak load =396 N
Peak displacement = 1.335 mm Break load = 360.06 N
Break displacements = 1.163 mm Final area = 15.015 mm2
[image:5.612.173.438.460.615.2]Peal displacement = 30.5%
Table 1: Load and displacement values Load(N) Displacement(mm)
0 0
40 0.285
80 0.565
120 0.637
160 0.702
200 0.802
240 0.910
280 1.016
320 1.093
360 1.163
B. FEA of Cortical bone in COMSOL using developed Mazars damage model
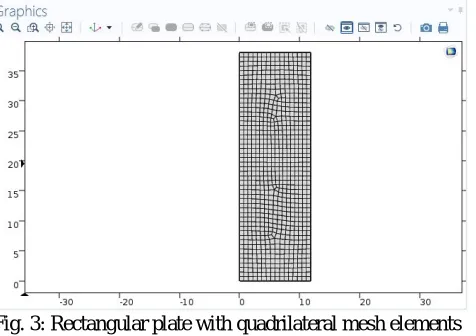
Finite Element Analysis of Cortical bone is carried out using COMSOL assuming a rectangular plate with fixed boundary condition and the input parameter for the same is mentioned below with increasing load step from the values determined experimentally from the tensile test.
Fig. 3: Rectangular plate with quadrilateral mesh elements
2) Material properties: The Young’s modulus of the femur bone varies from 10 to 20 GPa and for the analysis it was taken to be 20 GPa. Poisson’s ratio and density used were 0.3 and 2000 Kg/m3respectively.
3) Loading and boundary conditions: Loading conditions were applied to simulate real case scenarios. Increasing tensile loads steps on top edge of the plate is applied from the values determined experimentally from the tensile test. Bottom edge of plate is fixed. Initial load value = 0 N
Final load value = 360 N Number of steps = 9
4) Results: Fig. 4 and Fig. 5 show results of rectangular plate, using quadrilateral mesh. FEA analysis is performed on rectangular
model with increasing load steps. From the numerical analysis in COMSOL we have found that the displacement of a rectangular
[image:6.612.211.449.76.244.2]plate considering dynamic stiffness update using Mazars isotropic model subjected to a transverse load of 360N has a transverse displacement of 1.52mm as shown in fig. 4. The maximum Von-Mises stress generated in this analysis is 22MPa as shown in fig. 5.
Fig. 4: Displacement contour in millimeters.Fig. 5: Von-Mises stress contour in N/m2
C. Finite Element Analysis of Cortical bone in COMSOL without damage model
Finite Element analysis of rectangular plate of same dimensions but with normal isotropic material is solved. This iteration will not consider damage and no stiffness update will be considered during finite element calculation.
Fig. 6: Displacement contour (mm) without damage model Fig. 7: Von-Mises stress contour (N/m2) without damage model.
V. FINITE ELEMENT ANALYSIS OF HUMAN FEMUR BONE USING DAMAGE MODEL
A computational numerical model of Human Femur bone will be developed by considering the geometric non-linear behaviour. Human Femur bone will be considered as an application and analysed using damage model in COMSOL. This work aims to construct a three-dimensional (3D) femur bone from 3D optical scanning and import it in the finite element commercial software COMSOL to create a 3D model. The finite element method is applied to find the stress distribution and displacement in static loading on human femur model.
A. Steps in FEA of Human Femur Bone using Damage model
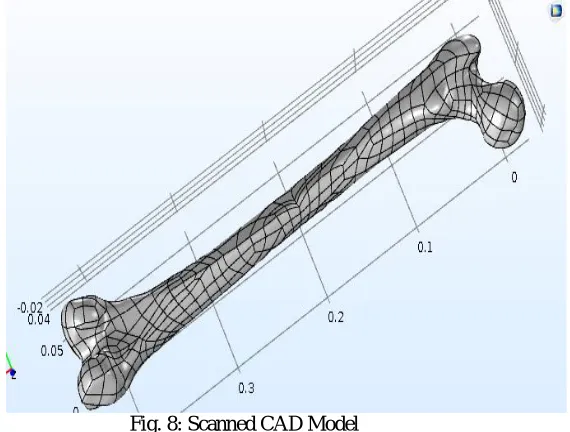
1) Development and Description of the CAD Geometry : This study considered different CAD designs. One of the CAD designs was scanned CAD data given in Fig. 8. By doing this, the present study was able to compensate for unwanted results and benefit by seeing the effects of the different and more accurate CAD model. Since the femur bone clearly consists of very complex geometry, it is implied that this was the best route to take and one that would yield the best results.
Fig. 8: Scanned CAD Model
[image:7.612.184.469.431.647.2]Fig. 8: Meshed model of femur
3) Material properties, Loading and Boundary conditions: The Young’s modulus of the femur bone varies from 10 to 20GPa and for the analysis it was taken to be 20GPa. Poisson’s ratio and density used were 0.3 and 2000 Kg/m3respectively.The geometry is fixed in the lower end cup and in the top acetabular cup region 500N (50 kg weight of the person in normal standing) is applied as shown in fig. 9 a & b.
Fig. 9 a & b : a) Load applied area b) Fixed end (Rotatations are not constrained)
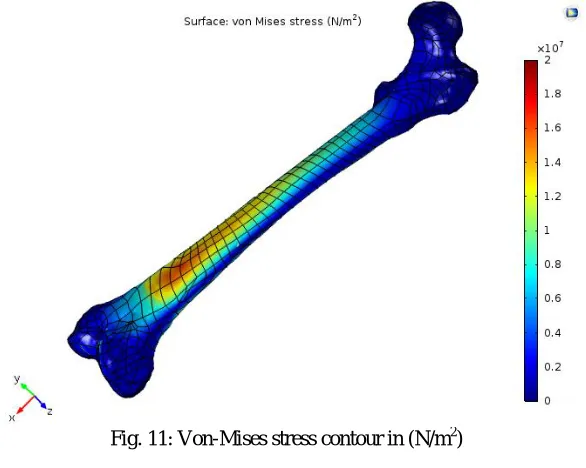
Fig. 10: Von-Mises stress for simplified finite element model of femur under 500N load on surface of femoral head
Fig. 11: Von-Mises stress contour in (N/m2)
VI. RESULTS AND DISCUSSIONS
A. Experimental results on the cortical bone and the FEM results obtained as discussed above is compared with each other to make a proper conclusion and to determine how closely the formulation is resembling the experimental method for an implant to successfully adapt to this method.
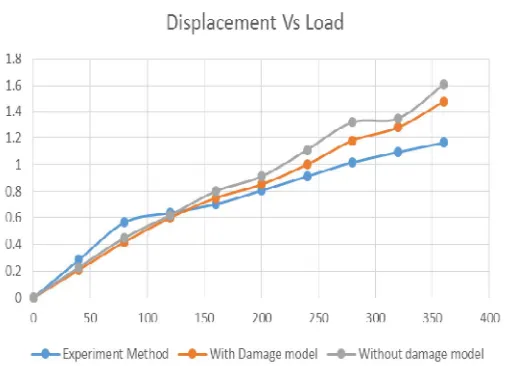
B. Below Table 2 indicates the load (N) vs. displacement (mm) values for experiment and FEM methods.
Table 2: Load vs. Displacement values of Experiment and FEM method Load ( N) Displacement (mm)
Experiment method FEM with damage model
FEM without damage model
0 0 0 0
[image:9.612.68.498.662.732.2]80 0.565 0.42 0.45
120 0.637 0.60 0.62
160 0.702 0.75 0.80
200 0.805 0.85 0.91
240 0.910 1.00 1.11
280 1.016 1.18 1.32
320 1.093 1.28 1.65
360 1.163 1.52 1.81
C. Below fig.12shows Comparison of Experiment method and FEM method with and without considering damage model
Fig. 12: Comparison of Experiment method and FEM method (with and without considering damage model)
[image:10.612.68.496.74.186.2]D. Experimental tensile test results on the cortical bone and FEA results for same dimensions of the cortical bone is calculated. This is carried to determine how well the displacements and stresses obtained from Isotropic damage model formulation is resembling the experimental tensile test. One can easily observe that maximum stress occurs near fixed end and maximum displacement takes place near top end as seen in FEA results. The details of results are given in Table 3.
Table 3: Comparison of Experiment results with 2D FEA results
Experimental results 2D FEA results Maximum displacement 1.163 mm 1.52 mm
Maximum stress 23.97 MPa 22 MPa
[image:10.612.199.454.217.400.2]E. In the FEA analysis of femur bone, normal standing condition is considered. The maximum stress as per analysis is 20MPa.
Table 4: 3D FEA results of femur bone 3D FEA femur results Maximum displacement 0.0001103 m
Maximum stress 20 MPa
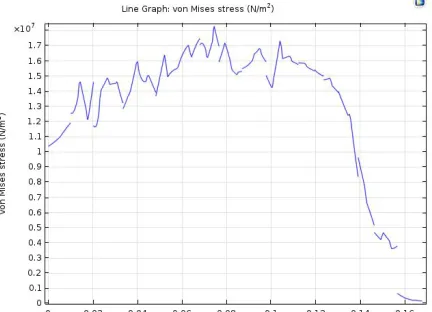
[image:10.612.70.540.507.552.2]Fig. 13: Von-Mises stress variation along the length of femoral stem. Generated in COMSOL
VII. CONCLUSIONS
This study concentrates on geometric nonlinear analysis of human bone using Isotropic damage model. In order to implement Isotropic damage model theory C-programming language was used.
The stress distribution and displacement obtained from FEA of 2D cortical bone using Isotropic damage model written in C-program has shown close values with experimental tensile test, compared to FEA of 2D cortical bone without using damage model. This validates the Isotropic damage model developed using C-program.
FEA on 3D femur bone using Isotropic damage model has been carried out by considering normal standing condition of a person. The results obtained from FEA on femur bone shows that the maximum stress occurs at the middle of femur bone and the maximum displacement occurs at the head of the femur bone.
REFERENCES
[1] Uzair N. Mughal, Hassan A. Khawaja and M. Moatamedi, on “Finite element analysis of human femur bone” The International Journal of Multiphysics 2015: Volume 9 Number 2.
[2] Nithin Kumar KC, Tushar Tandon, Praveen Silori, Amir Shaikh, on “Biomechanical stress analysis of a Human Femur bone using ANSYS” Materials Today: Proceedings 2 ( 2015 ) 2115 – 2120, Elsevier.
[3] Finite Element Analysis, by Azim Ataollahi Oshkour, DOI: 10.1155/2014/807621, Elsevier.
[4] Sivakumar V, Asish Ramesh U. N, on “Non-Linear 3d Finite Element Analysis of the Femur Bone” International Journal of Research in Engineering and Technology Volume: 02 Issue: 03 | Mar-2013, 266 – 275.
[5] A.E. Yousif , M.Y. Aziz. Biomechanical Analysis of the human femur bone during normal walking and standing up 2012; 2250-3021.
[6] RAJI NARELIYA , VEERENDRA KUMAR , “BIOMECHANICAL ANALYSIS OF HUMAN FEMUR BONE” , International Journal of Engineering Science and Technology (IJEST) , Vol. 3 , No. 4 , 2011, 3090-3094.
[7] M. Mashayekhi a, S. Ziaei-Rad a, J. Parvizian a, J. Niklewicz b, H. Hadavinia- “Ductile crack growth based on damage criterion:Experimental and numerical studies”.
[8] Xishi Wang , Tian Ying Wang , Fuchuan Jiang ,Yixiang Duan , “ The hip stress level analysis for human routine activities” , BIOMEDICAL ENGINEERING APPLICATIONS, BASIS & COMMUNICATIONS , 17, 2005, 153-158.