Technology (IJRASET)
Detecting Dodgy Transactions through High Value
Networks in Economic Services
Sonia1, Anil Arora2 1
M.Tech(CSE) Scholar, 2Assistant Professor Gateway Institute of Engineering & Technology, Sonipat
Abstract-: The purpose of this paper is to detect the dodgy or suspicious transactions in financial era with the help of data mining technique and also to detect more suspicious transactions in suspicious transactions. K mean technique is used to detect different clusters. Data Mining is a powerful new technology having great potential to help organizations by focusing on most important data in their corresponding data warehouse. It is the process of extracting information from large volumes of raw data. The need for data mining is because we are having large amount of data with less information in it. Data mining tools are used to analyze this data. WEKA is a data mining tool. This paper also gives use of WEKA in data mining WEKA also provides the facility for classification of data with different algorithms. Different types of bank frauds are also discussed in this paper. With the adoption of new technology as well as changing customer and staff expectations it is challenging for bank to navigate technology strategy alternatives .By using data mining, banks can differentiate their customers that what type of customers can be fraudster in future and what customers can give benefit to banks. Bank can detect highly suspicious networks from suspicious network.
Keywords-: White Collar Crimes, Frauds, Data Mining, Suspicious, Clustering, WEKA Tool.
1. INTRODUCTION
White Collar Crimes are those crimes that are committed by people of high status in the course of their occupation. Bank frauds, extortion, black mail are the different types of white collar crime. Bank Fraud involves actions in which a person is involved in the activities whose purpose is to defraud a bank of its funds. Black mailinvolves a person demanding money from another person using threats such as injury of property or accusation of a crime or even the exposure of a secret.Bribery is another form of white crime which involves a person giving something of value to another person with the intent of influencing their actions or persuading them to undertake certain favors.
A. White Collar Crime and Banking
Since the 1990’s economic reforms, the entire banking products structure has undergone a major change. With de-regulation, increased competition and IT revolution making, it is possible to provide ease and flexibility in operations to customers, banks are also evolving and trying to become one-stop financial supermarkets. Traditionally banks were defrauded, by the fraudster by depositing stolen cheques, forged or altered cheques, fraudulent demand drafts, fraudulently procuring loans/lines of credit by submitting fake documents etc. With the advent of technology the fraudster has become more tech savvy. The focus area has shifted to technology driven products like wire transfers, internet banking, mobile banking, correspondent banking etc. Some examples of frauds in banking sector are:
1) Cheque Fraud: Cheques can be altered to an illegitimate payment recipient and higher transaction amount by adding a few digits or may be provided with or cheque can be make completely forged. Suspicious properties of hand or machine written cheques can be recognized by special experts [15].
2) Loan Fraud: Fraudulent loan applications which are reason of bank fraud may contain false information to hide financial problems. Also, an employee can knowingly approve loans to accomplices who declare bankruptcy.
3) Money Laundering: It is a special kind of bank fraud in which the main aim is to hide true information of origin of funds. 4) Identity Theft: In this fraud, the information of an individual is obtained and this information is used to apply for identity cards,
accounts and credit in that person’s name. The information can be obtained from mail scam, telephone.
Technology (IJRASET)
when it is being sent to the user. Card can also be negotiated by merchant who undertakes duplicate transaction of card.
II. RESEARCH BACKGROUND
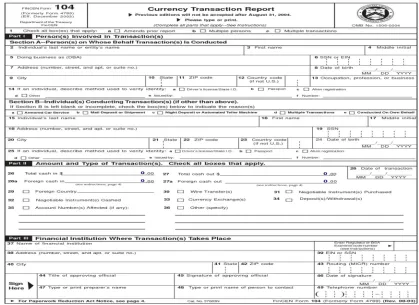
The idea of this research has been taken from the book “Data Mining for Intelligence, Fraud and Criminal Detection” Advanced Analytics and Information Sharing Technologies of Christopher Westphal. Much attention has been given to financial crimes detection efforts post -9/11 era. To help combat the volume of financial crimes, a majority of international governments have created financial intelligence units to defend the integrity of worldwide financial markets .When the BSA6 was enacted, it put a mandatory requirement on banks and financial institutions, such as credit unions, savings and loans, and thrift institutions to file a Currency Transaction Report (CTR)7 for any amounts that were deposited, withdrawn, transferred, or exchanged that exceeded $10,000 in cash or coin (31 CFR 103.22). The activity has to be conducted by or on behalf of the same individual and the daily aggregate amount must exceed $10,000. Thus, if an individual went to three separate branches of a bank on the same day and deposited, say, $5,000 at each branch, the bank would be required to submit a CTR on the individual for the cumulative $15,000 deposited because it exceeds the $10,000 reporting level. CTRs are instrumental in combating all types of financial crimes and, although very powerful, their utility is somewhat limited due to certain conditions and restrictions placed on their reporting requirements. As with any system, the criminal element finds ways to circumvent the laws and new ways to launder their proceeds. Specifically, the drug dealers and organized crime members would enlist runners, mules, or smurfs to visit different banks to make deposits or purchase monetary instruments just under the $10,000 limit to avoid the filing requirements.
III. CONCEPTUAL FRAMEWORK
For solving the problem of identification of suspicious and non-suspicious transaction we have follow up the following procedure.
A. Data Mining
Data Mining automates the detection of relevant patterns in a database, using defined approaches and algorithms to look into current and historical data that can then be analyzed to predict future trends [7]. Because data mining tools predict future trends and behaviors by reading through databases for hidden patterns, they allow organizations to make proactive, knowledge-driven decisions and answer questions that were previously too time-consuming to resolve.
B. Clustering
Clustering is a data mining technique that makes meaningful or useful cluster of objects which have similar characteristics using automatic technique. The clustering technique defines the classes and puts objects in each class, while in the classification techniques, objects are assigned into predefined classes. To make the concept clearer, we can take book management in library as an example. In a library, there is a wide range of books in various topics available. The challenge is how to keep those books in a way that readers can take several books in a particular topic without hassle. In this paper, K-means clustering is used. K-means clustering is a method of vector quantization originally from signal processing, which is popular for cluster analysis in data mining. K-means clustering aims to partition n observations into k clusters in which each observation belongs to the cluster with the nearest mean, serving as prototype of the cluster [16]. This results in a partitioning of the data space into Voronoi cells. The problem is computationally difficult (NP-hard).
C. WEKA Tool
WEKA is a data mining tool. The WEKA or woodhen (Gallirallus australis) is an endemic bird of New Zealand. WEKA (Waikato Environment for Knowledge Analysis) is a popular suite of machine learning software written in Java, developed at the University of Waikato, New Zealand [15]. The WEKA suite contains a collection of visualization tools and algorithms for data analysis and predictive modeling, together with graphical user interfaces for easy access to this functionality. It provides many different algorithms for data mining. GUI chooser consists of four buttons:
1) Explorer: An environment for exploring data with WEKA.
2) Experimenter: An environment for performing experiments and conducting statistical tests between learning schemes.
Technology (IJRASET)
[image:4.612.203.434.169.319.2]4) Simple CLI: Provides a simple command-line interface that allows direct execution of WEKA commands for operating systems that do not provide their own command line interface. This Java-based version (WEKA 3) is used in many different application areas, in particular for educational purposes and research. It is freely available under the GNU General Public License and is portable, since it is fully implemented in the Java programming language and thus runs on almost any architecture. It is easy to use due to its graphical user interface. WEKA supports several standard data mining tasks, more specifically, data preprocessing, clustering, classification, regression, visualization, and feature selection [15].
Figure 1: Thumbnail of WEKA
IV. PROBLEM SOLVED IN PAPER
This paper basically focuses on solving the problems of identification of suspicious and non-suspicious transactions takes place primarily in financial sector:
A. Identification of high value networks containing suspicious transactions
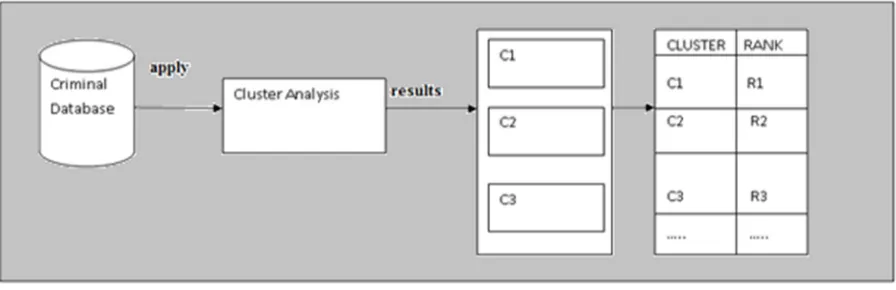
1) To cluster transactions into different groups based on the pattern of their profiling. Identification of high value network contains large no of suspicious transactions and further identification of clusters which have highest value in terms of no of suspicious transactions.
2) Once the cluster with highest value is identified, the high value network of transaction will further bifurcated .This process continues until we get a cluster with highest value cluster containing suspicious transactions. Now, the transactions which are included in this cluster will be identified and specified particularly.
Figure 2: Description of Problem
V. DISCUSSION AND RESULT OBTAINED
[image:4.612.49.497.501.646.2]Technology (IJRASET)
[image:5.612.80.505.134.350.2]several clusters which have been formed by the tool on some criteria (that criteria we have considered here is total score) the network which contains the largest no suspicious transactions will be identified and explored further. For instance, if 5 clusters have been formed by the tool and have different value in terms of total no of transactions containing in those clusters then the cluster having largest value will be analyzed further classification. Real analyzation will be described further as problem is explored.
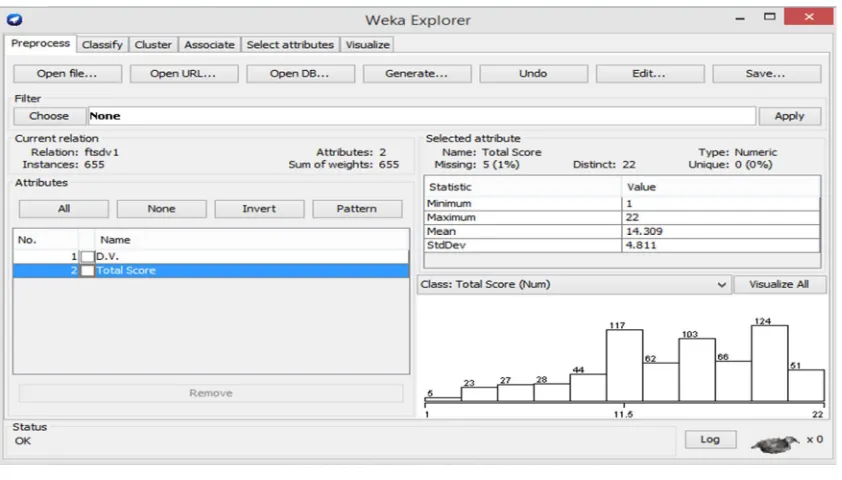
Figure 3: Attribute used for solving problem
As shown in figure 3,the attributed that will be considered for this purpose are total score and decision variable .so these two attributes will be identified from the database and copied into new excel sheet . Then store it in a .CSV file format. In Figure 4, the database we have just stored in .CSV format will be opened up and clusters will be generated automatically by the system on some criteria.
Figure 4: Results of Problem in the Form of Clusters
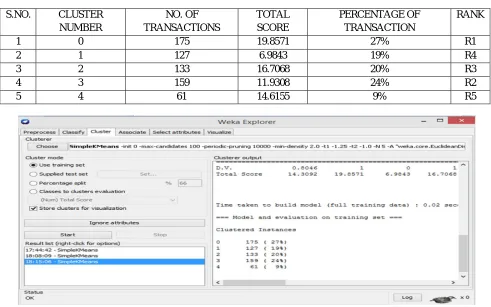
In figure 5, the results is obtained when clustering technique is applied as 5 clusters which having different values. For clustering, Simple K Means technique is used .This technique works as follows:
[image:5.612.79.500.417.657.2]Technology (IJRASET)
with the value of elements containing in a particular cluster .Also the condition on the basis of which the clusters have been formed. The total score of particular cluster is also specified.
B. Here in this figure 5, 5 clusters has been formed which contains different values .Values which defines total no of transactions suspicious or non-suspicious based on flags generated during the database formation. Here it defines in Cluster 0, there are total of 175 transactions in this cluster, and in cluster 1 there are total of 127 transactions in this cluster and so on.
C. Cluster 0
No of Transactions: - 175 Total Score: - 19.8571
D. Cluster 1
No of Transactions: - 127 Total Score: - 6.9843
E. Cluster 2
No of Transactions: - 133 Total Score: - 16.7068
F. Cluster 3
No of Transactions: - 159 Total Score: - 11.9308
G. Cluster 4
[image:6.612.61.552.408.715.2]No of Transactions: - 61 Total Score: - 14.6155
Table 1:Result 1 Obtained for the Second Problem
S.NO. CLUSTER
NUMBER NO. OF TRANSACTIONS TOTAL SCORE PERCENTAGE OF TRANSACTION RANK
1 0 175 19.8571 27% R1
2 1 127 6.9843 19% R4
3 2 133 16.7068 20% R3
4 3 159 11.9308 24% R2
Technology (IJRASET)
Figure 5:Result After Applying Simple k means Technique
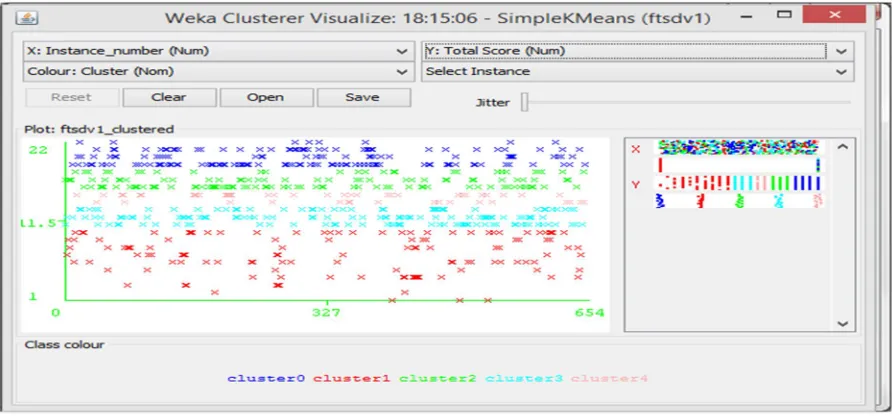
Next, the visualization of clusters which were formed in previous step will be done in this step. X: used for instance number of transaction entries in the database .Y: used for total score which has been calculated by the system for each individual cluster. Total score is the main criteria which have been used to classify the clusters in this step.
[image:7.612.81.527.147.355.2]
Figure 6: Cluster Shown After Applying Clustering Technique
[image:7.612.115.549.425.696.2]When the total score is taken on Y-axis and D.V. is on X- axis then there will be alteration in the representation of the clusters (Figure 6). The formation of clusters will now be along the line of Y-axis ,as we have already discussed the clusters are formed on the basis of total score ,so it differentiates the clusters vertically telling that the clusters lies between different ranges of total score.
Technology (IJRASET)
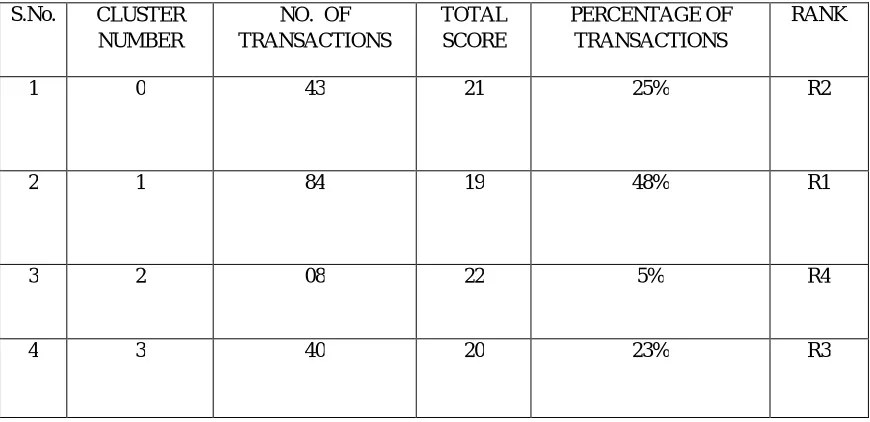
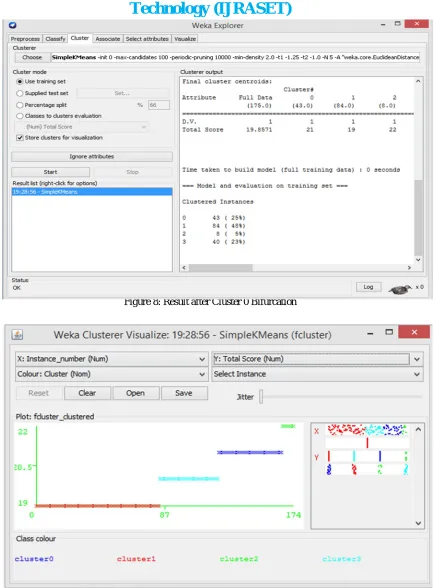
A. Cluster 0 Further BifurcatedAs discussed previously, five clusters were formed after applying clustering technique. Out of these 5 clusters the cluster with highest suspicious transactions will be identified on the basis total no of transactions and total average score calculated by the system for each individual cluster. Cluster 0 is having the largest score value and total no of transactions. So this cluster will be selected to bifurcate further to detect the high value suspicious transactions. In cluster 0, there are total 175 transactions which are further bifurcated. When the cluster 0 is further divided, it breaks down into 4 clusters telling again the highest value network among these 4 networks of suspicious and non-suspicious transactions. The result obtained after applying clustering on cluster 0 is shown as below:
Cluster 0:-
No of Transactions: - 43
Total score: - 21
Cluster 1:-
No of Transactions: - 84
Total score: - 19
Cluster 2:-
No of Transactions: - 8
Total score: - 22
Cluster 3:-
No of Transactions: - 40
[image:8.612.89.524.493.704.2]Total score: - 20
Table 2: Result Obtained After Cluster 0 Bifurcation
S.No. CLUSTER
NUMBER
NO. OF TRANSACTIONS TOTAL SCORE PERCENTAGE OF TRANSACTIONS RANK
1 0 43 21 25% R2
2 1 84 19 48% R1
3 2 08 22 5% R4
Technology (IJRASET)
[image:9.612.99.528.366.648.2]Figure 8: Result after Cluster 0 Bifurcation
Figure 9: Visualization of Clusters after Bifurcation
B. Final Output of Problem
Technology (IJRASET)
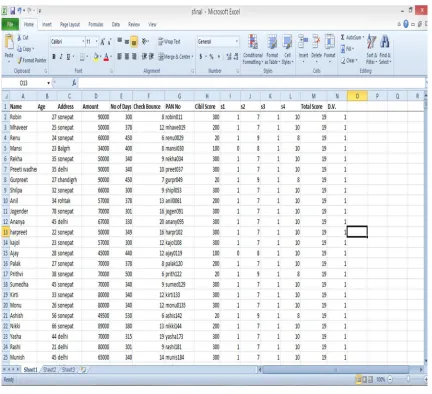
[image:10.612.97.529.88.482.2]from other transactions by Total Score. The Total score for these transactions are defined as 19,20,21,22.
Figure 10:List of Transactions in Final Cluster 2
VI. CONCLUSION AND FUTURE REFERENCE
The outcomes received for the given problem helps in identification of chain of activities that contribute for occurrence of any kind of financial crime and finding out the number of transactions which are prone to major bank fraud. This problem primarily identifies the different networks which contains the suspicious and non-suspicious transactions. As mentioned above in text, the whole dataset will be divided in to different clusters. Out of these networks the network with highest value in terms of large no of suspicious transactions will be selected and investigated further to identify more suspicious networks. The bifurcation processes ends where we have got the networks with highest number of suspicious transactions and which cannot be bifurcated further on the basis of total score.
In future, this project can be useful for various reasons, some of these may be:
A. As this problem focus on detection of overall suspicious activities performed by any victim. So, in future using the patterns of these activities, the origin of crime can be identified.
Technology (IJRASET)
[image:11.612.122.541.102.407.2]VII. APPENDIX
Figure 11:Currency Transaction Report
REFERENCES
[1] Jack Boorman and Stefan Ingves., Financial System Abuse, Financial Crime and Money Laundering. [2] DP_Fraud Detection Banking. pdf, Discussion paper,2012.
[3] Financialfraud.pdf by John Howell & Co. Ltd., August 2009. [4] JERMY QUITTNER."AVOIDING CREDIT CARD FRAUD".
[5] http://abcnews.go.com/business/_nancialSecurity/Story?id=89746andpage=12004.
[6] Abhinav Srivastava, Amlan Kundu, Shamik Sural and Arun K.Majumdar, "Credit Card Fraud Detection Using Hidden Markov Model" IEEE, Transactions On Dependable And Secure Computing, Vol. 5, No 1. , January-March 2008.
[7] M.R. Berthold et al, “Guide to Intelligent Data Analysis”. [8] IJETAE_1112_112 (1).pdf,august 2011.
[9] Financial System Abuse, Financial Crime and Money Laundering Background Paper, February 12, 2001 [10] Vol_6(3)_311 - 322_Ogwueleka, FRANCISCA NONYELUMOGWUELEKA”;
[11] Trees, H.L.V. (2001). Detection, Estimation and Modulation Theory-Part I. John Wiley, New York.
[12] Stolfo, S.J.; Fan D.W.; Lee, W.; Prodromidis, A.; and Chan, P.K. (1997). Credit card fraud detection using meta-learning: Issues and initial results. Proceedings of AAAI-97 Workshop on AI Approaches to Fraud Detection and Risk Management, pp.83-90.
[13] E.Akpinar and N. Usul “Geographic Information Systems Technologies in Crime Analysis and CrimeMapping”2004.
[14] B.Muneendra Nayak et.al “ A Focus on Different Frauds and Enhancing Business Process in Banking Sector Using Data Mining,”, International Journal of Advanced Research in Computer Science and Software Engineering,vol.3,September 2013 .
[15] Swasti singhal et.al “A Study on WEKA Tool for Data Preprocessing, Classification and Clustering”, International Journal of Innovative Technology and Exploring Engineering, pp. 250-253, vol.2, May, 2013.