Technology (IJRASET)
Load Profile Analysis of Electricity Customer
Using Adaline Based Clustering Algorithm
Vijayakumari M1
,
Sundararajan D2Department of EEE, Adhiyamaan College of Engineering, Hosur 635 109, Tamilnadu, India
Abstract: This paper deals with the classification of electricity customers on the basis of their electrical behavior. Client classification may also be used for an integrated planning system, by considering the load-management alternatives which will be enforced to effectively meet the system demand. Therefore, this project proposes a stability index for selecting the foremost appropriate clustering algorithm and a priority index for determining the priority rank of clusters. ADLALINE based neural network clustering algorithm, an analysis approach is bestowed to demonstrate the utilization of these indices. Within the approach, all load curves of shoppers are first clustered with the clustering algorithms beneath a serial given range of clusters. Each customer class is then represented by its load profile. We tend to use the load profiles to check the margins left to a distribution company for fixing dedicated tariffs to every client category.
Index Terms—clustering, feature extraction, model errors, power grid visualization, Neural network.
I. INTRODUCTION
Electrical load profile estimation accuracy is that the measure of correctness of predictability of future load demand, that plays very important role in power grid operation, maintenance and planning decisions. In modern era of technology, responsibility of power is incredibly crucial that is why accurate load forecasting is getting more attention by the researchers to achieve reliability of the modern power system. Transient stability simulation tools are essential for enabling safe and reliable operations of power systems. In real world massive scale systems with thousands of buses, transient stability studies usually generate gigantic volumes of data. This poses a major challenge to power grid planners to investigate the overall system response and identify portions of the system which might be displaying abnormal behavior. This could be well done with load profile classification. This paper addresses the above need by applying clustering techniques on transient stability data, more specifically, voltage and frequency response signals. Common features are extracted and outliers characterized by uncommon features are also identified. Information extraction from transient stability data is that the initial and most important part of this work. It will be shown how clustering [1] can be applied to identify a set of distinct signals that characterize the overall System behavior. Groups of coherent generators [2]–[4] can also be identified in a model-free approach. In a previous work [5] hardiness of the ranking has been tested by assessing the persistence of a specific methodology to produce the best outcomes for different numbers of clusters. Different Classification strategies can be validated and tested according to the same procedure. Load data have been recorded on totally different scales with very varying ranges, which might distort the proximity calculation at clustering. Therefore, all recorded load data had to be normalized using a suitable normalizing factor. During this study [6], the maximal power of an individual Load Profile has been used as a normalizing factor converting Load Profile to per unit variables. However, the maximal power does have a certain limitation, and could give misleading results, as in the cases when an uncharacteristic spike in the consumed power occurred in a load profile for a short period. [7] Conducting load pattern analysis by clustering load curves is a vital task in getting the typical Load Profiles of electricity customers and grouping them into categories according to their load characteristics, which is significant for load forecasting and load estimation load control. Three clustering algorithms such as k-means, fuzzy c-means, and the Self Organizing Map are considered in the clustering of load curves and compared to select the most suitable one with a proposed stability index for grouping the load patterns. However limitation in this paper it provides high algorithmic complexity. This paper addresses the above need by applying Adaline based Clustering algorithm. With this technique, it has been possible to obtain a performance comparable or better than the above methods.
Technology (IJRASET)
II. NEED OF MEASUREMENTS IN POWER SYSTEMS
Electricity market restructuring has enlarged the number of market operators, requiring a redefinition of the tasks of already existing and new operators, and making new category of electricity services. Within the regulation of several countries, electricity suppliers currently benefit from the possibility of designing different tariff structures to be applied to properly re-structured customer classes. To get customer class, adequate information on the consumption patterns of electricity customers represents a significant asset. The adoption of an electricity pattern-based classification of residential customers would need replacement of the present metering units with new interval meters. This meters running in parallel with the consolidation of the electricity markets. The usage-reporting device at each customer site is called a smart meters. It’s a computerized replacement of the electrical meter attached to the outside of many of our homes today. Every smart meter contains a processor, nonvolatile storage, and communication facilities. Although in several aspects, the smart meter’s look and function is the same as its unsophisticated predecessor, its additional features make it more useful. Smart meters can track usage as a function of time of day, disconnect a customer via software, or transmits alarms in case of issues.
A phasors measurement unit along with power profile or synchrophasor is a device which measures the electrical waves on an electricity grid, using a common time source for synchronization. A phasor is a complex number that represents both the magnitude and phase angle of the sine waves found in electricity. Phasor measurements that occur at the similar time are called synchrophasors, as are the power profile devices that allow their measurement. Synchrophasors measure voltages and currents at principle critical substations on a power grid and can output accurately time-stamped voltage and current phasors. The monitored points are preselected through various studies to make extremely accurate phase angle measurements to indicate shifts in system stability. The phasor data is collected either on-site or at centralized locations using Phasor Data Concentrator technologies. The information is then clustered by using clustering algorithms to create the classes of electricity customers.
III. PROCEDURE FOR CLUSTERING CUSTOMER LOAD PROFILE
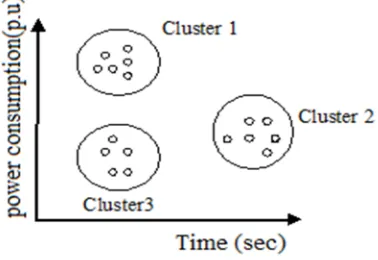
[image:3.612.217.406.504.634.2]In the electricity market, it is extremely fascinating for suppliers to know the electricity consumption behavior of their customers, so as to provide them with satisfactory services with the minimum cost. Information on customer’s consumption pattern within the deregulated power system is becoming critical for distribution companies. One of the suitable tools for extracting characteristics of customers is the clustering technique. The goal of clustering is to work out the intrinsic grouping in a set of unlabeled data and the similarity criterion is distance. Two or lot of objects belongs to the similar cluster if they are close according to a given distance. Consequently, it is the user which must supply this criterion, in such a way that the result of the clustering will suit their needs. Figure 1 shows the cluster formation with a simple graphical example.
Figure 1 example of cluster formation
Technology (IJRASET)
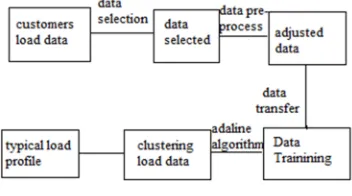
Figure 2 shows the process of clustering of customer load data using Adaline neural network.Figure 2 Process of load data clustering
Customers load data sets have been acquired through the meters. After the data has been collected within the previous stage, data preparation would be arranged to perform the data for the experiment in the next stage. Every attribute is examined and missing values are treated prior to training. The training set is used to train the Adaline neural network model by adjusting the link weights of network model that ought to embrace the data covering the whole experimental area. This method is repeated for the overall set of customer’s data under study. The clustering methods are applied for the set of the customer’s characteristic load curves. After algorithms calibration, the clusters of customers and the respective classes representative load curves are formed.
IV. APPLICATION OF ADALINE NEURAL NETWORK IN LOAD PROFILE CLUSTERING
Adaline neural networks are totally different from biological networks, though many of the concepts and characteristics of biological systems are faithfully reproduced in the artificial systems. Adaline neural nets are a kind of non-linear processing system that is ideally fitted for a wide range of tasks, particularly tasks where there is no existing algorithm for task completion. Neural network is trained to solve certain problems using a teaching method and sample data. In this way, identically constructed Neural Network can be used to perform different tasks depending on the training received. With proper training, Neural Network is capable of generalization, the capability to recognize similarities among totally different input patterns, especially patterns that have been corrupted by noise. In training a network, the obtainable input data set consists of many facts and is normally divided into two groups. One group of facts is used as the training data set and the second group is preserved for checking and testing the accuracy of the performance of the network after training.
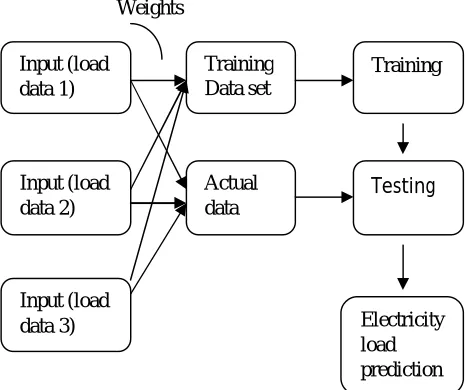
To train the network, we present load data and compare the actual activity of the output data with the desired activity. We tend to then calculate the error, which is defined as the square of the difference between the actual and the desired activities. Next we modify the weight of each connection so as to reduce the error. The training process stops when the error for every training pair is reduced to an acceptable level, or when no further improvement is obtained. Figure 3 shows training process of load data.
Input actual output
Training data
– Error signal + Output
desired
Figure 3 load data training process
This method is additionally called as batch learning and most researchers use it for its good performance. Although the performance Learning
system
Technology (IJRASET)
functions used in the network, the selection of the input parameters holds the key to get the best performance out of the network.
V. SIMULATION RESULTS
This paper presents the procedure to determine typical load profile of various types of consumers of distribution feeders which is based on Adaline clustering methods. The proposed methodology which gives better performance by clustering the customer load data by MATLAB. This work presents an Adaline based clustering method for processing power system customer’s load data for important information and its visualization. The overall goal is to develop better understanding of the underlying system. Active and reactive power consumption of customer randomly obtained by real time power system has been considered for this work. Clustering algorithms identify portions of the system displaying similar load data of customer’s and isolates the subset of distinct signals which characterizes the overall system response. Figure 4 shows the block diagram for load profile clustering using Adaline algorithm.
[image:5.612.40.273.245.440.2]Weights
Figure 4 Block diagram for load profile prediction
The basic idea behind this project is to classify the various load profiles. We consider a power system consisting hybrid grid with wind mill and a non renewable sources. The power system stability is enhanced using UPFC since there may be variations in the wind power output because of the wind variations. At various buses, the different values of loads are connected which varies dynamically and randomly. The variation between every category is obtained by setting the variance for both real power and imaginary power. The values have been obtained by using uniform random number generator with variance at P and Q in pu values. The values are then applied to detect the absolute values (that means both real and reactive taken combine) obtained are applied to Adaline based clustering. As a result of the classification, representative curves for the same groups are generated and then average value from customer classes is obtained.
In our simulation we consider five categories of customers whose load profiles are varying randomly under a normal distribution and this Load profile variation in terms of reactive power and active power in per unit values. As an example, if 8 pu is the real power, then we set 0.8 pu for imaginary power as the variance of the power profile. Similarly all other 4 loads are set. All the data sets obtained through simulation output blocks are trained in supervised learning method by fixing the number of classes to be 5 (from 0 to 4). The values of load are obtained in simulation output blocks and exported to matlab workspace, where those values are trained using Adaline based network with learning rate taken as 0.1. The accuracy of testing depends on the learning rate. If we keep learning rate very less value, 0.001 the results will be less accurate. Adaline is single layer perceptron based neural network. The classes are taken as 0-4 and learning rate is taken as 0.1. For test data, new data sets with another randomly varying load profile is
Technology (IJRASET)
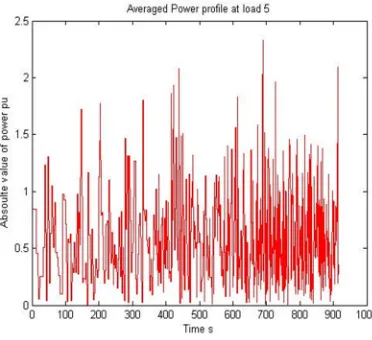
power consumption in pu of 5 consumer loadFigure 5 clustered power profile of 5 customers
X axis - Time in (sec)
Y axis - Absolute value of power in pu
Cyan color trace shows the variation of power consumption by the 5 loads. The values have been obtained by using uniform random number generator.
Figure 6 averaged power profile of 5 customer
X axis - Time in (sec)
Y axis - Absolute value of power in pu
[image:6.612.211.397.388.558.2]Technology (IJRASET)
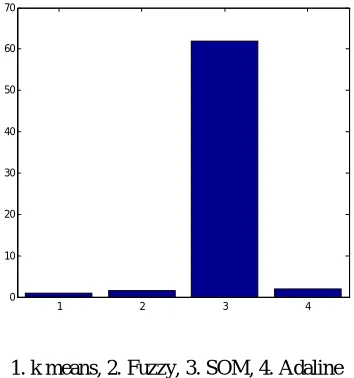
[image:7.612.218.395.86.275.2]1. k means, 2. Fuzzy, 3. SOM, 4. Adaline
Figure 7 clustering time of various algorithms with proposed method when cluster taken as 5
Our proposed method gives 100% accuracy when the variance of 8 was set and learning rate of adaline set as 0.1 and this method can improve location accuracy and coverage without increasing hardware cost.
VI. CONCLUSION
In this project, a new algorithm is proposed for clustering based on ADALINE algorithm, which provides improved performance in the determination of typical load profiles. The execution time of the algorithm for clustering is less than 2 seconds. Hence, with the proposed method of clustering, it is possible to classify the consumers based on the individual load profile. The proposed algorithm gives high accuracy with 0.1 learning rate and the maximum variance is 8.
REFERENCES
[1] Frijol.A.E and Cedars.J, 2000, “Modeling of wind farms in the load flow analysis”, IEEE Trans. Power syst., Vol.15, no.1, pp.110 –115,
[2] keane.A, Cuffe.P, Diskin.E, Brooks.D, Harrington.P, Hearne.T, Rylander.M, and Fallon.T,2012, “Evaluation of advanced operation and control of distributed wind farms to support efficiency and reliability”, IEEE Trans. Sustain Energy, Vol.3, no.4, pp.735–742.
[3] Chang Chien.L.R and Yin.Y.C,2009, “Strategies for operating wind power in a similar manner of conventional power power plant”, IEEE Trans. Energy conv., vol.24,no.4,pp. 926–934.
[4] Zou.K, Agalgaonkar.A.P, Muttaqi.K.M, and Perera.S, 2012, “ Distribution system planning with incorporating dg reactive capability and system uncertainties”, IEEE Trans. Sustain Energy, Vol.3, no.1, pp.112–123.
[5] Yang.X, Zhang.G, Lu.J, and Ma.J, 2011, “ A kernel fuzzy c-means clustering based fuzzy support vector machine algorithm for classification problems with outliers or noises”, IEEE Trans. Power syst., vol.19, no.1, pp.1619–1628.
[6] Gerbec.D, Gasperic.S, Smon.I, and Gubina, 2005, “ Allocation of the load profiles of consumers using probabilistic neural networks”, IEEE Trans. Power syst., vol.20, no.2, pp.548–555.
[7] Tiefeng Zhang, Guangquan Zhang, Jie Lu, Xiaopu Feng, and Wanchun Yang, 2012, “ A New Index and Classification Approach for large Electricity Customers”, IEEE Trans. Power syst., Vol.27, no.1, pp.153– 159.
1 2 3 4 0