5
IV
April 2017
Technology (IJRASET)
Free Vibration Analysis of Differernt Materials
under Crack as a Cantilever Beam
Simarnjit Singh1, Amandeep Singh2 1
Research Scholar, 2Assistant Professor, Mechanical Engineering Department, CTIEMT Jalandhar
Abstract: A simple and unified approach is presented for the vibration analysis of a cantilever beam. Natural frequency and damping ratio are calculated with an experimental process. Estimating damping still remains as one of the biggest challenge in structure made of different materials like brass, stainless steel and aluminium. All materials or structures posses certain amount of internal damping, due to which energy is either dissipated into heat or radiated away from the system. Internal damping includes the 10-15% of the total damping in system. The primary objective of this thesis is the free vibration analysis of different materials under surface cracks to estimate the effect of cracks on damping ratio and natural frequency. The beams of different crack size were pressed up to 30 mm and signals were catches by VIBSCANNER with the help of accelerometer attached at the free end of cantilever. Omnitrend provides Frequency response (FRF) graphs after processing data imported from VIBSCANNER. Damping ratio is determined by half-power bandwidth method. It is observed that damping is increased with increasing crack size for all materials and is minimum in aluminium when compared to brass and stainless steel. The effects of surface cracks and material parameters on the natural frequencies are investigated through this experimental study.
Keywords: Accelerometer sensor, Cantilever Beam, Natural Frequency, Clamp, Damping ratio, Free vibration, Vibscanner, Omnitrend, ANSYS.
I. INTRODUCTION
Technology (IJRASET)
characteristics of Brass, Stainless Steel and Aluminium as a cantilever beam with experimentally and analytical. The effect of cracks on the natural frequency and damping ratio will be observed [10].
A. Beam
[image:3.612.199.412.167.257.2]A beam is an even or vertical auxiliary component that is equipped for withstanding load basically by opposing twisting. The bowing power impelled into the material of the shaft as an after effect of the external load, own weight, range and external reactions to these loads is known as a bending movement.
Figure 1 A Cantilever Beam [11]
A cantilever beam is one whose one end is fixed and the other end carries a point or concentrated load. L-length
W-width T-thickness
B. Theory of Vibration (Theory of Free Vibration of Cantilever Beams) [12]
For a cantilever beam subjected to free vibration, and the system is considered as continuous system in which the beam mass is considered as distributed along with the stiffness of the shaft, the equation of motion can be written as:-
𝑑2
𝑑𝑥2 𝐸𝐼(𝑥)
𝑑2𝑌(𝑥)
𝑑𝑥2 = 𝜔𝑛2𝑚 𝑥 𝑌(𝑥)
Where,
1) E is the modulus of rigidity of beam material
2) I is the moment of inertia of the beam cross-section
3) Y (x) is displacement in y direction at distance x from fixed end
4) n is the circular natural frequency
5) m is the mass per unit length, m A(x)
6) 𝜌 is the material density
7) x is the distance measured from the fixed end
Figure 2 A Cantilever Beam [13] Figure 3 The Beam under free vibrations [13]
[image:3.612.59.520.336.676.2]Technology (IJRASET)
with the circular natural frequency as
𝑓𝑛𝑓 =
𝜔𝑛𝑓
2𝜋 𝐻𝑧
Where I, the moment of inertia of the beam cross-section, for a circular cross-section it is given as 𝐼 = 𝜋
64𝑑
4
Where, d is the diameter of cross section and for a rectangular cross section 𝐼 =𝑏𝑑
3
12
[image:4.612.238.412.434.656.2]Where b and d are the breadth and width of the beam cross-section as shown in the Figure 4.
Figure 4 Cross-section of the Cantilever Beam
C. Eular Bernoulii Beam Theory [14]
Euler Bernoulli’s Beam Theory also known as engineer’s beam theory or classical beam theory is a simplification of the linear theory of elasticity which provides a means of calculating the load carrying and deflection characteristics of beams . It covers the case for small deflections of a beam which is subjected to lateral loads only. It is thus a special case of Timoshenko beam theory. For a cantilever beam subjected to free vibration, and the system is considered as continuous system in which the beam mass is considered as distributed along with the stiffness of the shaft, the equation of motion can be written as:-
𝑑2
𝑑𝑥2 𝐸𝐼(𝑥)
𝑑2𝑌(𝑥)
𝑑𝑥2 = 𝜔𝑛
2𝑚 𝑥 𝑌(𝑥)
Following are the boundary conditions for a cantilever beam
𝑎𝑡 𝑥 = 0, 𝑌 𝑥 = 0, 𝑑𝑌(𝑥)
𝑑𝑥 = 0
𝑎𝑡 𝑥 = 𝑙, 𝑑
2𝑌(𝑥)
𝑑𝑥2 = 0,
𝑑3𝑌(𝑥)
𝑑𝑥3 = 0
𝑑4𝑌(𝑥)
𝑑𝑥4 − 𝛽
4𝑌 𝑥 = 0
𝛽4= 𝜔𝑛2𝑚
𝐸𝐼 , 𝛽𝑛𝐿 = 𝛼𝑛
𝜔𝑛𝑓 = 𝛼𝑛2
𝐸𝐼 𝑚𝐿4
D. Timoshenko Theory of Beams [15]
Technology (IJRASET)
𝐸𝐼𝜕
4𝜔
𝜕𝑥4+ 𝑚
𝜕2𝜔
𝜕𝑡2 − 𝜌𝐼 +
𝐸𝐼𝑚 𝐾𝐴𝐺
𝜕4𝜔
𝜕𝑥2𝜕𝑡2+
𝐽𝑚 𝐾𝐴𝐺
𝜕4𝜔
𝜕𝑡4 = 𝑞 𝑥, 𝑡 +
𝜌𝐼 𝐾𝐴𝐺
𝜕2𝑞
𝜕𝑡2 −
𝐸𝐼 𝐾𝐴𝐺
𝜕2𝑞
𝜕𝑥2
E. Crack Propagation Analysis [16]
Engineering structures are designed to withstand the loads they are expected to be subject to while in service. Large stress concentrations are avoided, and a reasonable margin of security is taken to ensure that values close to the maximum admissible stress are never attained. However, material imperfections which arise at the time of production or usage of the material are unavoidable, and hence must be taken into account.
II. OBJECTIVE
A. The vibration characteristics of a cantilever beam made with different materials such as Stainless Steel (304), Brass and Aluminum (6063).
B. Natural Frequency of all specimens from FRF graphs.
C. To estimate the behavior of damping on varying crack size.
III. EXPERIMENTAL PROGRAM
A. Equipments Used
1) PRUFTECHNIK Condition Monitoring VIBSCANNER (2.9)
2) ACCELEROMETER (VIB 6.142)
3) OMNITREND (2.81.0.25)
4) Specimens: Brass, Stainless Steel and Aluminum bar of dimensions 600 mm X 25.4 mm X 6 mm
5) Display Unit
6) Clamping Device
7) ANSYS R15.0
B. Vibration Measurement Scheme
Vibrating Structure
Accelerometer
Data Acquisition System
Display Unit
Data Analysis
1) Specimen of Stainless steel, Brass and Aluminium beam of dimensions 600 mm X 25.4mm X 6 mm with no crack, 10 cm, 20 cm and 30 cm crack size was used as a cantilever beam.
2) One end of specimen was fixed on the table with the help of clamping device.
Technology (IJRASET)
4) Accelerometer was attached to the free end of the cantilever beam in order to measure the vibration response.
5) The free end of a cantilever beam was pressed up to 30 mm and beam starts vibrating.
6) VIBSCANNER records all the data with the help of accelerometer attached at its free end.
7) The experiments were repeated to check the repeatability of the experimentation (i.e. vibration data).
8) Repeat the whole experiment by changing the specimens.
9) After the completion of experiment, all the data was imported into pc.
10) Then FRF curves obtained by processing the data in Omnitrend software.
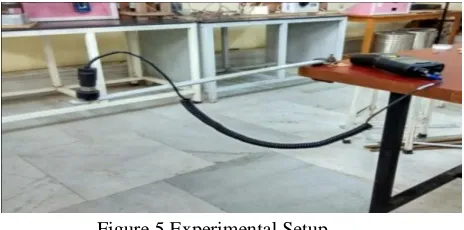
C. Experimental Setup
[image:6.612.200.432.233.348.2]The experiment test rig was built to conduct free vibration analysis on the test specimens to obtain its dynamic characteristics including natural frequencies and damping ratios as shown in Figure 5.
Figure 5 ExperimentalSetup
D. Frequency Response Function Measurement
Frequency response is the quantitative measure of the output spectrum of a system or device in response to a stimulus, and is used to characterize the dynamics of the system. It is a measure of magnitude and phase of the output as a function of frequency, in comparison to the input. Frequency response or FRF is the graph or spectrums are obtained from the free vibration test. Natural frequency was calculated for each specimen from the spectrum. Then the damping was calculated from the spectrum curves with Half Bandwidth Method.
=𝜔2−𝜔1 2𝜔𝑛
Where and are the frequencies corresponding to the half power points which are defined at which the response amplitude is 0.707 times the resonant response amplitude and n is the resonant frequency.
IV. FIGURES AND TABLES
Figure 6 FRF graph of BR1 beam
0 2 4 6 8 10 12 14 16 18 20 22 24 26 28 30 32 34 36 38 40 42
0.000 0.005 0.010 0.015 0.020 0.025 0.030 0.035 0.040 0.045 0.050 0.055 0.060 0.065 0.070
VIBRAT ION ANALYSIS OF CANT ILEVER BEAM \ BRASS \ NO CRACK \103 Ma ch.sp e ctr. > 600 24-08-2016 02:23:48 M
f [Hz] v op [mm/s]
[image:6.612.117.500.530.711.2]Technology (IJRASET)
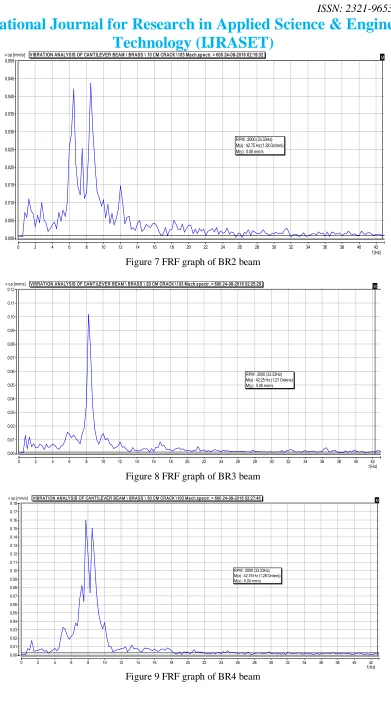
[image:7.612.116.503.76.293.2]Figure 7 FRF graph of BR2 beam
Figure 8 FRF graph of BR3 beam
Figure 9 FRF graph of BR4 beam
0 2 4 6 8 10 12 14 16 18 20 22 24 26 28 30 32 34 36 38 40 42
0.000 0.005 0.010 0.015 0.020 0.025 0.030 0.035 0.040 0.045 0.050
VIBRAT ION ANALYSIS OF CANT ILEVER BEAM \ BRASS \ 10 CM CRACK \103 Mach.spectr. > 600 24-08-2016 02:19:32 M
f [Hz] v op [mm/s]
RPM : 2000 (33.33Hz) M(x) : 42.75 Hz (1.28 Orders) M(y) : 0.00 mm/s
0 2 4 6 8 10 12 14 16 18 20 22 24 26 28 30 32 34 36 38 40 42
0.00 0.01 0.02 0.03 0.04 0.05 0.06 0.07 0.08 0.09 0.10 0.11 0.12
VIBRAT ION ANALYSIS OF CANT ILEVER BEAM \ BRASS \ 20 CM CRACK \103 Mach.spectr. > 600 24-08-2016 02:25:28 M
f [Hz] v op [mm/s]
RPM : 2000 (33.33Hz) M(x) : 42.25 Hz (1.27 Orders) M(y) : 0.00 mm/s
0 2 4 6 8 10 12 14 16 18 20 22 24 26 28 30 32 34 36 38 40 42
0.00 0.01 0.02 0.03 0.04 0.05 0.06 0.07 0.08 0.09 0.10 0.11 0.12 0.13 0.14 0.15 0.16 0.17 0.18
VIBRAT ION ANALYSIS OF CANT ILEVER BEAM \ BRASS \ 30 CM CRACK \103 Ma ch.sp e ctr. > 600 24-08-2016 02:27:46 M
f [Hz] v op [mm/s]
Technology (IJRASET)
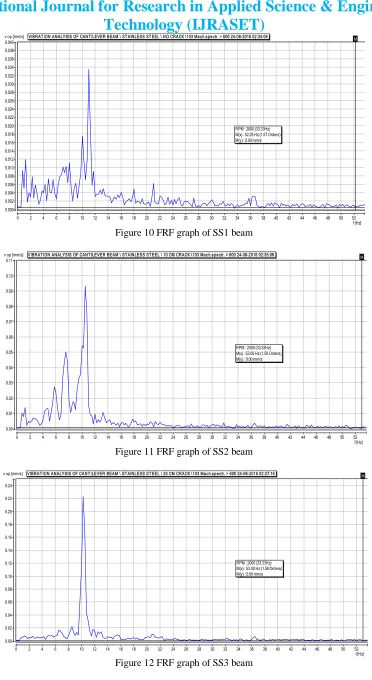
[image:8.612.128.488.76.283.2]Figure 10 FRF graph of SS1 beam
Figure 11 FRF graph of SS2 beam
Figure 12 FRF graph of SS3 beam
0 2 4 6 8 10 12 14 16 18 20 22 24 26 28 30 32 34 36 38 40 42 44 46 48 50 52 0.000 0.002 0.004 0.006 0.008 0.010 0.012 0.014 0.016 0.018 0.020 0.022 0.024 0.026 0.028 0.030 0.032 0.034 0.036 0.038 0.040
VIBRAT ION ANALYSIS OF CANT ILEVER BEAM \ ST AINLESS ST EEL \ NO CRACK \103 Mach.spectr. > 600 24-08-2016 02:34:06 M
f [Hz] v op [mm/s]
RPM : 2000 (33.33Hz) M(x) : 52.25 Hz (1.57 Orders) M(y) : 0.00 mm/s
0 2 4 6 8 10 12 14 16 18 20 22 24 26 28 30 32 34 36 38 40 42 44 46 48 50 52
0.00 0.01 0.02 0.03 0.04 0.05 0.06 0.07 0.08 0.09 0.10
0.11 VIBRAT ION ANALYSIS OF CANT ILEVER BEAM \ ST AINLESS ST EEL \ 10 CM CRACK \103 Mach.spectr. > 600 24-08-2016 02:35:06 M
f [Hz] v op [mm/s]
RPM : 2000 (33.33Hz) M(x) : 53.00 Hz (1.59 Orders) M(y) : 0.00 mm/s
0 2 4 6 8 10 12 14 16 18 20 22 24 26 28 30 32 34 36 38 40 42 44 46 48 50 52 0.00 0.02 0.04 0.06 0.08 0.10 0.12 0.14 0.16 0.18 0.20 0.22 0.24
VIBRAT ION ANALYSIS OF CANT ILEVER BEAM \ ST AINLESS ST EEL \ 20 CM CRACK \103 Mach.spectr. > 600 24-08-2016 02:37:16 M
f [Hz] v op [mm/s]
Technology (IJRASET)
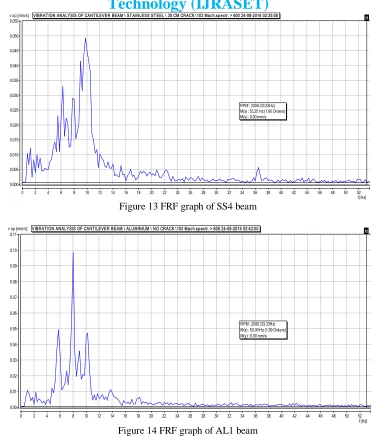
[image:9.612.128.490.76.279.2]Figure 13 FRF graph of SS4 beam
Figure 14 FRF graph of AL1 beam
Figure 15 FRF graph of AL2 beam
0 2 4 6 8 10 12 14 16 18 20 22 24 26 28 30 32 34 36 38 40 42 44 46 48 50 52 0.000 0.005 0.010 0.015 0.020 0.025 0.030 0.035 0.040 0.045 0.050 0.055
VIBRAT ION ANALYSIS OF CANT ILEVER BEAM \ ST AINLESS ST EEL \ 30 CM CRACK \103 Mach.spectr. > 600 24-08-2016 02:35:58 M
f [Hz] v op [mm/s]
RPM : 2000 (33.33Hz) M(x) : 53.25 Hz (1.60 Orders) M(y) : 0.00 mm/s
0 2 4 6 8 10 12 14 16 18 20 22 24 26 28 30 32 34 36 38 40 42 44 46 48 50 52
0.00 0.01 0.02 0.03 0.04 0.05 0.06 0.07 0.08 0.09 0.10 0.11
VIBRAT ION ANALYSIS OF CANT ILEVER BEAM \ ALUMINIUM \ NO CRACK \103 Mach.spectr. > 600 24-08-2016 02:42:00 M
f [Hz] v op [mm/s]
RPM : 2000 (33.33Hz) M(x) : 53.00 Hz (1.59 Orders) M(y) : 0.00 mm/s
0 2 4 6 8 10 12 14 16 18 20 22 24 26 28 30 32 34 36 38 40 42 44 46 48 50 52 0.0 0.1 0.2 0.3 0.4 0.5 0.6 0.7 0.8 0.9 1.0 1.1
1.2 VIBRAT ION ANALYSIS OF CANT ILEVER BEAM \ ALUMINIUM \ 10 CM CRACK \103 Mach.spectr. > 600 24-08-2016 02:40:36 M
f [Hz] v op [mm/s]
[image:9.612.125.496.409.698.2]Technology (IJRASET)
[image:10.612.131.487.275.482.2]Figure 16 FRF graph of AL3 beam
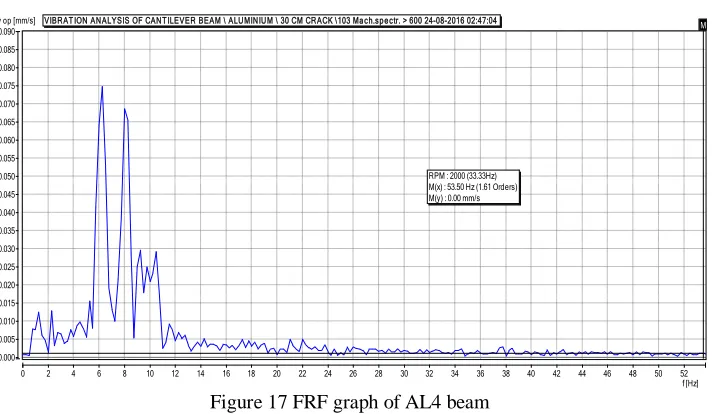
Figure 17 FRF graph of AL4 beam
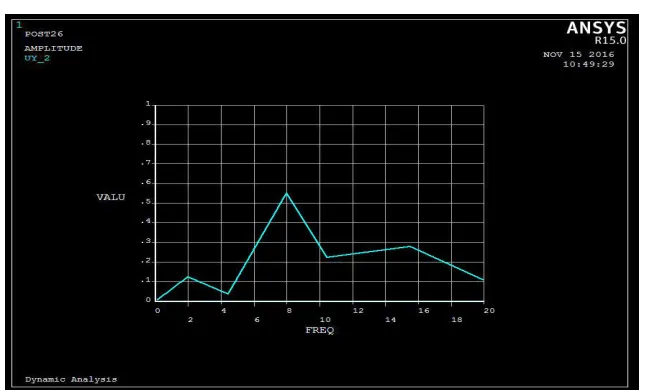
[image:10.612.149.469.560.704.2]ANSYS is engineering simulation software based on the finite element method and is capable of performing static (stress) analysis, thermal analysis, modal analysis, frequency response analysis, transient simulation and also coupled field analysis. The ANSYS metaphysics can couple various physical domains such as structural, thermal and electromagnetic. The harmonic analysis is performed in ANSYS to find the natural frequency of first mode and to plot the graph between frequency and displacement. The graphs so obtained are as
Figure 18 FRF graph of BR1 beam
0 2 4 6 8 10 12 14 16 18 20 22 24 26 28 30 32 34 36 38 40 42 44 46 48 50 52 0.00 0.01 0.02 0.03 0.04 0.05 0.06 0.07 0.08 0.09 0.10 0.11 0.12 0.13 0.14
VIBRAT ION ANALYSIS OF CANT ILEVER BEAM \ ALUMINIUM \ 20 CM CRACK \103 Mach.spectr. > 600 24-08-2016 02:44:18 M
f [Hz] v op [mm/s]
RPM : 2000 (33.33Hz) M(x) : 53.25 Hz (1.60 Orders) M(y) : 0.00 mm/s
0 2 4 6 8 10 12 14 16 18 20 22 24 26 28 30 32 34 36 38 40 42 44 46 48 50 52 0.000 0.005 0.010 0.015 0.020 0.025 0.030 0.035 0.040 0.045 0.050 0.055 0.060 0.065 0.070 0.075 0.080 0.085
0.090 VIBRAT ION ANALYSIS OF CANT ILEVER BEAM \ ALUMINIUM \ 30 CM CRACK \103 Mach.spectr. > 600 24-08-2016 02:47:04 M
f [Hz] v op [mm/s]
Technology (IJRASET)
[image:11.612.129.481.297.474.2]Figure 19 FRF graph of BR2 beam
Figure 20 FRF graph of BR3 beam
[image:11.612.131.484.472.699.2]Technology (IJRASET)
[image:12.612.139.472.320.498.2]Figure 22 FRF graph of SS1 beam
[image:12.612.136.479.517.713.2]Technology (IJRASET)
[image:13.612.145.469.293.485.2]Figure 25 FRF graph of SS4 beam
Figure 26 FRF graph of AL1 beam
[image:13.612.146.469.506.701.2]Technology (IJRASET)
[image:14.612.148.466.291.485.2]Figure 28 FRF graph of AL3 beam
Figure 29 FRF graph of AL4 beam
Table 1 Notation Used
Crack Size Brass Specimens
Stainless Steel Specimens
Aluminium Specimens
No Crack BR1 SS1 AL1
10 cm BR2 SS2 AL2
20 cm BR3 SS3 AL3
[image:14.612.158.455.527.688.2]Technology (IJRASET)
[image:15.612.127.485.96.729.2]V. CALCULATIONS
Table 2 Natural Frequency S. No. Specimens Experimental
Frequency (n) Hz
ANSYS Frequency (n) Hz
% of error
1 BRI 9 11 18.18
2 BR2 8.5 9 5.55
3 BR3 8.25 8 3.03
4 BR4 7.75 7 9.67
5 SS1 11 12 8.33
6 SS2 10.50 11 4.54
7 SS3 10.25 10 2.43
8 SS4 9.75 9 7.69
9 AL1 8 9 10.00
10 AL2 7.25 8 9.37
11 AL3 6.50 7 7.14
12 AL4 6.25 6 4.00
Table 3 Damping Ratio
S. No. Specimens (Half Power Bandwidth)
1 BRI 0.0111
2 BR2 0.0176
3 BR3 0.0242
4 BR4 0.0323
5 SS1 0.0136
6 SS2 0.0238
7 SS3 0.0292
8 SS4 0.0359
9 AL1 0.0063
10 AL2 0.0138
11 AL3 0.0230
Technology (IJRASET)
VI. CONCLUSION
The primary objective of this thesis work is to calculate the natural frequency and damping ratio of different materials (Brass, Stainless Steel and Aluminium) under different crack size. The data has been collected with the help of VIBSCANNER instrument, which gives results in the form of frequency spectrums. Then these spectrums are used to calculate the damping ratio with the help of Half Bandwidth method. Thus the values of natural frequency and damping ratio are obtained from this experiment. Then the same results are obtained after anlysing on ANSYS software and compare it with experimental result.
On the basis of this experimental study, it is concluded that
A. The natural frequency decreases with increase the crack size in each specimen.
B. The value of damping is increases with increase the crack size.
C. The damping ratio of Aluminium specimens is found to be lowest than Brass and Stainless Steel.
D. The increase in material damping could be correlated to the stiffness of materials.
E. All the values constantly increases or decreases on in increasing crack size in all materials.
REFERENCES
[1] https://en.wikipedia.org/wiki/Vibration
[2] Hardeep Singh, Er.Sanpreet Singh, Dr.Gurpreet Singh’ “Evaluation of Free Vibration Characteristics of Cantilever Beams Made From Different Materials”
IOSR Journal of Mechanical and Civil Engineering (IOSR-JMCE) e-ISSN: 2278-1684, p-ISSN: 2320-334X. PP 32-42, 2014.
[3] D. Ravi Prasad and D.R. Seshu, "A study on dynamic characteristics of structural materials using modal analysis", Asian Journal of Civil Engineering, Volume
9, Number 2, Pages 141-152, 2008.
[4] Pawar, R.S, Sawant, S.H., “An Overview of Vibration Analysis of Cracked Cantilever Beam with Non-Linear Parameters and Harmonic Excitations”
International Journal of Innovative Technology and Exploring Engineering, 2278-3075, Volume-3, Issue-8, January 2014, pp. 53-55
[5] Vinay V. Kuppast, Vijay Kumar N. Chalwa, S. N. Kurbet, Aravind M. Yadawad, “Finite Element Analysis of Aluminium Alloys For Their Vibration
Characteristics” IJRET: International Journal of Research in Engineering and Technology eISSN: 2319-1163 | pISSN: 2321-7308, May 2014.
[6] Shibabrat Naik, Wrik Malik, "Experimental modal testing for estimating the dynamic properties of a cantilever beam," Structural Dynamics. 2012.
[7] Pragnesh K. Chaudhari, Dipal Patel, Vipul Patel, “Theoretical and Software Based Comparison of Cantilever Beam: MODAL ANALYSIS” International
Journal of Innovative Research in Advanced Engineering (IJIRAE) ISSN: 2349-2163 Volume 1 Issue 5, Pages 75-79, (June 2014).
[8] Sadettin Orhan, “Analysis of free and forced vibration of a cracked cantilever beam” NDT&E International 40 (2007) 443–450, 1 March 2007.
[9] Metin O Kaya, "Free vibration analysis of a rotating Timoshenko beam by differential transform method", International Journal of Aircraft Engg. & Aerospace, Volume 78, Pages 194-203, 2006.
[10] Simarnjit Singh, Amandeep Singh,“ Free Vibration Analysis On Cantilever Beam- A Review” IJRET: International Journal of Research in Engineering and
Technology eISSN: 2395-0055 | pISSN: 2395-0072, Volume: 04 Issue: 02 | Feb -2017, Pages 1449-1452
[11] http://emweb.unl.edu/Mechanics-Pages/Scott-Whitney/325hweb/Image64.gif
[12] http://www.easyflex.in/pdff/latest/An%20introduction%20to%20Vibration%20Isolation.
[13] http://iitg.vlab.co.in/?sub=62&brch=175&sim=1080&cnt=1
[14] en.wikipedia.org/wiki/Euler-Bernoulli_beam_theory
[15] S.Timoshenko and D.H. Young, Vibration problems in Engineering
![Figure 1 A Cantilever Beam [11]](https://thumb-us.123doks.com/thumbv2/123dok_us/8574454.858974/3.612.59.520.336.676/figure-a-cantilever-beam.webp)