Technology (IJRASET)
©IJRASET: All Rights are Reserved
454
Design and Analysis of Independent Suspension
System for an All-Terrain Vehicle
Himanshu Pachauri1, Dr. V. K. Saini2, Sunil Kumar3, Bhavyakant Bhardwaj4
1,4UG Students, 2Professor and Head of Department, 3Assistant Professor, Department of Mechanical Engineering
IMS Engineering College
Abstract: The study in this paper is carried out on the topic design and analysis of independent suspension system for an all-terrain vehicle. The purpose of this study is to design an independent type suspension system which can rely on any type of off-roading conditions. The focus of the study is to provide comfort to driver by reducing the effects of bumps and also improving the dynamic parameters of the vehicle. Suspension system is an important part of any vehicle, as it helps in resisting the unwanted forces so that driver feel comfortable while driving. Being a type of suspension system, independent suspension system is now most commonly used suspensions in today’s automobile industry. As the suspension system holds the weight of the whole vehicle, hence designing of it should be done carefully as it is subjected to higher stresses during its functioning condition. As the study was concerned for all-terrain vehicle hence the designing should be done so that vehicle may sustain the effects of large rocks, downed logs, bumps and mud holes etc. The designing of suspension control arms was done on solidworks whereas analysis done on ansys and simulation on lotus suspension software .hence designing and analysis of suspension system was done after getting various set of data from other functional group so that everything remains co-ordinated.
Keywords: simulation, ansys, solidworks, lotus suspension, off-roading, bumps, all-terrain.
I. INTRODUCTION
Suspension System is generally defined as the set of various mechanical linkages arranged in a manner to obtain maximum contact patch between road surface and tires. When we talk about the suspension system it means the broad subject of how the unsprung mass of a vehicle is connected to the sprung mass. These connections not only dictate the path of relative motion, they also control the forces that are transmitted between them. Suspension System helps in controlling the kinematic parameters which are responsible for dynamic behaviour of the vehicle such as Camber, Caster and Toe angles. By giving positive Caster angle, the self-returning action of Steering can be achieved and controlling other parameter leads to better dynamic behaviour of vehicle.
Negative camber angle produce higher lateral forces to improve the cornering ability of the vehicle. Moreover, Toe in angle of the wheels help in improving the straight-line stability whereas the toe-out angle help in improving the cornering stability. Hence for proper suspension travel, first the alignment and handling characteristics should be right then only suspension will work properly.
A. Literature Review
Carroll Smith [1978] explained that the geometry of any suspension system determines the linear and angular paths that the wheel and tire follow when it is displaced from its static position – either by the effect of road irregularities on the unsprung mass or by the movement of the sprung mass in response to the load transfer produced by acceleration in various planes. [1]
Jörnsen Reimpell et. ol. [2002] said that the suspension of modern vehicles need to satisfy a number of requirements whose aims partly conflict because of different operating conditions(loaded/unloaded, acceleration/braking, level/uneven road, straight running/ cornering). [2]
Thomas D. Gillespie [1992] revealed that the properties of a suspension important to the dynamics of the vehicles are primarily seen in the kinematic behaviour and its response to the forces and moments that it must transmit from the tires to chassis. In addition, other characteristics considered in design process are cost, weight, space, manufacturability, ease of assembly and others.[3]
William F. Milliken, Douglas L. Milliken [1995] said that suspension linkages are expected to position the knuckle very accurately in all directions while allowing it to move up and down against the spring shock.[4]
John C. Dixon [2007] explained that the need for suspension arises because of the roll and pitch associated with vehicle manoeuvring, and from the roughness of roads.[5]
Technology (IJRASET)
©IJRASET: All Rights are Reserved
455
The prime focus of this study is to provide a suspension system to the vehicle which can support the weight of vehicle in static condition and also improve the ride quality, stability and handling characteristics.
II. DESIGN PARAMETERS
Before designing the suspension system, some parameters are needed to be known. Hence type of independent suspension system which are going to be used in front and rear side of vehicle are –
[image:3.612.189.424.210.392.2]Front - Equal & Parallel Double Wishbone suspension system is used as it offers easy controls on the various kinematic parameters. Rear - Semi Trailing Arm is used as it produces steering effect as it passes through bump or jounce and hence generate roll understeer on rear axle.
TABLE 1. SUSPENSION PARAMETERS
S.No. Design Parameter Value
1. Wheel Base 1651 mm
2. Track Width 1371 mm
3. Total Weight 293 Kg
4. Tire Size 22*7 inch
5. CG Height 572.26 mm
6. Static Camber 0 deg.
7. Caster Angle 5 deg.
8. Ground Clearance 15 inch 9. Kingpin Inclination 0 deg.
10. Kerb Weight 223 kg
11. Kingpin Length 5 inch
12. Motion Ratio 0.7
These are some of the following design parameters which are required for designing the independent suspension system.
A. Front Suspension System
Double Wishbone suspension system was preferred as it consist of two control arms, one upper and other lower on which suspension is mounted and whole system gets attached to the chassis.
This type of suspension system is easy to manufacture as well as possess easy controlling over kinematic parameters and helps in improving the ride quality. And Equal Parallel combination helps in minimizing the camber gain in the front tires whenever vehicle goes in bump or droop.
[image:3.612.65.322.554.680.2]This type of system is connected to tires through wheel assembly which comprise of Hub, spindle and knuckle along with the Ball joints which connects control arms to the wheel assembly. To chassis side, lower control arm connected through bushings whereas upper arm is through ball joints to adjust the kinematic property.
[image:3.612.185.553.555.693.2]Technology (IJRASET)
©IJRASET: All Rights are Reserved
456
B. Rear Suspension System
Semi Trailing Arm is preferred in rear side as it provides higher strength to weight ratio as compared to double wishbone at same side.
[image:4.612.116.496.154.664.2]In this type, the camber change is constant according to the wheel travel. The suspension system is connected to chassis with the help of bushings whereas to tires with wheel assembly which comprise of hub and collar. Semi trailing arm is welded with collar so that static parameters remains same and during dynamic condition no other factors could affect the vehicle.
Fig. 3 Semi Trailing Arm
Technology (IJRASET)
©IJRASET: All Rights are Reserved
457
[image:5.612.44.554.107.395.2]Wheel Assembly of front and rear side is also designed on SOLIDWORKS v15 and shown in figure 4 and 5 respectively and these
Fig 4. Front Wheel Assembly Fig 5. Rear Wheel Assembly
are also important components of suspension system as force is first experienced by them. As soon as the designing gets completed, the various calculations comes into existence regarding the forces acting, Spring rate, roll rate, Natural frequency etc. which will be carried out in next step.
III. METHODOLOGY
Methodology in this study consist of various sets of calculation which are required during analysis of suspension system.
A. Front Axle Weight to Rear Axle Weight Ratio
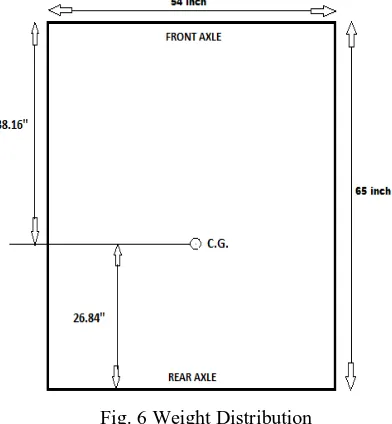
Front axle weight (FAW) and Rear Axle Weight (RAW) is needed to be calculated for obtaining the required spring rate of suspension. The total weight acting at the CG of vehicle with 70kg driver seated is 293 kg.
And the total sprung mass of the vehicle is 210.8 Kg Taking moment about rear axle-
W- Total sprung mass at CG WFR- Weight on front axle
WRR- Weight on rear axle
W*26.84 = WFR*65
WFR= (210.8*26.84)/ 65
WFR= 87.04 Kg
Hence Weight at rear axle is
WRR= W-WFR = 210.8-87.04
WRR= 123.76 kg
Technology (IJRASET)
[image:6.612.203.399.86.298.2]©IJRASET: All Rights are Reserved
458
Fig. 6 Weight Distribution
It is taken that under full bump condition the suspension are providing maximum 5” travel.
B. Force Analysis
To calculate the amount of force acting on the suspension components, two methods are used i.e.
1) Drop test is performed under which Energy Conversion took place, kinetic energy of vehicle changes into potential energy. 2) Impulse Momentum Method: Drop test is performed from a height of 6 feet, and made to fall under gravity hence energy
conversion takes place.
1
2 = ℎ
v = 2 ℎ
v = 6 m/s
Now, calculating the time taken in free falling,
= + (u=0 m/s)
t = 0.61 sec.
Applying Impulse Momentum Equation,
= ∗
F= 2879.1 N
This much amount of force will act on the vehicle when it made to free fall under gravity.
C. Spring Rate
Spring Rate is defined as amount of force required to produce a unit mm deflection in spring.
As the suspension supports the sprung mass of the vehicle, hence ratio of sprung mass on front and rear axle defines the spring rate for front and rear suspension.
Kf = Front Spring Rate
KR = Rear Spring Rate
Ff = Bump Force on front axle (2.5G force)
Technology (IJRASET)
©IJRASET: All Rights are Reserved
459
x = Maximum suspension travel
=
= 2.5∗9.81∗87.04 5∗25.4
= 16.81 N/mm
KR =
KR =
. ∗ . ∗ .
∗ .
KR = 23.9 N/mm
Rear Spring Rate is greater than front because at rear axle percentage of sprung mass is greater as compared to front hence higher stiffness is required to support the rear axle weight.
D. Sprung Mass Natural Frequency
w = sprung mass natural frequency Kf = Front Spring Rate
Kr = Rear Spring Rate K = Total Spring Rate M = Total sprung mass
It can be assumed that front and rear suspension are attached in parallel to each other. Hence the net spring rate will be K = Kf +Kr
K = 16.81 + 23.9 K = 40.71 N/mm
w = 1
2π
K M
w = 2.21
Wheel Rate
(W.R.)f – Front Wheel Rate
(W.R.)r – Rear Wheel Rate
(W.R.)f = (M.R.)2 * Kf
(W.R.)f = (0.7)2 * 16.81
(W.R.)f = 8.24 N/mm
(W.R.)r = (M.R.)2 * Kr
(W.R.)r = (0.7)2 * 23.9
(W.R.)r = 11.71 N/mm
E. Roll Rate
K∅ = Front Roll Rate
Kr = Rear Roll Rate
t = track width
K∅ =
12∗K ∗t
Technology (IJRASET)
©IJRASET: All Rights are Reserved
460
K∅ = 2865.32 lb-ft/rad
K∅ =
12∗K ∗t
2
K∅ = 4073.84 lb-ft/rad
E. Roll Gradient
W = Total weight in lbs.
H = Distance between roll axis and CG Kf = Front Roll Rate
Kr = Rear Roll Rate
∅
A =
−W∗H K∅ + K∅
∅
= . ∗ .
. .
∅
= -0.083 rad. /g
∅
A =−4.786 deg./g
Technology (IJRASET)
©IJRASET: All Rights are Reserved
461
IV. DESIGN ANALYSIS
Analysis in the given study has been carried out on ANSYS whereas suspension system stimulation has been done on LOTUS Suspension.
[image:9.612.177.414.306.653.2]In this study, analysis of all the loaded components has been done such as Control A Arm, Semi trailing arm, Front Upright, Wheel Hub etc. and the analysis parameters has been calculated initially and some parameters have been taken from other functional departments.
TABLE 2. MATERIAL SELECTED
S.No. Components Material
1 Uprights Al 6061 T6
2 Wheel Hub Al 6061 T6
3 Control Arms Stainless Steel 304 4 Semi Trailing Arm Stainless Steel 304
Materials of the components has been selected on the basis to Strength along with weight consideration. As optimization has been done to reduce the weight of components by not sacrificing its strength, and which leads to reduction in unsprung mass and better suspension travel.
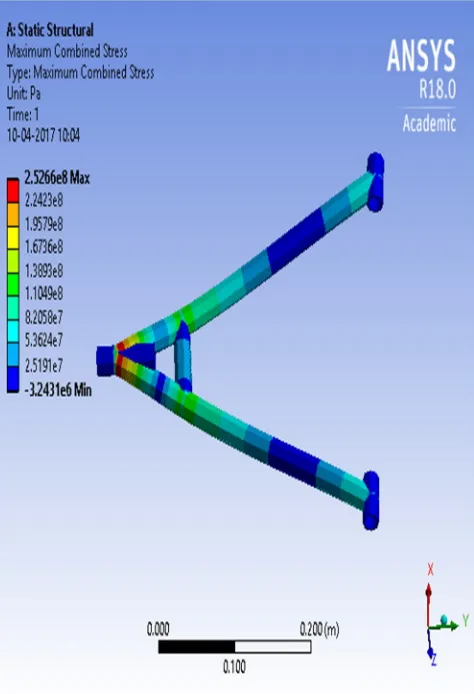
Fig. 8 Lower Control Arm Stress Analysis
Technology (IJRASET)
©IJRASET: All Rights are Reserved
462
[image:10.612.62.573.81.209.2] [image:10.612.59.573.249.404.2]
Fig. 9 Semi Trailing Arm Stress Analysis Fig. 10 Front Wheel Hub Stress Analysis
Fig. 11 Front Upright Stress Analysis Fig. 12 Semi Trailing Arm Deformation
From the analysis report, it has been seen that maximum stress which generated is 58.58 MPa whereas maximum yield stress of Al 6061 T6 is 2.07e8. Hence design is safe as we are getting good factor of safety.
Same process is used for analysis of front upright and the output result which comes out was also satisfying as maximum stress developed is 1.52e08 which is less than the yield stress of the material.
From the above analysis results, it could be noticed that the maximum combined stress concentration in control arm is still less than the yield stress of pipe material. Hence, the design is safe on applied forces.
[image:10.612.79.563.578.705.2] [image:10.612.42.294.579.703.2]After completing the analysis of all the load bearing parts, now stimulation of suspension system is needed to be done on LOTUS Suspension software. After performing stimulation, various sets of results has been observed such as camber change graph, isometric view etc.
Technology (IJRASET)
[image:11.612.165.446.91.243.2]©IJRASET: All Rights are Reserved
463
Fig. 15 Isometric view of Suspension System
After performing opposed bumps, rolling and steering stimulation, following test results were observed.
[image:11.612.315.570.294.439.2] [image:11.612.41.295.296.441.2]
Fig. 16 Camber Change Graph Fig. 17 Toe Angle Variation Graph
Following results were obtained when the whole suspension system stimulated under given constraints which has been given during the stimulation process. These results shows that how the suspension system perform when it will be tested under real Off-roading conditions.
V. CONCLUSION
The conclusion of this study has been carried out on the basis of results obtained from the various analysis and stimulations. There were various factors which were helping the vehicle in enhancing its stability and also analysis of various loaded parts shows that design considerations which were taken during designing holds correct values and all the components can sustain the variable load during dynamic condition. The various values which were obtained such as maximum permissible stress and deformation are under the yield stress of material hence it can be concluded that design is safe.
In this study, we have calculated the various aspects of vehicle dynamics such as wheel rate, roll rate, spring stiffness, roll gradient etc. which are helpful during the stimulation process. And some assumptions also been taken during the calculations which are based on SAE standards. From the study it has been concluded that suspension system is resisting all types of bump forces so that ride quality does not affected and driver’s comfort also not exhausted.
VI. ACKNOWLEDGEMENT
Technology (IJRASET)
©IJRASET: All Rights are Reserved
464
towards all the Professors of Mechanical Engineering Department for offering continuous support and guidance towards the authors.
REFERENCES [1] Carroll Smith [1978] Tune to win, Aero Publisher, Inc. ISBN 0-87938-071-3.
[2] Reimpell, H., Stoll, H. and Betzler, J. W. (2002). The Automotive Chassis: Engineering Principles. Butterworth Heinemann, Oxford. ISBN 0-7506-5054-0 [3] Thomas D. Gillespie [1992] Fundamentals of Vehicle Dynamics, Society of Automotive Engineers, Inc.
[4] William F. Milliken, Douglas L. Milliken, (1995). Race Car Vehicle Dynamics. Published by sae International