M E T H O D
Open Access
Evaluation of
de novo
transcriptome
assemblies from RNA-Seq data
Bo Li
1†, Nathanael Fillmore
2†, Yongsheng Bai
3, Mike Collins
4, James A Thomson
4,5,6, Ron Stewart
4and Colin N Dewey
2,7*Abstract
De novoRNA-Seq assembly facilitates the study of transcriptomes for species without sequenced genomes, but it is challenging to select the most accurate assembly in this context. To address this challenge, we developed a model-based score, RSEM-EVAL, for evaluating assemblies when the ground truth is unknown. We show that
RSEM-EVAL correctly reflects assembly accuracy, as measured by REF-EVAL, a refined set of ground-truth-based scores that we also developed. Guided by RSEM-EVAL, we assembled the transcriptome of the regenerating axolotl limb; this assembly compares favorably to a previous assembly. A software package implementing our methods, DETONATE, is freely available at http://deweylab.biostat.wisc.edu/detonate.
Background
RNA sequencing (RNA-Seq) technology is revolution-izing the study of species that have not yet had their genomes sequenced by enabling the large-scale analysis of their transcriptomes. To study such transcriptomes, one must first determine a set of transcript sequences via
de novotranscriptome assembly, which is the reconstruc-tion of transcript sequences from RNA-Seq reads without the aid of genome sequence information. A number of
de novotranscriptome assemblers are currently available, many designed for Illumina platform data [1-8] and others targeted for Roche 454 Life Science platform data [9-12]. These assemblers, combined with their often sizable sets of user-tunable parameters, enable the generation of a large space of candidate assemblies for a single data set. However, appropriately evaluating the accuracy of assem-blies in this space, particularly when the ground truth is unknown, has remained challenging.
A number of studies have been devoted to the evalua-tion ofde novotranscriptome assemblies [13-20]. Assem-bly evaluation measures used in such studies can be
*Correspondence: [email protected] †Equal contributors
2Department of Computer Sciences, University of Wisconsin, Madison, WI 53706, USA
7Department of Biostatistics and Medical Informatics, University of Wisconsin, Madison, WI 53706, USA
Full list of author information is available at the end of the article
grouped into two classes: based and reference-free. Reference-based measures are those that are com-puted using previously known sequences. For example, after establishing a correspondence between assembly ele-ments and a reference transcript set, one can calculate the fraction of assembly elements that accurately match a reference transcript (precision), the fraction of refer-ence transcripts that are matched by assembly elements (recall), or a combination of these two (e.g., theF1 mea-sure) [5,16,17]. In addition to transcript sets, genome and protein sequences can also be used as references for assembly evaluation [2,4,8,13,15,20].
However, in most cases where de novo assembly is
of interest, reference sequences are either not available, incomplete or considerably diverged from the ground truth of a sample of interest, which makes the assembly evaluation task markedly more difficult. In such cases, one must resort to reference-free measures. Commonly used reference-free measures include median contig length, number of contigs and N50 [13,16,17]. Unfortunately, these measures are primitive and often misleading [20]. For example, N50, one of the most popular reference-free measures, can be maximized by trivial assemblies. N50 is defined as the length of the longest contig such that all contigs of at least that length compose at least 50% of the bases of the assembly [21]. The motivation for this measure is that better assemblies will result from a larger number of identified overlaps between the input
mative when assemblies include singletons (i.e., contigs derived from single reads) [20].
We improve upon the state-of-the-art in transcrip-tome assembly evaluation by presenting the DETONATE
methodology (DE novo TranscriptOme rNa-seq
Assem-bly with or without the Truth Evaluation) and software package. DETONATE consists of two components: RSEM-EVAL and REF-EVAL. RSEM-EVAL, DETONATE’s primary contribution, is a reference-free evaluation method based on a novel probabilistic model that depends only on an assembly and the RNA-Seq reads used to construct it. RSEM-EVAL is similar to recent approaches using statistical models to evaluate or construct genome [23] and metagenome [24,25] assemblies, but, as we will discuss, is necessarily more complex because of widely varying abundances of transcripts and alternative splic-ing. Unlike simplistic reference-free measures such as N50, RSEM-EVAL combines multiple factors, including the compactness of an assembly and the support of the assembly from the RNA-Seq data, into a single, statisti-cally principled evaluation score. This score can be used to select a best assembler, optimize an assembler’s param-eters and guide new assembler design as an objective function. In addition, for each contig within an assembly, RSEM-EVAL provides a score that assesses how well that contig is supported by the RNA-Seq data and can be used to filter unnecessary contigs. REF-EVAL, DETONATE’s second component, is a toolkit of reference-based mea-sures. It provides a more refined view of an assembly’s accuracy than existing reference-based measures.
We have performed a number of experiments on both real and simulated data to demonstrate the value of the RSEM-EVAL score. First, we generated a set of per-turbed assemblies around a single true assembly, and we show that RSEM-EVAL ranks the truth among the highest-scoring assemblies. Second, we computed RSEM-EVAL scores and REF-RSEM-EVAL reference-based measures on over 200 assemblies for multiple data sets, and we find that the RSEM-EVAL score generally correlates well with reference-based measures. The results of these first two experiments together show that the RSEM-EVAL score accurately evaluates de novo transcriptome assemblies, despite not having knowledge of the ground truth. Third, in comparison with several alternative reference-free and comparative-reference-based measures, we demonstrate the advantages of RSEM-EVAL in terms of accuracy,
Results
DETONATE: a software package for the evaluation ofde novotranscriptome assemblies
The main contribution of our work is DETONATE,
a methodology for the evaluation of de novo
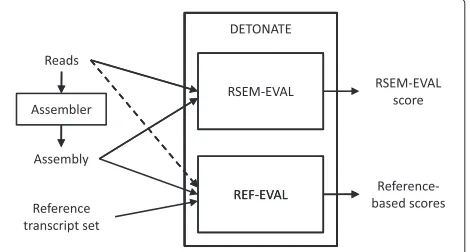
[image:2.595.306.541.478.604.2]tran-scriptome assemblies and a software package that real-izes this methodology. DETONATE consists of two components: RSEM-EVAL, which does not require a ground truth reference, and REF-EVAL, which does. The high-level workflow of DETONATE is shown in Figure 1. In the following subsections, we (1) describe the RSEM-EVAL reference-free score and show that the true assembly is an approximate local maximum of this score, (2) describe the REF-EVAL reference-based scores and show that RSEM-EVAL’s score correlates well with these measures, indicating that RSEM-EVAL reflects the accuracy of a transcriptome assembly, and (3) demonstrate our methods’ practical usefulness by assembling the transcriptome of the regenerating axolotl limb with the guidance of RSEM-EVAL. To understand the components of DETONATE and the experiments we have performed with them best, we first define
what is considered to be the true assembly of a set of RNA-Seq reads, which is critical to the assembly evalua-tion task.
The true assembly according to DETONATE
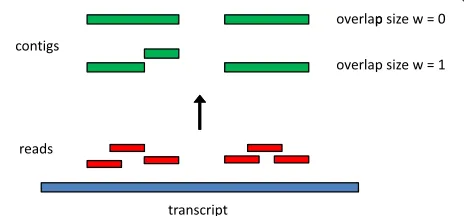
Ideally, the goal of transcriptome assembly would be to construct the full-length sequences of all transcripts in the transcriptome. Unfortunately, it is rarely possible to achieve this goal in practice, because sequencing depths are usually not high enough to cover all transcripts com-pletely, especially those of low abundance. Thus, a tran-scriptome assembly is, in general, a set of contigs, with each contig representing the sequence of a segment of a transcript. When paired-end data are assembled, one can also consider constructingscaffolds, or chains of contigs separated by unknown sequences with estimated lengths. Both RSEM-EVAL and REF-EVAL make use of the con-cept of the true assembly of a set of RNA-Seq reads, which is the assembly one would construct if given knowledge of the true origin of each read. A precise definition of the true assembly is provided in the Materials and methods. Intuitively, for each non-negative integerw, the true contig assembly at minimum overlap lengthwis the collection of transcript subsequences that are covered by reads whose true alignments overlap by at leastwbases. The true con-tig assembly at minimum overlap length 0 is the collection of transcript subsequences covered by reads whose true alignments are contiguous (that is, overlap by zero bases) or overlap by at least one base. The true contig assembly at minimum overlap length 0 is the best theoretically achiev-able contig assembly in that it represents all supported segments of the transcript sequences, and no unsupported segments. Figure 2 gives an example of true contig
assem-blies at minimum overlap lengths w = 0 and w = 1.
[image:3.595.59.291.542.650.2]With paired-end data, the true assembly is the set of scaf-folds that one would obtain by scaffolding the true contig
Figure 2Example construction of true assemblies with different minimum overlap lengths.Six reads (red) are positioned at their true places of origin along one transcript (blue). The assembly with minimum overlap lengthw=0 consists of two contigs (green). For w=1, the assembly instead consists of three contigs because the second and third reads from the left are immediately adjacent but not overlapping.
assembly with complete knowledge of which contigs are linked by a read pair and the distances between contigs.
RSEM-EVAL is a novel reference-free transcriptome assembly evaluation measure
RSEM-EVAL, our primary contribution, is a reference-free evaluation measure based on a novel probabilistic model that depends only on an assembly and the RNA-Seq reads used to construct it. In short, the RSEM-EVAL score of an assembly is defined as the log joint probabil-ity of the assemblyAand the readsDused to construct it, under a model that we have devised. In symbols:
scoreRSEM-EVAL(A)=logP(A,D)
RSEM-EVAL’s intended use is to compare several assemblies of the same set of reads, and under this sce-nario, the joint probability is proportional to the posterior probability of the assembly given the reads. Although the posterior probability of the assembly given the reads is a more natural measure for this application, we use the joint probability because it is more efficient to compute.
The details of the RSEM-EVAL model are provided in the Materials and methods. In summary, the RSEM-EVAL score consists of three components: a likelihood, an assembly prior and a Bayesian information criterion (BIC) penalty. That is:
logP(A,D) = log
P(D|A,)P(A|)P()d ≈ log P(D|A,MLE)
likelihood
+log P(A|MLE) assembly prior
−1
2(M+1)logN
BIC penalty
, (1)
where N is the total number of reads (or read pairs,
for paired-end data), Mis the number of contigs (scaf-folds) in the assembly, andMLEis the maximum likeli-hood (ML) estimate of the expected read coverage under
space of assemblies and shown that the RSEM-EVAL score for the ground truth assembly is among the highest scores. However, such a global search of assembly space is com-putationally infeasible. Thus, we instead performed exper-iments that assess whether in the local space around the ground truth, the ground truth is among the best scoring assemblies. In other words, we tested whether the ground truth assembly is approximately alocal maximumof the RSEM-EVAL function.
We explored the local space of assemblies around that of the ground truth by generating assemblies that were slightly perturbed from it. We performed experiments with two kinds of perturbations: random perturbations and guided perturbations. In our random perturbation experiments, assemblies were generated by randomly mutating the ground truth assembly. Since the minimum overlap length is a critical parameter for constructing assemblies, we also assessed the RSEM-EVAL scores for true assemblies with different minimum overlap lengths in guided perturbation experiments. A good evaluation score should generally prefer true assemblies with small minimum overlap lengths, which are closest to the ground truth.
For these experiments, it was critical that the ground truth assembly be known, and therefore we primarily used a simulated set of RNA-Seq data, in which the true origin of each read is known. In addition, for our guided pertur-bation experiments, we used the real mouse data set on which the simulated data were based, and we estimated the true origin of each read. For details about these real and simulated data, see the Materials and methods.
Random perturbation
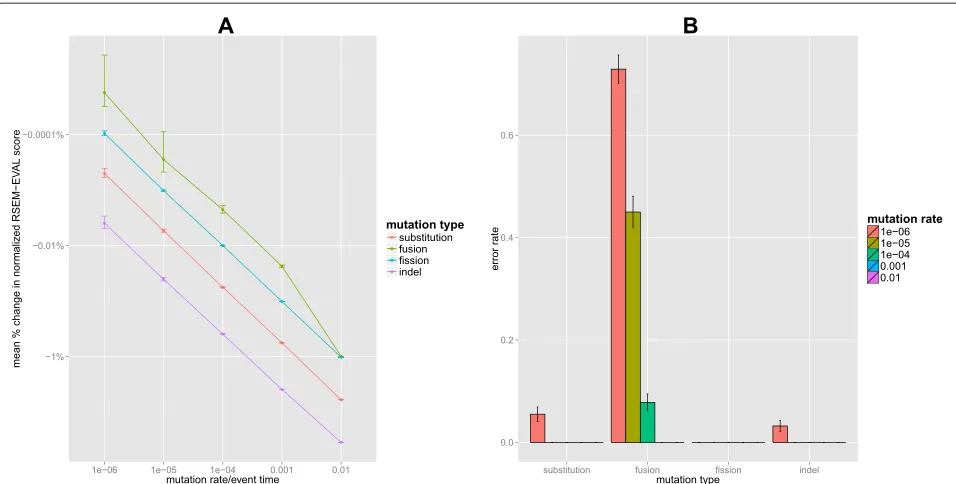
With our random perturbation experiment we wished to determine how well, in terms of the RSEM-EVAL score, the ground truth compares to assemblies in the local space surrounding it. To explore the space of assem-blies centered at the ground truth thoroughly, we used four types of mutations (substitution, fusion, fission and indels), each of which was applied at five different strength levels (see Materials and methods). Therefore, in total, we generated 20 classes of randomly perturbed assem-blies. For each class, we generated 1,000 independent ran-domly perturbed assemblies to estimate the RSEM-EVAL score population mean and its 95% confidence interval for assemblies of that class.
score of the ground truth, individual perturbed assem-blies could have had higher scores. Therefore, for each class of perturbed assemblies, we calculated the fraction of assemblies with RSEM-EVAL scores larger than that of the ground truth, which we refer to as theerror rate. Error rates decreased dramatically with increasing muta-tion strength and, for all mutamuta-tion types except fusion, error rates were only non-zero for the weakest muta-tion strength level (Figure 3B). RSEM-EVAL had the most trouble with the fusion-perturbed assemblies, with more than half of such assemblies at the weakest mutation strength having a score above that of the ground truth. From individual examinations of these assemblies, we observed that in many of these cases, the assemblies con-tained fusions of contigs with low abundances, which are difficult to distinguish from true contigs, especially with the ground truth defined as the true assembly with
minimum overlap lengthw=0.
Guided perturbation
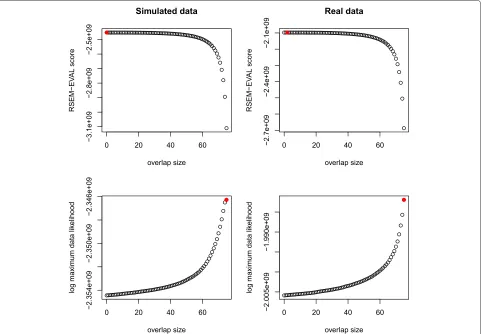
With the guided perturbation experiments, we measured the RSEM-EVAL scores of assemblies constructed with different values of the minimum overlap length, which is a common parameter in assemblers. Since the true assem-bly at minimum overlap length 0 is the best achievable assembly, a good evaluation score should be maximized at small minimum overlap lengths. As described before, we used one simulated and one real mouse RNA-Seq data set for these experiments. For each data set, we constructed the true assemblies with minimum overlap lengths rang-ing from 0 to 75. The true assembly at minimum overlap length 76 (the read length) was not constructed because of prohibitive running times. For the real RNA-Seq data, true assemblies were estimated using REF-EVAL’s procedure, described below. We then calculated the RSEM-EVAL scores for all of these assemblies.
As we had hoped, we found that the RSEM-EVAL score was maximized at small minimum overlap lengths, for both the simulated and real data sets (Figure 4). In con-trast, the ML score increased with minimum overlap
length and peaked at minimum overlap length w = 75.
These results support the necessity of the prior of the RSEM-EVAL model, which takes into account the com-plexity of an assembly.
To explore the effects of the minimum overlap length
per-Figure 3Random perturbation results.Comparison of the RSEM-EVAL score of the ground truth assembly to those of randomly perturbed versions of that assembly.(A)Changes in the relative scores of the perturbed assemblies with increasing mutation strength. For each class of perturbed assemblies, we computed the mean percentage change in the normalized RSEM-EVAL score for the 1,000 randomly perturbed assemblies in that class. The normalized RSEM-EVAL score is the RSEM-EVAL score of the assembly minus the RSEM-EVAL score one would obtain for the null assembly with no contigs and is useful when positive scores are necessary. For each mutation type, the normalized RSEM-EVAL score is plotted as a function of the mutation strength, with error bars corresponding to 95% confidence intervals.(B)RSEM-EVAL error rates for each perturbed assembly class. Error bars correspond to the 95% confidence intervals for the mean error rates.
formed the guided perturbation experiments withw=50 for the RSEM-EVAL model. We did not observe any major
differences between these results and those for w = 0
(Additional file 1: Figures S3 and S4). To explain this
result, note that although the RSEM-EVAL model usesw
in both the prior and likelihood correction components, our estimation procedure for the uncorrected likelihood component (see Materials and methods) does not explic-itly check for violations of the minimum overlap length by the assembly (i.e., regions that are not covered by reads that overlap each other by at leastwbases). Thus, the minimum overlap length does not play a role in the uncorrected likelihood, which is the dominant term of the RSEM-EVAL score.
REF-EVAL is a refined toolset for computing reference-based evaluation measures
Our first experiment, above, shows that RSEM-EVAL has an approximate local maximum at the true assembly. However, this does not necessarily imply that RSEM-EVAL induces a useful ranking of assemblies away from this local maximum. Thus, to assess the usefulness of RSEM-EVAL’s reference-free score, it is of interest to compare the ranking RSEM-EVAL assigns to a collec-tion of assemblies to the ranking assigned by comparing
each assembly to a reference. This raises two questions: (1) What reference do we compare against? (2) How do we perform the comparison? REF-EVAL constitutes an answer to both questions. The tools REF-EVAL pro-vides are also of independent interest for reference-based evaluation of transcriptome assemblies.
In answer to question (1), REF-EVAL provides a method to estimate the true assembly of a set of reads, relative to a collection of full-length reference transcript sequences. The estimate is based on alignments of reads to reference transcripts, as described in the Materials and methods. As we have previously discussed, we wish to compare assem-blies against the set of true contigs or scaffolds instead of full-length reference sequences because the latter cannot, in general, be fully reconstructed from the data and we want to reward assemblies for recovering read-supported subsequences of the references.
[image:5.595.59.537.86.328.2]Figure 4Guided perturbation results.RSEM-EVAL (top row) and maximum likelihood (bottom row) scores of true assemblies for different values of the minimum overlap lengthwon both simulated (left column) and real (right column) data sets. The maximizing values (red circles) are achieved atw=0,w=2,w=75 andw=75 in a top-down, left-right order. For better visualization of the maximizing values ofw, RSEM-EVAL scores for the local regions around the maximal values are shown in Additional file 1: Figure S2.
the harmonic mean of recall and precision. For precise definitions and computational details, see Materials and methods.
[image:6.595.305.540.494.632.2]Although the contig- (scaffold-) and nucleotide-level measures are straightforward and intuitive, both have drawbacks and the two measures can be quite dissim-ilar (Figure 5). For example, if two contigs align per-fectly to a single reference sequence, but neither covers at least 99% of that sequence, the nucleotide-level mea-sure will count them as correct, whereas the contig-level measure will not (Figure 5B). In general, the contig-and scaffold-level measurements can fail to give a fair assessment of an assembly’s overall quality, since they use very stringent criteria and normally only a small fraction of the reference sequences are correctly recov-ered. And whereas the nucleotide-level measure arguably gives a more detailed picture of an assembly’s qual-ity, it fails to take into account connectivity between nucleotides. For example, in the example depicted in Figure 5B, the nucleotide-level measure does not take into account the fact that the correctly predicted nucleotides
of the reference sequence are predicted by two different contigs.
Motivated, in part, by the shortcomings of the contig-, scaffold-, and nucleotide-level measures, REF-EVAL also provides a novel transcriptome assembly reference-based
accuracy measure, the k-mer compression score (KC
score). In devising the KC score, our goals were to define a measure that would (1) address some of the limitations of the other measures, (2) provide further intuition for what the RSEM-EVAL score optimizes and (3) be relatively sim-ple. The KC score is a combination of two measures,
weightedk-mer recall (WKR) and inverse compression
rate (ICR), and is simply defined as:
scoreKC=WKR−ICR (2)
WKR measures the fidelity with which a particular
assembly represents the k-mer content of the reference sequences. Balancing WKR, ICR measures the degree
to which the assembly compresses the RNA-Seq data.
WKR and ICR are defined and further motivated in the Materials and methods.
The RSEM-EVAL score correlates highly with reference-based measures
Having specified a framework for reference-based tran-scriptome assembly evaluation via REF-EVAL, we then sought to test whether the RSEM-EVAL score ranks assemblies similarly to REF-EVAL’s reference-based mea-sures. To test this, we constructed a large number of assemblies on several RNA-Seq data sets from organ-isms for which reference transcript sequences were avail-able, and we computed both the RSEM-EVAL score and reference-based measures for each assembly. The RNA-Seq data sets used were the simulated and real mouse strand non-specific data from the perturbation experi-ments, a real strand-specific mouse data set and a real strand-specific yeast data set. Four publicly available assemblers, Trinity [4], Oases [6], SOAPdenovo-Trans [8] and Trans-ABySS [2], were applied to assemble these data sets using a wide variety of parameter settings.
Overall correlation
For each data set, we computed Spearman’s rank corre-lation between the reference-based measure values and the RSEM-EVAL scores to measure the similarity of the rankings implied by them. For single-end data, RSEM-EVAL scores had decent correlation with the contig and nucleotide-levelF1measures on the strand non-specific (Figure 6) and strand-specific (Additional file 1: Figure S5) data sets. Specifically, the correlation of the con-tig and nucleotide-levelF1measures to the RSEM-EVAL score is comparable to the correlation of the contig and nucleotide-levelF1measures to each other. RSEM-EVAL
performed similarly well on the paired-end strand non-specific data set (Additional file 1: Figure S6).
The RSEM-EVAL scores had markedly higher correla-tions with the KC score (k = L, the read length) for both the strand non-specific (Figure 7) and strand-specific (Additional file 1: Figure S7) single-end data sets, as well as for the paired-end data set (Additional file 1: Figure S6), which confirmed our expectations given the mathematical connections between these scores. To assess the impact of thek-mer size on the KC score, we also computed corre-lations between the RSEM-EVAL score and the KC score at half (k = 36) and double (k = 152) the read length for the strand non-specific single-end data. We found that these correlation values were not sensitive to the value ofk(Additional file 1: Figures S8 and S9). These results provide some intuition for what the RSEM-EVAL score assesses and indicate that the RSEM-EVAL score could be used as a proxy for the KC score when reference sequences are not known.
Although this experiment was not designed as a com-prehensive evaluation, some features of these results are suggestive of the relative accuracies of the assemblers. First, given the selected assembler versions and parameter settings, Trinity produced the most accurate assemblies for all data sets with respect to the contig-,
scaffold-and nucleotide-level F1 scores and the KC score. The
RSEM-EVAL score supported this result, with the Trinity assemblies also obtaining the highest RSEM-EVAL scores. Second, varying the Trinity parameters had a relatively small effect on the accuracy of the resulting assemblies, compared to Oases and SOAPdenovo-Trans, which pro-duced assemblies that spanned a large range of accuracies. From the assemblies of the mouse strand non-specific single-end data produced by the assemblers with their default parameters, we identified a case that exemplifies Trinity’s accuracy and demonstrates how RSEM-EVAL selects the best assembly (Figure 8).
Comparison to other measures
Figure 6Correlation of RSEM-EVAL score with reference-based measures for strand non-specific single-end data sets.Scatter plots are shown for the simulated (top row) and real mouse (bottom row) data sets and for both the nucleotide-levelF1(left column) and contig-levelF1
(center column) measures. For comparison, scatter plots of the nucleotide-levelF1against the contig-levelF1are shown (right column). Spearman’s
rank correlation coefficient (bottom-right corner of each plot) was computed for each combination of data set and reference-based measure.
set from a closely related species is available: the ortholog hit ratio [26] and the number of unique pro-teins matched by assembly elements, both of which were determined to be effective for transcriptome assembly evaluation [20].
Because some of these measures were computationally costly to compute, we evaluated them with a smaller data set than that used in the previous section. Specifically, we used the set of reads from the real mouse strand non-specific single-end data set that mapped to genes on
[image:8.595.56.540.538.703.2]Figure 8RSEM-EVAL correctly selects the Trinity assembly of reads originating from a transcript of mouse geneRpl24as the best among the default assemblies from Trinity, Oases and SOAPdenovo-Trans.Reads from the mouse strand non-specific single-end data set aligning to transcript 1 ofRpl24were extracted and assembled by Trinity, Oases and SOAPdenovo-Trans with default parameters. Contigs (filled rectangles) from each assembly were aligned against the true transcript with BLAT to establish their positional identities (blue-yellow fill, with only the segment of a contig from its highest-scoring local alignment shown). RSEM-EVAL was run on each assembly and the likelihood, prior, BIC and total
RSEM-EVAL scores were recorded. Although the SOAPdenovo-Trans assembly was smaller (as reflected by the higher prior score), the Trinity assembly had a much higher likelihood score, which is generally the dominant term in the RSEM-EVAL score, and was thus correctly selected as the most accurate assembly. BIC, Bayesian information criterion.
chromosome 1. As in the previous section, we assembled these reads with a variety of assemblers and parameter settings and computed the selected set of measures along with the RSEM-EVAL and REF-EVAL measures on the resulting assemblies.
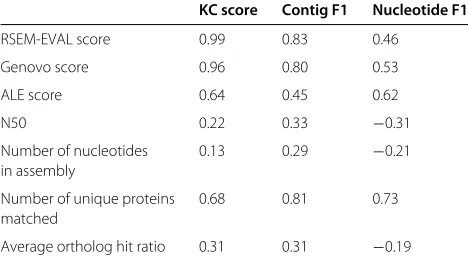
In terms of Spearman’s rank correlation, RSEM-EVAL outperformed all other measures with respect to the contig-level F1 and KC scores, but had lower correla-tion with the nucleotide-levelF1score than the Genovo, ALE and number of unique proteins matched mea-sures (Table 1, Additional file 1: Figures S10 and S11).
Table 1 Spearman’s rank correlation coefficient of the scores assigned by several alternative transcriptome assembly evaluation measures to the reference-based scores from REF-EVAL
KC score Contig F1 Nucleotide F1
RSEM-EVAL score 0.99 0.83 0.46
Genovo score 0.96 0.80 0.53
ALE score 0.64 0.45 0.62
N50 0.22 0.33 −0.31
Number of nucleotides 0.13 0.29 −0.21 in assembly
Number of unique proteins 0.68 0.81 0.73 matched
Average ortholog hit ratio 0.31 0.31 −0.19
The alternative measures are defined in the main text. The evaluated assemblies were produced by Trinity, Oases, SOAPdenovo-Trans and Trans-ABySS, based on the subset of reads in the real (strand non-specific) mouse data that align to genes on chromosome 1. This subset was used in the interest of computational efficiency of the alternative measures.
KC score,k-mer compression score.
RSEM-EVAL, Genovo and ALE were the only reference-free measures to have positive correlations with respect to all three REF-EVAL measures. N50 and the number of bases in contigs measures had negative correlation with the nucleotide-levelF1score and positive but poor correlation with the other REF-EVAL measures. Unsur-prisingly, because of the similarity of the models used by RSEM-EVAL and Genovo, the scores produced by the two methods were also similar (Additional file 1: Figure S10). Although ALE is also a model-based reference-free measure, it had noticeably different behavior from RSEM-EVAL and Genovo, particularly for the Oases assemblies, which were generally larger than the other assemblies. Of the two comparative-reference-based measures, the num-ber of unique proteins matched measure performed best, achieving good correlation with all REF-EVAL measures and the highest correlation (0.73) with the nucleotide-level F1 score. The ortholog hit ratio measure did not fare as well and, in fact, had negative correlation with the nucleotide-levelF1score.
[image:9.595.57.291.549.679.2]Figure 9Example scenario in which RSEM-EVAL correctly selects the true assembly whereas Genovo and ALE select suboptimal assemblies.Because Genovo and ALE do not explicitly take into account transcript abundance and read mapping uncertainty, scenarios in which multiple isoforms of the same gene are present in an RNA-Seq sample can confuse these methods. In this example, a gene has two isoforms, the first isoform (with a length of 1,000 bases) corresponding to the first half of the second isoform (with a length of 2,000 bases). We simulated 5,000 single-end RNA-Seq reads of length 100 bases with 0.01% sequencing error from these transcripts and with a 90 : 10 abundance ratio between the first and second isoforms, respectively. Because RSEM-EVAL models transcript abundances and takes into account read mapping uncertainty, it correctly scores the true assembly the highest. In contrast, Genovo selects the assembly containing only the long isoform and ALE selects the assembly containing only the short isoform.
Second, we measured the runtime and memory usage of each of these software packages on the full mouse strand non-specific single-end data set and found that RSEM-EVAL is substantially faster than both Genovo and ALE, which have arguably prohibitive runtimes for this realis-tic data set (Table 2). Lastly, RSEM-EVAL and ALE have richer models than Genovo, both supporting paired-end data, quality scores and strand specificity.
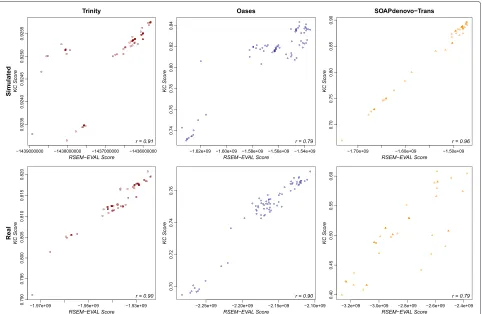
Within-assembler correlation
One important potential application of RSEM-EVAL is the optimization of the parameters of an assembler. Thus, it is of interest whether the RSEM-EVAL score correlates well with reference-based measures for assemblies gener-ated by a single assembler. In a previous subsection, we showed that the RSEM-EVAL score has high correlation
with the KC score for real and simulated data when several different assemblers are used. Looking at each assem-bler separately, we also find that the RSEM-EVAL score has high correlation with the KC score when only the assembler’s parameters are changed, for both strand non-specific (Figure 10) and strand-non-specific (Additional file 1: Figure S12) single-end data sets, as well as for the paired-end data set (Additional file 1: Figure S13). This suggests that RSEM-EVAL can be used to optimize the parameters of an assembler for a given data set when the KC score is of interest for measuring the accuracy of an assembly.
Assessing the relative impact of individual contigs or scaffolds within an assembly
[image:10.595.58.539.522.662.2]The RSEM-EVAL score is an assembly-level measure that allows one to compare different assemblies constructed
Table 2 Wall-clock runtimes (in hours, minutes and seconds) and memory usage (as measured by the maximum resident set size, in gigabytes) for several assembly evaluation tools
Assembly T Assembly O Assembly S
Program Runtime Memory Runtime Memory Runtime Memory
RSEM-EVALa 1 h 4 m 57 s 2.02 GB 4 h 40 m 36 s 8.18 GB 34 m 57 s 1.23 GB
Genovo 6 d 11 h 54 m 3 s 192.23 GB >1 week – 4 d 15 h 3 m 3 s 188.79 GB
ALEa 12 h 39 m 36 s 0.67 GB 6 d 23 h 23 m 13 s 2.31 GB 7 h 33 m 1 s 0.59 GB
REF-EVAL, contigb 3 s 0.19 GB 8 s 0.33 GB 2 s 0.2 GB
REF-EVAL, nucleotideb 8 s 0.39 GB 33 s 1.27 GB 6 s 0.33 GB
REF-EVAL, KC score 1 m 18 s 2.09 GB 1 m 30 s 2.37 GB 1 m 13 s 2.03 GB
Bowtie 15 m 42 s 0.11 GB 1 h 1 m 38 s 0.31 GB 11 m 16 s 0.1 GB
BLAT 35 m 14 s 0.0 GB 1 h 51 m 1 s 0.01 GB 28 m 19 s 0.0 GB
aPlus time to run Bowtie. We calculate Bowtie statistics separately because ALE takes Bowtie alignments as input. bPlus time to run BLAT.
Each tool was run on three different assemblies of the real mouse data. Assembly T was produced by Trinity with its default parameters (52,667 contigs, 33 million nucleotides). Assembly O was produced by Oases with its default parameters (160,455 contigs, 115 million nucleotides). Assembly S was produced by
SOAPdenovo-Trans with its default parameters (79,460 contigs, 28 million nucleotides). Multithreaded programs (RSEM-EVAL, REF-EVAL and Bowtie) were run with 16 threads. All programs were run on a compute server with an Intel® Xeon® CPU E5-2660 v2 2.20 GHz processor and 500 gigabytes RAM. Genovo had not finished running on assembly O after more than 1 week.
Figure 10Within-assembler correlation of the RSEM-EVAL and KC scores on the strand non-specific single-end data sets.Scatter plots are shown for the simulated (top row) and real mouse (bottom row) data sets and for the Trinity (left column), Oases (center column) and
SOAPdenovo-Trans (right column) assemblers. Trans-ABySS was omitted because it had only one assembly. Spearman’s rank correlation coefficient (bottom-right corner of each plot) was computed for each combination of data set and assembler.
KC score,k-mer compression score.
from the same data set. It is also of interest to compute scores for individual contigs or scaffolds within an assem-bly that reflect their relative impacts. In this section we describe and assess a contig-level score based on RSEM-EVAL for single-end data. RSEM-RSEM-EVAL can analogously produce scaffold-level scores when paired-end data are available.
One natural statistical approach for assessing the explanatory power of a contig is to compare the hypoth-esis that a particular contig is a true contig with the null hypothesis that the reads composing the contig are actually from the background noise. For each contig, we use the log of the ratio between the probabilities for these two hypotheses as itscontig impact score. Through a decomposition of the RSEM-EVAL score logP(A,D)
into contig-level components, we are able to calculate these contig impact scores efficiently (Additional file 1: Section 5).
RSEM-EVAL’s contig impact score measures the relative contribution of each contig to explaining the assembled RNA-Seq data. This suggests a strategy to improve the
accuracy of an assembly: trim it by removing contigs that contribute little to explaining the data. To evaluate this strategy (and by extension the contig impact score itself ), we trimmed assemblies of the simulated data using the RSEM-EVAL contig impact scores and computed the resulting changes in the evaluation measures. Assem-blies were trimmed by removing all contigs with negative scores.
In general, the trimmed assemblies had better eval-uation scores than their untrimmed counterparts (Additional file 1: Table S2 and Figure S14). The largest improvements were seen for assemblies produced by Oases and Trans-ABySS, which tend to produce large numbers of contigs. In fact, for both the
nucleotide-and contig-level F1 scores, the trimmed Oases
as a result, it has not yet been sequenced. In addition, a publicly available, complete and high-quality set of axolotl transcript sequences does not exist, which makes it chal-lenging to study the axolotl’s transcriptome.
To demonstrate the use of RSEM-EVAL, we employed it to select an assembler and parameter values for a set of previously published RNA-Seq data from a time-course study of the regenerating axolotl limb blastema [27]. This data set consisted of samples taken at 0 hours, 3 hours, 6 hours, 12 hours, 1 day, 3 days, 5 days, 7 days, 10 days, 14 days, 21 days and 28 days after the start of regeneration and had a total of 345,702,776 strand non-specific single-end reads. Because of the large size of this data set and our goal of testing many different assemblers and param-eter settings, we first restricted our analysis to data from three of the time points (6 hours, 14 days and 28 days), which made up a total of 55,559,405 reads. We ran Trinity, Oases and SOAPdenovo-Trans on these data to produce
EVAL score for this data set, we instead used alignments of the assembly contigs to the known protein sequences of the frog species Xenopus tropicalis. Specifically, we aligned the assemblies against the frog protein sequences with BLASTX [28] and calculated the number of frog pro-teins that were recovered to various percentages of length by an axolotl contig (Additional file 1: Section 9). We found that, in general, the assemblies with higher RSEM-EVAL scores were those that were also considered better by comparison with theXenopusprotein set (Figure 11). Thus, the RSEM-EVAL score appears to be selecting the highest-quality axolotl assemblies.
We then pooled all time points of the time course and built an assembly using the assembler
(Trin-ity) and parameter set (--glue_factor 0.01
[image:12.595.59.539.420.684.2]--min_iso_ratio 0.1) that maximized the RSEM-EVAL score on the subset described above. This assembly is publicly available from the DETONATE website. We
compared this assembly to a published axolotl assembly [27]. We find that the new assembly is longer overall and has a larger N50 score than the published assembly (Additional file 1: Table S3).
As length-based measures may not be indicative of a higher quality assembly, we also evaluated the assemblies based on the number of expressed genes and the number of differentially expressed up-regulated (DE UP) genes at each time point in the axolotl RNA-Seq time course. To enable direct comparisons with the published assembly, we used data and methods identical to those in [27], which used a comparative technique that analyzes the axolotl transcripts in terms of their orthologous human genes. With the new RSEM-EVAL guided assembly, we identify both more expressed genes at each time point and more DE UP genes at each time point (Additional file 1: Figure S15). The majority of DE UP genes found in the published assembly are captured in the new assembly (608 of 888= 68%), while only 39% (608 of 1,576) of the DE UP genes found in the new assembly are captured in the published assembly. The new assembly identifies many new DE UP genes (968) not captured in the old published assembly.
Because transcription factors are important for setting and establishing cell state [29], we further evaluated the list of transcription factors found in the new assembly that are not found in the published assembly across the axolotl RNA-Seq time course. Prior results indicate that oncogenes are up-regulated early in the time course [27]. Using the new assembly we identify two additional DE UP oncogenes (FOSL1andJUNB) that are not identified using the published assembly [27]. The prior assembly identified many genes associated with limb development and limb regeneration as being DE UP during the mid-dle phase (3 to 14 days) of the time course [27]. The new assembly identifies additional limb development and limb regeneration genes during this middle phase such as
HOXA11, HOXA13,MSX1, MSX2and SHOX. HOXA11
andHOXA13are important specifiers or markers of posi-tional information along the proximal/distal and ante-rior/posterior axes of the limb [30].MSX1andMSX2have been shown to be expressed in the axolotl blastema [31].
SHOX mutants in humans exhibit short limbs and
over-all stature [32]. The identification of many more expressed and DE UP genes, a number of which have previous sup-port for involvement in limb regeneration, suggests that the new assembly gives a more comprehensive view of the genes expressed in the axolotl.
Discussion
Related work
RSEM-EVAL is related to several recently developed
methods forde novogenome and metagenome assembly.
Although the evaluation of de novogenome assemblies
is a relatively mature area of research [22,33-40], only
recently has the need for statistically principled meth-ods been recognized [41]. Notably, Rahman and Pachter [23] developed CGAL, a principled probabilistic model-based method for evaluating genome assemblies without the ground truth. RSEM-EVAL and CGAL are closely related in that they both make use of the likelihood to score an assembly. However, RSEM-EVAL is necessarily more complex due to important differences between the tasks of transcriptome and genome assembly. In partic-ular, with genome assembly it is generally assumed that all chromosomes are sequenced to the same sequenc-ing depth, whereas with transcriptome assembly one has to consider variable sequencing depth because of widely varying transcript abundances. Therefore, as we demon-strated through our experiments, use of the likelihood alone is suboptimal for evaluating transcriptome assem-blies. In fact, even for de novogenome assembly evalu-ation, one can show that use of the likelihood alone is not optimal. For example, the likelihood criterion can-not distinguish between the true assembly and assemblies constructed by duplicating each contig of the true assem-bly ctimes. RSEM-EVAL corrects for this limitation by prior modeling of assemblies.
Because the task of de novo metagenome assembly
is roughly equivalent to that of de novo transcriptome assembly, RSEM-EVAL also has close connections to methods developed for metagenomics. Metagenomic data are similar to transcriptomic data in that each distinct ele-ment of the population is present at varying multiplicities. In this paper we have shown that RSEM-EVAL has impor-tant advantages over the two model-based reference-free measures that have been developed for evaluating metagenome assemblies, Genovo and ALE. In particu-lar, RSEM-EVAL correctly models transcript abundances and read mapping uncertainty, which is critical for distin-guishing between assemblies of alternatively spliced tran-scripts. And on realistic data sets, RSEM-EVAL is notably faster than Genovo and ALE, both of which have run-times measured in days, which is unlikely to be practical for users interested in evaluating multiple assemblies.
O’Neil and Emrich [20] comprehensively assessed a large number of reference-free and
comparative-reference-based measures for evaluating de novo
this study were primarily designed to evaluate the RSEM-EVAL score, not to determine which assembler is most accurate, in general. The versions of the assemblers used were not the most recent ones at the time of writing and the parameter variations used were not necessar-ily those recommended by the assemblers. Nevertheless, with our selected assembler versions and parameter varia-tions (which included the default settings for each assem-bler), our results provide some evidence that Trinity is more accurate than the other assemblers. To confirm this, future benchmarking will require use of the latest ver-sions of these actively developed assemblers, additional data sets, and more carefully selected parameters.
We also note a couple of important limitations regarding the use of EVAL. First, it is critical that RSEM-EVAL be run on the same RNA-Seq data set that was provided to the assemblers as it assumes that an assembly is compatible with the data. Second, RSEM-EVAL should not be used if genome information is used during tran-scriptome assembly because its model is purely based on the RNA-Seq data and therefore might be mislead-ing for genome-guided assemblies. Lastly, RSEM-EVAL currently focuses only on assemblies constructed from Illumina RNA-Seq data. We choose to focus on the Illu-mina platform as it is currently the most popular RNA-Seq platform. However, the methods we have presented can, in principle, be extended to other sequencing platforms (e.g., Roche 454 sequencing, Ion Torrent and Pacific Bio-sciences), and we plan to do so in the near future.
In addition to supporting other sequencing platforms, we plan to extend our framework to accommodate indel alignments and sequencing biases. We also plan to investigate remedies to RSEM-EVAL’s weakness of scor-ing assemblies with incorrectly fused contigs above the ground truth. Although it is unlikely that any reference-free measure can score the ground truth above all other assemblies, our random perturbation experiments sug-gest that RSEM-EVAL is permissive of assemblies that concatenate low-coverage contigs, perhaps because of its modeling of the true assembly with minimum overlap length 0.
Conclusions
We presented DETONATE, a methodology and
cor-responding software package for evaluating de novo
transcriptome assemblies, whch can compute both
REF-EVAL, our toolkit for reference-based measures, allows for a more refined evaluation compared to exist-ing reference-based measures. The measures it provides include recall, precision andF1 scores at the nucleotide and contig levels, as well as a KC score.
Experimental results for both simulated and real data sets show that our RSEM-EVAL score accurately reflects assembly quality. Results from perturbation experiments that explored the local assembly space around the ground truth suggest that RSEM-EVAL ranks the ground truth among the locally highest-scoring assemblies. In contrast, a score based only on the likelihood fails to rank the ground truth among its best scores, which highlights the importance of including a prior on assemblies as part of an evaluation score. Through correlation experiments, we measured the similarity of the RSEM-EVAL scores to dif-ferent reference-based measures. We find that, in general, the RSEM-EVAL score correlates well with reference-based measures. In contrast, simple reference-free mea-sures, such as N50, did not correlate well, suggesting that they are inappropriate for evaluating transcriptome assemblies. And whereas several model-based methods designed for the highly similar task of metagenome assem-bly evaluation had correlations with reference-based mea-sure comparable to those of RSEM-EVAL, we found that these methods failed in a certain class of realistic scenarios and did not have practical runtimes.
To demonstrate the usage of RSEM-EVAL, we assem-bled a set of contigs for the regenerating axolotl limb with its guidance. Evaluation of this new assembly suggests that it gives a more comprehensive picture of genes expressed and genes up-regulated during axolotl limb regeneration. Thus, RSEM-EVAL is likely to be a powerful tool in the building of assemblies for a variety of organisms where the genome has not yet been sequenced and/or the transcrip-tome has not yet been annotated.
Materials and methods
The true assembly according to DETONATE
rightmost (3) position ofralong the transcript, respec-tively. We parameterize this notion of a true assembly by a length,w, which is the minimum overlap between two reads required for the extension of a contig. Givenw, we define the sequence of a segment, [start, end], of a tran-script,t, to be a true contig if there exists an ordered set of reads,(r1,r2,. . .,rn), such that:
1. transcript(ri)=t, ∀i
2. right(ri)−left(ri+1)+1≥w, ∀i<n
3. left(r1)=start
4. right(rn)=end
5. [start, end]is maximal
The first four conditions ensure that the segment is
completely covered by reads overlapping by at least w
bases and the last condition ensures that one contig can-not be contained within acan-nother. With single-end data, the true assembly is then defined as the set of all true contigs. Such an assembly is the best theoretically achievable by a
de novoassembler that requires at leastwbases of over-lap to merge two reads. The true assembly at minimum overlap lengthw = 0 is the best theoretically achievable assembly in that it represents all contiguously covered seg-ments of the transcript sequences. With paired-end data, one may also consider the notion of a true scaffold, which is a set of true contigs linked together by strings of N
characters representing intervals of transcripts that were not covered by any reads but that were spanned by read pairs. More precisely, if one constructs a graph with each true contig as a vertex and an edge between any two ver-tices whose respective contigs are linked by a read pair, then the set of true scaffolds corresponds to the connected components of this graph.
Overview of RSEM-EVAL
In this and the following subsections, we describe RSEM-EVAL in more detail. To simplify the presentation, we initially restrict our attention to contig assemblies from single-end data. In a later subsection, we will describe the slight differences in RSEM-EVAL when used with scaffold assemblies from paired-end data.
RSEM-EVAL models an RNA-Seq data set,D, consisting ofNreads, each of lengthL, and an assembly,A, consisting ofMcontigs, with the length of contigidenoted byiand its sequence byai. RSEM-EVAL also models the expected
read coverage = {λi} of each contig’s parent
tran-script, where the expected read coverage of a transcript is defined as the expected number of reads that start from each valid position of the transcript, given the sequenc-ing throughput,N. A transcript’s expected read coverage is proportional to its relative expression level (Additional file 1: Section 1).
A natural way to decompose the joint distribution of an assembly and the reads used to construct it,P(A,D),
would be to (1) specify a prior distribution over the unob-served transcript sequences and their abundances, (2) model the generation of reads from these transcripts and (3) modelAas being the true assembly at minimum over-lap length 0 of the reads inD(Additional file 1: Figure S1a). Unfortunately, this decomposition requires us to inte-grate out the unobserved transcript sequences to obtain the distributionP(A,D), and doing so is computationally infeasible.
Instead, RSEM-EVAL decomposes the joint distribution in an equally valid but more computationally convenient manner, as follows:
1. We specify aprior distribution,P(A|), over the assemblyA, given the expected read coverage of each contig’s parent transcript,.
2. We model the generation of a set of readsD
consistent with the assemblyAand the expected read coverage; this model defines thelikelihood
P(D|A,), the probability of the readsDgiven the
assemblyAand the expected read coverage.
3. Instead of specifying a concrete distribution over the
number of contigsMand the expected read coverage
, we approximately integrate out these variables using the BIC [42].
Based on this decomposition, the RSEM-EVAL score, logP(A,D), can be expressed as a sum of three terms: the assembly prior, the likelihood and a BIC term (Equation 1 in the Results). These three terms are detailed in the next three subsections. The relationship between the nat-ural decomposition and the RSEM-EVAL model is further discussed in Additional file 1: Section 2.
RSEM-EVAL’s assembly prior component
RSEM-EVAL’s prior distribution over assemblies is based on a simple parametric model of the transcriptome and the reads, together with the concept of a true assembly as we have described. First, a key assumption of the prior model is that each contig is generated independently. This assumption is useful, even though it is not satisfied in practice since multiple contigs can be generated from the same transcript. With this assumption, we may express the prior as:
P(A|)= M
i=1 P(ai|λi)
Second, each contig’s parent transcript is modeled as follows.
tribution of its parent transcript, as follows. Imagine that we repeat the following steps until we have a large enough number of contigs in the bag:
1. A transcript and its reads are generated as above.
2. The true assembly at minimum overlap lengthw=0
is constructed from these reads.
3. All contigs in the true assembly are put into the bag. The frequency of contigs in the resulting bag defines our per contig priorP(ai|λi).
The above specification leads to the following functional form for the prior:
P(A|)= M
i=1
P(i|λi)
contig length prior
1 4
M i=1i
assembly size prior
One can work out a dynamic programming algorithm to computeP(i|λi), by means of which the prior can be computed efficiently (Additional file 1: Section 3).
The practical contribution of the prior is as follows. Each term of the contig length prior,P(i|λi), penalizes contigs with aberrant lengths that are not likely given the expected read coverage of their parent transcripts. The
assembly size prior,14
M
i=1i
, imposes a parsimony pref-erence on the total length of an assembly and pushes the RSEM-EVAL score to favor assemblies using fewer bases to explain the RNA-Seq data.
RSEM-EVAL’s likelihood component
For modeling the RNA-Seq reads, we build on the model used by RSEM [43,44] for the task of transcript quantifi-cation. The RSEM model provides a probability distribu-tion for an RNA-Seq data set,D, given known transcript sequences,T, and relative abundances of those transcripts
encoded by the parameters,. Given this model, RSEM
uses the expectation-maximization algorithm for efficient computation of the ML estimates for. Unfortunately, we cannot directly use the likelihood under the RSEM model because (1) we do not observe the full-length transcript sequences and (2) we require that the RNA-Seq reads are consistent with an assembly in that they completely cover the contigs. Nevertheless, the RSEM model can be used as part of a generative process that results in a proper
This process results in the following form for RSEM-EVAL’s likelihood:
P(D|A,MLE)=
PRSEM
D|T =A,cMLE
PRSEM
C=1|T =A,cMLE, (3)
where PRSEM denotes a probability under the RSEM
model and C = 1 denotes the event that every
posi-tion in the assembly is covered by reads that overlap with each other by at leastwbases.cMLEdenotes the equiv-alent parameter values of the RSEM model given the ML
expected read coverage values, MLE. We refer to the
denominator of Equation 3 as the likelihood correction term. This term can be calculated efficiently (Additional file 1: Section 4).
RSEM-EVAL’s BIC penalty component
The BIC penalty is proportional to the product of the number of free parameters and the logarithm of the size of the data. The free parameters are the expected cov-erage of each contig, plus one extra parameter for the expected number of reads from RSEM’s noise model, for
M+1 parameters in total. The data size isN, which rep-resents the number of reads. The BIC penalty imposes a parsimony preference on the total number of contigs in an assembly.
The inference algorithm used to compute the RSEM-EVAL score
We use the following heuristic inference algorithm to calculate the RSEM-EVAL score:
1. LearnMLEusing RSEM, treating the input assembly
Aas the true transcript set.
2. ConvertMLEintoMLEvia the formula:
λMLE,i=
NθMLE,i i+L+1
,fori>0
3. Calculate the RSEM-EVAL score,logP(A,D), using
MLEand Equation 1.
subtle, we chose to use a more sensitive aligner, GEM (binary pre-release 3) [46]. To produce alignments with similar criteria as Bowtie, we first extracted the first 25 bp (seed) of every read and aligned the seeds using GEM
with-q ignore --mismatch-alphabet ACGNT -m
2 -e 0 --max-big-indel-length 0 -s 2 -d
200 -D 0 options set for gem-mapper. Lastly, we
filtered any alignments for which the seed could not be extended to the full read length.
In step 2, we do not use the contig-level read coverage, NθMLE,i
i−L+1 to approximate the expected read coverage of its parent transcript,λi, because it is likely to overestimateλi, especially for short contigs. Instead, to make a partial cor-rection for this overestimation, we adjust the denominator in this estimator toi+L+1 to account for the fact that no reads started withinLbases of the start positions of the reads making up the contig (otherwise, the contig would have been extended, since our model considers the assem-bly to have been created using minimum overlap length
w=0).
RSEM-EVAL with paired-end data
RSEM-EVAL may also be used to evaluate scaffold assem-blies from paired-end data. There are just a few differences between the models RSEM-EVAL uses for single-end and
paired-end data. With paired-end data, N becomes the
number of read pairs in the data set,Lbecomes the mean fragment length, andMbecomes the number of scaffolds in the assembly. The likelihood component of the RSEM-EVAL score uses the probability of the data under RSEM’s paired-end model, which includes the probabilities of the fragment lengths implied by the alignments of the read pairs. The likelihood correction term and assembly prior component, both of which are dependent onL, are com-puted based on the mean fragment length rather than the mean read length. The inference algorithm used by RSEM-EVAL for paired-end data is the same as for single-end data with the exception that the reads are aligned to the scaffolds as read pairs rather than as individual reads.
REF-EVAL’s estimate of the true assembly
REF-EVAL estimates a set of true contig (scaffold) sequences from a given set of transcripts and RNA-Seq single-end (paired-end) reads using the following proce-dure:
1. Align the reads against the transcript sequences using RSEM.
2. For each alignable read (read pair), sample one of its alignments based on the posterior probability that it is the true alignment, as estimated by RSEM. The set of alignments for each read (read pair) includes the null alignment that the read (read pair) comes from background noise.
3. Treat the sampled alignments as true alignments and compute the true contigs with minimum overlap lengthw=0.
4. For paired-end reads, join any true contigs that are spanned by at least one read pair into true scaffolds, with the distance between contigs determined by their positions in the parent transcript.
REF-EVAL’s contig- (scaffold-) and nucleotide-level measures
Given a set of ground truth reference sequences, REF-EVAL provides assembly recall, precision andF1 scores at two different granularities. Recall is the fraction of ref-erence elements (contigs, scaffolds or nucleotides) that are correctly recovered by an assembly. Precision is the fraction of assembly elements that correctly recover a
ref-erence element. The F1 score is the harmonic mean of
recall and precision:
F1=
2×recall×precision recall+precision
Because theF1score is a combination of both recall and precision, it gives a more balanced view of an assembly’s accuracy than either precision or recall does alone.
REF-EVAL provides these measures at two different granularities: contig (scaffold) and nucleotide. Taking recall as an example, the measures at the two levels can be summarized as follows. For both levels, we first com-pute all significant local alignments between the assembly sequences and the reference sequences, using BLAT [47]. The contig (scaffold) level measurement [2,16,17] counts the number of correctly recovered reference sequences after a one-to-one mapping is established between con-tigs (scaffolds) and reference sequences. At the nucleotide level, the recall measure instead counts the number of correctly recovered nucleotides based on the alignments between the assembly and the ground truth sequences [5,6]. The precision measures for both levels are calculated similarly by switching the roles of the assembly sequences and reference sequences.
In detail, REF-EVAL defines the contig (scaffold) recall as follows. For a reference sequence to be correctly recov-ered, at least 99% of its (non-N) sequence must be identi-cal to that of the assembly sequence to which it is aligned, and vice versa, and the total number of insertions and deletions in the alignment between the two must be no more than 1% of the length of either sequence. Each per-centage is computed relative to the length (excluding N
a given reference position, we select a single alignment for each position by picking alignments in order of their marginal contribution to the nucleotide recall, given the alignments that have already been selected. Algorithms to compute the contig and nucleotide measures are given in Additional file 1: Sections 6 and 7.
REF-EVAL’sk-mer compression score
The KC score is a combination of two measures, WKR and ICR (Equation 2). WKR measures an assembly’s recall of the k-mers present in the reference sequences, with eachk-mer weighted by its relative frequency within the reference transcriptome. It has several advantages over the contig-, scaffold- and nucleotide-level recall mea-sures. First, unlike the nucleotide measure, it takes into account connectivity between nucleotides, but is not as stringent as the contig measure because it only
consid-ers connectivity of nucleotides up to k − 1 positions
apart. Second, it is biased toward an assembler’s ability to reconstruct transcripts with higher abundance, which are arguably more informative for evaluation because there are generally sufficient data for their assembly. Lastly, it is relatively easy to compute because it does not require an alignment between the assembly and the reference sequences.
To compute WKR, the relative abundances of the ref-erence elements are required. These abundances may be estimated from the RNA-Seq data used for the assembly, and REF-EVAL uses RSEM for this. Given the reference sequences and their abundances, ak-mer occurrence fre-quency profile, p, is computed, with individual k-mer occurrences weighted by their parent sequences’ abun-dances: for eachk-merr, we define:
p(r)=
b∈Bn(r,b)τ(b)
b∈Bn(b)τ(b)
whereBis the set of reference sequences, and for each ref-erence sequencebinB,n(r,b)is the number of times the
k-merroccurs inb,n(b)is the total number ofk-mers in
b, andτ(b)is the relative abundance ofb. Lettingr(A)be the set of allk-mers in the assembly, WKR is defined as:
WKR=
r∈r(A) p(r)
Since recall measures only tell half of the story regarding accuracy, the KC score includes a second term, ICR, which
data size is the total number of nucleotides in the data,
NL, and the compressed result size is the total number of nucleotides in the assembly,|A|. The smaller the ICR value, the more efficient the assembler is in compress-ing the data. We chose to use ICR over other possible precision-correcting schemes (e.g.,F1 score) because of important mathematical connections between the RSEM-EVAL and KC scores (Additional file 1: Section 8). Thus, as we showed with our experiments, the reference-based KC score provides some additional intuition for what the reference-free RSEM-EVAL score is measuring. The theoretical links between the two scores suggest that the KC score would benefit from some additional terms (Additional file 1: Section 8); however, in keeping with our goal of simplicity, we restricted the KC score to the two most dominant terms.
RNA-Seq data used in the perturbation experiments Both the random and the guided perturbation exper-iments (see Results) use a simulated set of RNA-Seq reads. We simulated these reads from a mouse tran-script set (Ensembl Release 63 [48]), using RSEM’s [43,44] RNA-Seq simulator and simulation parameters learned from the first mates of a set of real paired-end mouse data (Sequence Read Archive accession [SRA:SRX017794] [49]).
The resulting simulated data set contained around 42 million strand non-specific 76-bp single-end reads. For reasons of computational efficiency, in the random pertur-bation experiments, we only used reads from transcripts on chromosome 1, and we constructed the ground truth accordingly. This resulted in 1,843,797 reads that formed 10,974 contigs in the ground truth assembly.
For our guided perturbation experiments, we addition-ally used a real data set consisting of the first mates of the mouse data previously mentioned. This real data set also contained around 42 million strand non-specific 76-bp single-end reads. The true origin of each read in the real data set was estimated using REF-EVAL.
Construction of randomly perturbed assemblies
substitution mutations) were generated by randomly and independently substituting each base of the ground truth at a specific substitution rate. Fusion assemblies were generated by repeatedly joining two randomly selected contigs until the specified number of fusion events was reached. For each join, if the two selected contigs shared a common sequence at their ends to be joined, the con-tigs were overlapped such that the shared sequence only appeared once in the fused contig. To generate a fis-sion assembly, each contig position at which two reads were merged in the ground truth was independently selected as a fission point at the specified fission rate. If reads overlapped at a fission point, the overlapped segment was made to appear in both contigs after the fission. To generate an indel-perturbed assembly, inser-tions and deleinser-tions were introduced across the ground truth assembly according to the specified indel rate. The length of each indel was sampled from a geomet-ric distribution with mean 3, to model the short indels occasionally observed in high-throughput sequencing data.
For substitution and indel assemblies, the mutation strength was the mutation rate per contig position, which was varied among 1×10⁻⁶, 1×10⁻⁵, 1×10⁻⁴, 1×10⁻³ and 1×10⁻². For example, in the substitution experiment, at mutation rate 1×10⁻³, a substitution was introduced at each position of each contig with probability 1×10⁻³. The fission experiments used the same range of mutation rates, but with the rate defined as per pair of immediately adjacent and overlapping reads. For fusions, the mutation strength was the number of fusion events, which ranged among 1, 10, 100, 1,000 and 10,000.
RNA sequencing data used in the correlation experiments For our experiments measuring the correlation between the RSEM-EVAL score and reference-based measures we used five data sets: simulated and real mouse, strand non-specific single-end RNA-Seq data sets used in the per-turbation experiments, the complete strand non-specific paired-end mouse data set [SRA:SRX017794] from which these single-end data sets were derived, and the strand-specific single-end mouse and yeast data sets from Grabherret al. [4]. The entirety of each data set was used, except for the simulated data set, from which we used roughly half of the simulated reads (reads from transcripts in chromosomes 1 to 10) for computational efficiency. For
each assembler, we used a variety of parameter settings (Additional file 2), resulting in a total of 211 assem-blies for each of the strand non-specific data sets and 159 assemblies for each of the strand-specific data sets (Table 3). Because the versions of SOAPdenovo-Trans and Trans-ABySS we used did not take into account strand specificity, they were not run on the two strand-specific data sets. The reference-based measures were computed relative to the estimated true assemblies at minimum
overlap lengthw = 0. These assemblies were estimated
using the mouse Ensembl annotation (release 63) for the three mouse data sets and the PomBase [50] Schizosaccha-romyces pombeannotation (v09052011) for the yeast data set.
Running of alternative evaluation methods
The compute_score_denovo program of Genovo
(v0.4) was run with default parameters to compute the Genovo score of an assembly from a set of single-end reads. ALE (Git commit b9d2d88915, 29 August
2014), was run with the --metagenome option (to
match more closely the transcriptome assembly task) and with the identical alignment file of the reads to the assembly sequences used by RSEM-EVAL. The N50, number of bases in (non-singleton) contigs, number of unique proteins matched and ortholog hit ratio mea-sures were computed using custom scripts. The number of unique proteins matched and ortholog hit ratio mea-sures were computed as previously described [20,26], with one clarification that the ortholog hit ratio of a con-tig lacking a BLAST hit is defined as zero. For these comparative-reference-based measures, we used the col-lection of human protein sequences in release 2014_08 of the UniProt Knowledgebase [51] as a reference. For the number of bases in contigs and number of unique proteins matched measures, we removed all assembly ele-ments with length less than or equal to the read length to ensure that only non-singleton contigs were included in the calculations.
Software availability
[image:19.595.59.541.680.724.2]The DETONATE software is freely available from its web-site [52]. Its source-code repository is available [53]. The software runs in POSIX-compatible environments. A copy of the version of the software used for the experiments in this paper is provided as Additional file 3.
Table 3 Assemblers and number of assemblies generated by them (using different parameter settings) for the correlation experiments
Assembler Trinity Oases SOAPdenovo-Trans Trans-ABySS
Version r2012-03-17 0.2.06 1.01 1.3.2
Number of assemblies 86 73 51 1