2016 International Conference on Wireless Communication and Network Engineering (WCNE 2016) ISBN: 978-1-60595-403-5
Research on Alarm Classification Methods
Based on Multivariate Condition Data
Long ZHOU, Zhan-hui XIAO
and Jun CHEN
*Guangdong Gower Grid Company of China Southern Power Grid, DongFeng East Road No. 757, Yuexiu District of Guangzhou Gity, Guangdong Province, China
*Corresponding author
Keywords: Condition monitoring, Time series, Pattern discovery, Queries on time series data.
Abstract. The primary focus of alarm classification is to classify alarms according to equipment condition and operator actions, which is the equivalent of classifying multivariate alarm-relevant condition data. This paper proposed an alarm classification model which aims to appropriately cluster values of alarm-relevant condition data through cluster analysis. We proposed an alarm classification model, and implemented a clustering tool for multivariate alarm-relevant condition data and a statistical tool for alarm classification. This model formulates alarm classification rules by conducting cluster analysis on condition data. These rules in turn can be jointly employed by the model to classify alarm events according to equipment working conditions and operator actions. The resulting alarm categories with a high frequency of occurrence are then displayed.
Introduction
The primary focus of alarm classification is to classify alarm events according to equipment working condition and operator actions, which is equivalent to classifying multivariate alarm-relevant condition data[1,2]. This paper proposes an alarm classification model which aims to cluster values of alarm-relevant condition data by conducting clustering analysis. It also seeks to design and develop a clustering tool for multivariate alarm-relevant condition data and a statistical tool for alarm classification.
Framework of Alarm Classification Model
Database of alarm characteristics integrated with multivariate condition data
Database of alarm categories
File storage
File storage
Run-time support
Run-time support
High-level application
High-level application
Clustering engine for values of condition data
Display component for clustering results on values of condition data
Database of alarm classification rules Filtering component of
clustering results on values of condition data
Computing engine for alarm classification
Statistical engine for alarm classification Display component for
statistical results of alarm classification Clustering tool for multivariate alarm-relevant
condition data
[image:1.595.72.522.521.747.2]Statistical tool for alarm classification
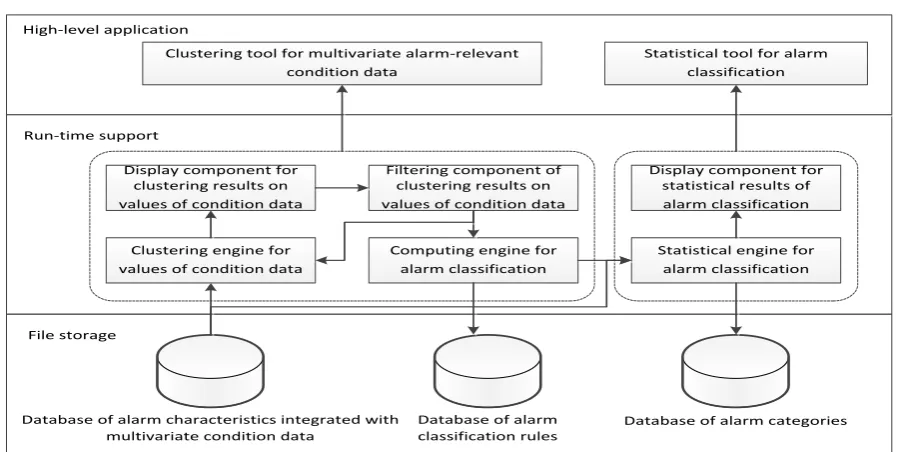
Figure 1 shows the framework of the alarm classification model. The overall framework of the model consists of three levels: the document storage level, the run-time support level, and the high-level application. The file storage level includes three databases: database of alarm characteristics integrated with multivariate condition data, database of alarm classification rules, and database of alarm categories. The alarm characteristics extracted from the previous chapter are stored in the database of alarm characteristics integrated with multivariate condition data, and used as the input data of the whole model. Alarm classification rules were generalized from processing the multivariate alarm-relevant condition data using the model, and stored in the database of alarm classification rules, which serve as the intermediate data of the model. The database of alarm categories stores the alarm categories resulting from the processing of alarm events using the model, and are the output data of the whole model.
These three levels jointly support the framework of the alarm classification model, in order to accomplish the objective of classifying alarm events by utilizing the database of alarm characteristics integrated with multivariate condition data.
Design of Clustering Tool for Multivariate Alarm-Relevant Condition Data
Select relevant condition data
Set number of cluster centers
Display clustering results on values of
condition data Select alarm
category
Database of alarm characteristics integrated with multivariate condition data
Start clustering on values of condition
data
Is the clustering result appropriate? No No
Compute alarm classification rules
yes yes
Database of alarm classification rules
Set upper and lower boundaries for condition data
Set maximum number of iterations in clustering
Filter cluster centers Store alarm
[image:2.595.70.526.289.419.2]classification rules
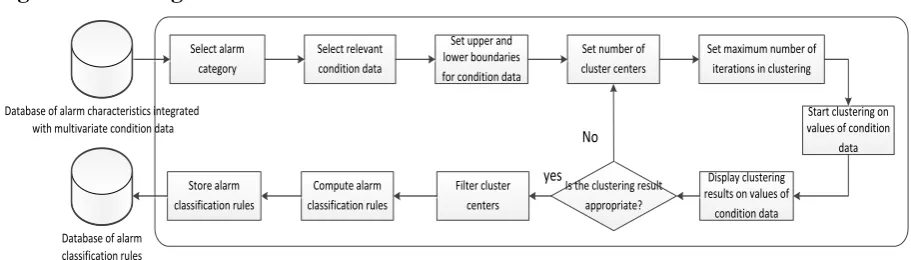
Figure 2. Workflow of Clustering Tool for Multivariate Alarm-relevant Condition Data.
Figure 2 introduces the workflow for the clustering tool for multivariate alarm-relevant condition data. Firstly, the alarm category was selected. Upon the retrieval of corresponding alarm characteristics from the database, one type of condition data was chosen for clustering analysis. The following step is to set the upper and lower boundaries, the number of cluster centers and the maximum number of iterations. After which, clustering was performed on the condition data, and the clustering result was displayed. If the clustering results were not appropriate, the number of cluster centers and the maximum number of iterations were re-set before clustering was continued on the condition data. Otherwise, the cluster centers were filtered directly from the results for the computation of alarm classification rules, which, in turn, will be stored in the database of alarm classification rules.
Clustering Engine for Values of Condition Data
Table 1. Pseudo-code of clustering algorithm for condition data.
Input: Dataset of values of condition data Sv, the number of cluster centers k, the maximum number of iterations imax
Output: k clusters of values of condition data, the parameters of each cluster include the cluster center vc, the number
of cluster centers num, and cluster standard deviation std
CLUSTER(Sv, k, imax)
1 vc1, vc2, …, vck RANDOM(Sv, k)
2 S1 {vc1}, S2 {vc2}, …, Sk {vck}
3 i 1
4 dofor each vSv
5 do find closest vcj{vc1, vc2, …, vck} to v
6 Sj Sj {v}
7 for j 1 to k
8 do compute numj, vj, stdj for Sj
9 i i + 1
10 while i imax and {vc1, vc2, …, vck} changes
11 return {{vc1, num1, std1}, {vc2, num2, std2}, …, {vck, numk, stdk}}
Table 1 shows the pseudo-code of the clustering algorithm for the values of condition data. This method is based on K-means clustering, with the input data encompassing the dataset of values of
condition data Sv, the number of cluster centers k, and the maximum number of iteration imax.
Among the input, k and imax have to be entered by the user through the interface of the clustering tool
for multivariate alarm-relevant condition data, whereas Sv is the dataset of condition data values
assigned with a category code idj, indicating they are relevant to a specific alarm event with category
code id.
Design of the statistical tool for alarm classification is as follows.
Select alarm classification rules
Collect statistics on alarm categories Search all alarm
classification rules
Database of alarm classification rules
Database of alarm categories
Classify alarm events
Database of alarm characteristics integrated with multivariate condition data Display alarm
[image:3.595.81.518.474.575.2]classification results
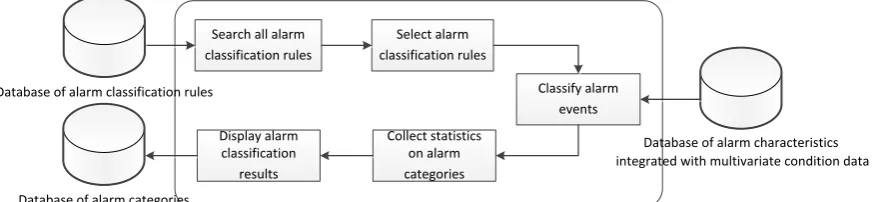
Figure 3. Workflow of the statistical tool for alarm classification
Figure 3 shows the workflow of the statistical tool for alarm classification. Firstly, all the classification rules computed and stored in the database of alarm classification rules was searched, of which all or some rules will be selected to be applied in alarm classification. The number of the resulting classification categories will then be computed, and the classification results will be displayed, and stored in the alarm categories database.
Statistical Engine for Alarm Classification
categorize all alarm events, and the number of alarm events in each category will be computed and subsequently displayed in the display component for alarm classification results[5,6].
System Implementation and Result Analysis
This paper aimed to implement the framework of alarm event filtering based on the alarm characteristics extraction method for multivariate condition data, the alarm classification model and the alarm filtering model, combined with alarm data and condition data in the Cassandra database, and fault repair data in the Oracle database. This paper will also introduce its high-level application in detail, and analyze the alarm event filtering results.
Implementation of High-Level Application
[image:4.595.96.502.290.571.2]This paper employed Java language to implement the framework of alarm event filtering. The input data were stored using the Cassandra database and the Oracle database, while the output data were stored as files.
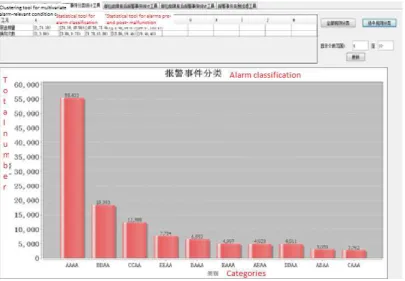
Figure 4. Interface of the statistical tool for alarm classification.
Figure 4 illustrates the interface implementation of the statistical tool for alarm classification, which comprises a top and a bottom panels. The top panel displays all the alarm classification rules computed by the statistical tool for alarm classification, whereas the bottom panel shows the bar chart of the display component for classification results.
Experiment and Analysis of Experimental Results
The aim of the experiment in this paper was to conduct filtering analysis on the overspeed fault alarms of pump trucks using the alarm filtering system. The target equipment was 583 pump trucks (Model 12BC5313) from a subsidiary of Guangdong Power Grid Corporation. The target data were overspeed fault alarms, relevant condition data and fault repair data collected for a 9-month duration from October 1st, 2012 to June 30th, 2013.
clustering in order to formulate the alarm classification rules[7]. The following step involved classifying the alarms according to those rules, analyzing the classification results.
(1) Analysis of the alarm classification results
The direct cause of over speed fault alarms is when the engine revolution speed exceeds the limit of 1900 revolutions per minute. Since under the normal working conditions, the engine revolution speed falls far below this boundary, the triggered alarm will lead to a sudden change in the revolution speed. However, the process of this change cannot be properly recorded due to the inadequate frequency of data return on engine revolution condition. To take this into consideration, this experiment excluded the engine revolution data, but instead, opted for condition data on pumping capacity and commutation frequency for computation, as they are relatively more stable.
(2) Analysis of the clustering results for condition data
[image:5.595.66.532.277.388.2]Firstly, clustering was performed on the condition data of pumping capacity and commutation frequency.
Table 2. Cluster statistics for pumping capacity (%).
3 clusters 4 clusters 5 clusters
No. of cluster centers
Percentage of total
No. of cluster centers
Percentage of total
No. of cluster centers
Percentage of total
14 45% 14 44% 14 44%
37 20% 35 18% 34 17%
86 35% 69 18% 63 14%
98 20% 80 7%
99 18%
Table 2 summarizes the clustering results on the pumping capacity, which involves three cases: 3 clusters, 4 clusters, and 5 clusters. As shown in the figure, when 5 clusters were selected, the data members of the group with 80 cluster centers only accounted for 7% of the total data, which is significantly different from the highest level of 44%. On the other hand, in case of 3 or 4 clusters, the percentage difference between the highest and the lowest level was not as pronounced. Furthermore, in order to maximize data dispersion to differentiate more equipment working conditions, 4 clusters were eventually selected for pumping capacity, and the cluster centers were 14, 35, 69 and 98, respectively.
(3) Analysis on categories of frequently triggered alarms
In compliance with the alarm classification rules derived from the computation of pumping capacity and commutation frequency, 168673 overspeed alarms of the pump trucks (Model 12BC5313) were classified, followed by analysis on the categories of frequently triggered alarms.
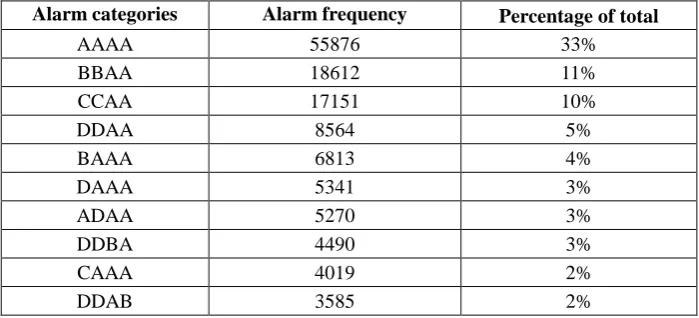
Table 3. Top 10 categories of frequently triggered alarms.
Alarm categories Alarm frequency Percentage of total
AAAA 55876 33%
BBAA 18612 11%
CCAA 17151 10%
DDAA 8564 5%
BAAA 6813 4%
DAAA 5341 3%
ADAA 5270 3%
DDBA 4490 3%
CAAA 4019 2%
DDAB 3585 2%
[image:5.595.123.473.594.753.2]events occurred frequently, filtering analysis was necessary. Based on these categories of frequent alarm events, the following conclusions were drawn:
When over speed alarms were frequently triggered, in the majority of cases, the value of commutation times approached 0, and showed little variation at pre- and post-alarm. This suggests that an overs peed alarm is most likely to be triggered when the equipment is in preparation for pumping and in low-intensity pumping.
The alarm events in Category AAAA accounted for 33% of the total, whereas the percentages of the remaining 7 categories only accounted for 1% to 11%. It is, therefore, evident that the alarm events in Category AAAA have a much higher frequency of occurrence compared to those in the other categories. This indicates that when the equipment is in preparation for pumping, and when the pumping capacity is set at a low level, the overs peed alarm was most likely to be set off.
As the categories of DDBA and DDAB accounted for 3% and 2%, respectively, of the total alarm events, it is another indication that over speed alarms also tend to occur frequently when the equipment is switching between conditions of high-intensity pumping and pumping preparation.
Conclusion
This paper conducted research on the filtering methods for alarm events with a high frequency of occurrence. We proposed an alarm classification model, and implemented a clustering tool for multivariate alarm-relevant condition data and a statistical tool for alarm classification. This model formulates alarm classification rules by conducting cluster analysis on condition data. These rules in turn can be jointly employed by the model to classify alarm events according to equipment working conditions and operator actions. The resulting alarm categories with a high frequency of occurrence are then displayed.
There are still areas for improvement in the research of this paper, which mainly includes the following aspects:
1) When classifying the condition data using the clustering method, computation was only performed from the perspective of the data itself, without the involvement of mechanistic knowledge to assist the analysis. Consequently, the clustering results may not offer sufficient value in its actual application. Future cluster analysis can take this into consideration for improvement.
2) In this paper, different alarm categories were classified based on the fault repair data collected on various parts of the equipment, and alarms were filtered by a given alarm category for a given part of the equipment. Subsequent work can attempt to explore more classification approaches on fault repair data, such as classifying alarms by fault types, etc.
References
[1] Rothenberg D H. Alarm Management for Process Control: A Best-Practice Guide for Design, Implementation, and Use of Industrial Alarm System[M]. Momentum Press, 2009: 3-4.
[2] Hollifield B R, Habibi E. The alarm management handbook: a comprehensive guide[M]. Pas, 2006.
[3] Bergquist T, Ahnlund J, Larsson J E. Alarm reduction in industrial process control[C]//Emerging Technologies and Factory Automation, 2003. Proceedings. ETFA'03. IEEE Conference. IEEE, 2003, 2: 58-65.
[4] Kondaveeti S R, Shah S, Izadi I. Application of multivariate statistics for efficient alarm generation[C]//Fault Detection, Supervision and Safety of Technical Processes. 2009: 657-662.
[6] Yao Xin-Xin, Liu Ying-Bo, Zhao Jiong, et al. Device group-oriented method for abnormal floor data detecting [J]. Computer Integrated Manufacturing Systems, 2013, 19(12): 2993-3001.
[7] EEMUA 191, “Alarm Systems – A Guide to Design, Management and Procurement”, 2nd Edition, 2007.