2016 International Conference on Manufacturing Science and Information Engineering (ICMSIE 2016) ISBN: 978-1-60595-325-0
Shift Schedule Optimization for AMT of EVs
based on Motor Efficiency
HUA SUN, XIAOFENG YIN, XIAOHUA WU and WEI LI
ABSTRACT
Based on the analysis of the characteristics of vehicle and the motor, a new method for calculating the best efficiency shift schedule was proposed for electric vehicles (EVs) with 3-speed AMT. The proposed shift schedule was tested and compared with the best dynamic performance shift schedule through acceleration and ECE+EUDU driving cycle simulation using MATLAB/Simulink software. The simulation results demonstrate that the best efficiency shift schedule improves the economic performance by 6.91%, but reduces the dynamic performance by 7.43%, which is more suitable for economic driving style. 1
INTRODUCION
With the popularity of electric vehicles (EVs) and the development of automatic transmission technology, more and more EVs have been equipped with automatic transmissions, as it is vitally significant for reducing the demands on motor size and power by making full use of the advantages of both motor and automatic transmission.
Similarly to traditional vehicles, shift schedule is the critical technology of shift control strategy. The dynamic performance and economic performance are always considered in current studies on shift schedule, such as the dynamic shift schedule [1, 2], and the comprehensive shift schedule considering both dynamics and economy [3], while the influence of motor efficiency is less considered. In this paper, a method of calculating best efficiency shift schedule is formulated for EVs with a 3-speed Automated Manual Transmission (AMT).
1
POWERTRAIN PARAMETERS MATCHING METHOD
Powertrain system of the investigated EV consists of a driving motor and an AMT, so it’s necessary to match the main parameters of the motor and the ratios of the transmission system before shift schedule optimization.
Motor Parameters
The main parameters of driving motor are rated speed, peak speed, rated power and peak power.
The demanded power P1 for EVs running at the maximum speed is
2
max D max
1
T
( )
3600 21.15
a a
u C Au
P mgf
(1)
Where, uamax is the maximum speed (km/h), m is the vehicle mass (kg), f is
the rolling resistance, CD is aerodynamic drag, A is the frontal area (m2), is the mechanical efficiency of the transmission system.
The demanded power P2 for EVs corresponding to climbing the maximum ramp with ua is defined as
(2)
Where, ua is the steady speed on the ramp (km/h), max is the maximum
slope.
The demanded power P3 for EVs speeding up on a level road is as
2 3
m m D m
3 m m
m T
1
( )
3600 7.2 1.5 21.15 2.5
u u C Au
P m mgf t t
t
(3)
Where, is the equivalent coefficient of vehicle rotating mass, um is the ending speed during acceleration (km/h), and 100 km/h is chosen in this paper, tm is the maximum acceleration time (s).
and common vehicle speeds.
AMT Gear Ratios
Once the output characteristics of motor are constant, the ratios of transmission are compromised to achieve the performance indicators.
The minimum ratio imin, which is the top gear ratio, should be able to ensure
the vehicle reaching the top speed, and it is according to the top vehicle speed
nmax and the peak output speed of motor uamax as
(5)
The maximum ratio imax is determined through the maximum output torque of the motor Tmax and the maximum travel resistance Ftmax on the ramp as
(6)
Based upon the characteristics of the motor and the vehicle performance indicators, a 3-speed AMT is used to keep the driving motor working in the high efficiency area as much as possible. Generally, the top gear is set to be the direct gear. The minimum gear is selected based on the maximum transmission ratio, and the middle gear is determined according to both the gear number and geometric progression.
SHIFT SCHEDULE CALCULATING METHODS
0 50 100 150 0.5
1 1.5 2 2.5
Vehicle speed (km/h)
A
cce
le
ra
ti
o
n
(
m
/s
2)
1st gear accelaration 2nd gear acceleration
A
0 50 100 150
0.4 0.6 0.8 1 1.2 1.4 1.6 1.8 2
Vehicle speed (km/h)
A
cce
le
ra
ti
o
n
(
m
/s
2)
1st gear acceleration 2nd gear acceleration
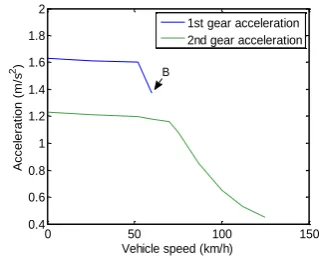
[image:4.612.106.465.90.226.2]B
Figure 1. General shift point. Figure 2. Boundary shift point.
Best Dynamic Performance Shift Schedule
Graphical method and analytical method are two often used methods for developing dynamic shift schedules. In order to get the best dynamic performance, the intersection point of adjacent gear acceleration curves at the same throttle condition is usually chosen as the shift point, as point A in Figure. 1. If there is no intersection point, the end point of acceleration curve of the lower gear at the same throttle condition will be chosen as the shift point, as point B in Figure 2.
Best Efficiency Shift Schedule
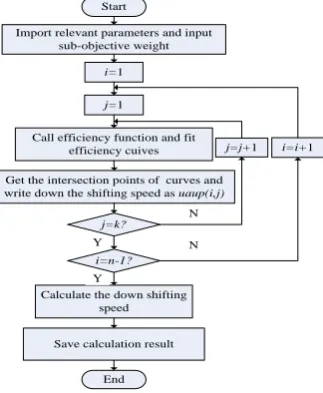
[image:4.612.304.464.91.219.2]Import relevant parameters and input sub-objective weight
i=n-1?
Start
i=1
j=1
Call efficiency function and fit efficiency cuives
Calculate the down shifting speed
Get the intersection points of curves and write down the shifting speed as uaup(i,j)
Save calculation result
j=j+1
j=k?
i=i+1
End Y
Y
[image:5.612.295.504.86.306.2]N N
[image:5.612.104.266.90.287.2]Figure 3. Flow chart of main program.
TABLE I.PARAMETERS AND
MATCHING RESULTS. Parameters and matching
results Values
Vehicle mass m 1750kg
Tire radius r 0.316m
Rolling resistance f 0.015
Aerodynamic drag CD 0.32
Frontal area A 2m2
The top speed uamax 135km/h
Acceleration time of 0-100km/h t 13.5s
Motor rated/peak power(kW) 42/85
Motor rated/peak speed(r/min) 3000/6100
Motor rated/peak torque(Nm) 134/270
AMT 1st gear ratio i1 1.75
AMT 2nd gear ratio i2 1.32
AMT 3rd gear ratio i3 1
The gear ratio of final drive i0 5.1
CALCULATION EXAMPLE
Powertrain Parameters
Based on the vehicle parameters and required performance indicators, the matching results of powertrain system are listed in Table I.
Shift Schedules
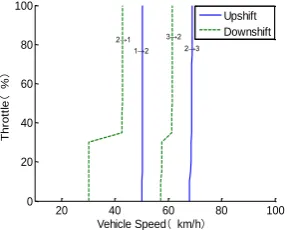
20 40 60 80 100 0 20 40 60 80 100
Vehicle Speed(km/h)
[image:6.612.309.446.85.198.2]T h ro tt le ( % ) 2→1 1→2 3→2 2→3 Upshift Downshift
Figure 4. Best dynamic shift curves.
10 20 30 40 50 60 70
0 10 20 30 40 50 60 70 80 90 100
Vehicle speed(km/h)
[image:6.612.100.244.86.201.2]T h ro tt le ( % ) 2→1 1→2 3→2 2→3 upshift downshift
Figure 5. Best efficiency shift curves.
0 20 40 60 80 100
0 2 4 6 8 10 12 14 T im e ( s )
Vehicle Speed(km/h)
Best dynamic performance shifting Best efficiency shifting
[image:6.612.307.470.257.384.2]
Figure 6. Acceleration process.
0 200 400 600 800 1000 1200
0 20 40 60 80 100 120 140
Time(s)
V e h icl e S p e e d ( km /h )
Target vehicle speed Actual vehicle speed
Figure 7. ECE+EUDC driving cycle.
SIMULATION RESULTS
To evaluate these shift schedules an EV powertrain model is constructed using the MATLAB/Simulink software. The model contains the modules of an ECE+EUDC driving cycle, a driving motor, an AMT, the vehicle longitudinal dynamics and shift logic [4].
The simulation results are presented in Table II. The energy consumption corresponding to the best efficiency shift schedule is 6.33 kWh, which is less than that to the best dynamic performance shift schedule. The results demonstrate that the working points of motor have been optimized to relatively high-efficiency area, which improves the average operating efficiency of the powertrain.
TABLE II.ENERGY CONSUMPTION IN AN ECE+EUDC CYCLE.
Shift schedules Energy consumption (kWh)
Best dynamic performance shift schedule 6.80
Best efficiency shift schedule 6.33
CONCLUSION
Based on the analysis of the driving motor characteristics of EVs, a new calculating method for a 2-parameter shift schedule based on the motor efficiency was put forward. The best efficiency shift schedule for a 3-speed EV was calculated using the proposed method. And the best dynamic performance shift schedule was also calculated for comparison purpose.
The shift schedules calculated above were applied to the powertrain model in the Simulink environment of MATLAB. The results of acceleration and an ECE+EUDC driving cycle simulation demonstrate that the best efficiency shift schedule can significantly improve the economic performance of vehicle by 6.91%, at the expense of dynamic performance reduction by 7.43%. The best efficiency shift schedule is more suitable for economic driving style.
ACKNOWLEGEMENTS
The work was supported in part by National Natural Science Foundation of China (Grant No. 51375402), Science & Technology Department of Sichuan Province (Grant Nos. 2015TD0021, 2016HH0010, and 2013JY0088), Sichuan Provincial Human Resources and Social Security Department, and Innovation Fund of Postgraduate at Xihua University (Grant No. ycjj2015150).
REFERENCES
1. Dawei Li, Xibang Fang, and Zhe Wu. 2011. “Design and Simulation Study of the AMT Optional-Power Shift Schedule of Miniature Electric Vehicles,” Journal of Chongqing University of Technology, 25(1):18-22.
[image:7.612.133.464.193.245.2]with Two Gears for PEV,” Journal of University of Science and Technology of China, 42, 68-72.
3. Shujiang Chen, Datong Qin, Minghu Hu and Jianjun Hu. 2013. “Pure Electric AMT
Comprehensive Shift Strategy Considering Dynamics and Economic Performances,” China Mechanical Engineering, 24(19): 2687-2691.