2016 Joint International Conference on Artificial Intelligence and Computer Engineering (AICE 2016) and International Conference on Network and Communication Security (NCS 2016)
ISBN: 978-1-60595-362-5
Volatility Forecast of Financial Performance Based on the
Logit and LS-SVM Mixed Model
Guan-Hua ZHAO
1,a,*, Qian WANG
1,b1Accounting Institute, Shandong University of Finance and Economics, Jinan, Shandong, China
a[email protected], b[email protected]
*Corresponding author
Keywords: Mixed Model, Financial Performance, Volatility Forecast.
Abstract. In order to predict the volatility of the financial performance of the listed companies more effectively, constructed the Logit and LS-SVM mixed model. In the empirical study, to financial performance volatility of Chinese listed companies as the object of study, with 5-fold cross-validation accuracy as the evaluation criteria, it is shown that the prediction accuracy using combined system constructed by the mixed model is significantly higher than that of single model, confirmed the validity of the model.
Introduction
Throughout present situation of the domestic and foreign research, the classified prediction methods mainly include single model method and the method of multi-model combination. Due to the uncertainty of the single model itself, in recent years, many scholars tried to apply multiple model prediction technologies to classification forecasting of financial performance.
There are many methods of multi-model combination, but it can be roughly divided into two categories: the classifier disturbance and the sample disturbance. The classifier disturbance uses multiple models Integrated on a data set to construct the multi-model combination system. The sample disturbance is divided into two categories, one is to use different training sample subset to construct single model, another one is to use alternative methods of multiple features, through accessing to subset with different features to construct single model, then using a certain algorithm to combine with the single model. Sun(2008) and Sun Jie (2009) were two of the earliest ones to study the classifier disturbance, all of them have carried out on weighted voting fusion for the predicted results of each single model, the experimental results all showed that the multi-model combination system on the accuracy and stability is better than that of single model. Tsai (2008) and Jiang Yanxia (2009) and other people have studied the two ways of the sample disturbance, they believe that more than one single model that have high precision of prediction and the large difference between each other can form a good combined and predicted system, in addition, the number of the mixed forecasting model is not the more the better. In recent years, Shi Jiandong(2013), Liu Jian(2013), Xu Hong (2014), Li Song(2015), Zhang Yunong (2015) and other people also have done some systematic studies on mixed model.
The Mixed Prediction Model Based on the Logit and LS - SVM The Logit Regression Model
Assume for the company i, there is an invisible latent variable is designed to depict the volatility characteristics of financial performance of company i, the behavior is determined by the following formula:
Y∗ ′ , 1,2, ⋯ , . (1)
Among them, N is the number of companies, also known as the sample size; W is k-dimensional explanatory variable used to describe the observable individual characteristics of the ith company, this article refers to all kinds of financial indicators. The discrete random variables that show values of 0 and 1, define it as follows:
Y 1, when sharp rise in the ith company′s financial performance0, When sharp fall in the ith company′s financial performance. (2)
The relationship between Y and Y∗ is as follows:
Y 1, Y0, Y∗∗ 00 . (3)
Namely when Y∗ 0, the performance of the company i increases sharply; When Y∗ 0, the
performance of the company i decreases sharply. Here the critical value is 0, but in fact as long as x contains the constant term, the selection of critical value is irrelevant, so it might be set to 0, thus:
P Y 1|x =P Y∗ 0 = P ε x′β 1 F x′β
P Y 0|x =P Y∗ 0 = P ε x′β F x′β . (4)
Among them, P ∙ is probability; F is distribution function about ε, it must be a continuous function and increase monotonically. The type of distribution function determines the type of binary choice, if the error term follows logical distribution, namely F x e ⁄ 1 e , binary model is called the Logit model.
The LS-SVM Model
The general description of least squares support vector machine(LS-SVM) is as follows: given a
set x , Y , i 1,2, ⋯ , L of include L training sample, the ith input data is x ∈ R , the ith output
data Y ∈ 1, 1 is binary type variable. LS -SVM is to construct a classification function:
f . (5)
If sample x can be classified correctly, namely solving the following optimization problem:
min ‖w‖ C ∑ ξ (6)
s.t. Y w φ x b 1 ξ . (7)
L w, b, α ‖w‖ C ∑ ξ ∑ α Y w φ x b ξ 1 . (8)
Among them, α is Lagrange multiplier, according to equation (8) making partial derivative respectively to w, b,ξ and α makes it equal to zero, given Y ∈ 1, 1 at the same time, after finishing we can obtain:
I 0 0 0 Z
0 0 Y
0 Z
0 CI
I Y
I 0
w b ξ α
0 0 0 1
. (9)
In the formula, 1 1,1, ⋯ ,1 ,ξ ξ , ξ , ⋯ , ξ , Z φ x Y , φ x Y , ⋯ , φ x Y ,Y
Y , Y , ⋯ , Y , ,α α , α , ⋯ , α , ,I is a unit matrix. Eliminating ξ and w, then reuse Mercer
conditions:
Ω Y Y K x , x . (10)
After finishing, the formula (10) is converted to:
b
α 0Y Ω YI C⁄ 01 . (11)
Order A Ω I C⁄ , which is a semi-positive definite matrix, and its inverse matrix exists. To solve the system of linear equations, we can obtain:
b , α A 1 Yb . (12)
Therefore, the classification function is:
f x sgn ∑ α Y K x , x b . (13)
In the formula (13), b and α is obtained from formula (12), Y be confirmed according to the nature of the training sample, that is to say when the samples are the companies whose financial performance increase greatly, Y 1, and otherwise, Y 1. K x , x is a kernel function. This article uses the Gaussian kernel, its expression is K x , x exp |x x| ⁄2σ , σ is kernel Parameter. Because f x is symbol function, when f x 1, the company is considered as increased performance, when f x 1, the company is considered as reduced performance.
Logit and LS-SVM Mixed Model
This paper introduces the LS -SVM into traditional Logit model, using the output of the LS - SVM to provide support to the output probability of Logit regression, with, respectively represent mean value of the overall probability of the training sample set, mean value of probability of the positive class samples (increased performance company) and mean value of probability of the negative samples (declining performance company).
p mean p |Y 1, i 1,2, ⋯ , N
̅ mean | 1, 1,2, ⋯ , . (14)
According to p , p, p , we can divide the output probability into four consecutive interval:
I 0,p , I p ,p , I p,p , I p , 1 . (15)
In the four interval, the prediction accuracy f , f , f , f of the LS - SVM could be obtained and expressed in formula is as follows:
f
∈ , , ,⋯,
∈ , , ,⋯, , x ∈ I , j 1,2
∈ , , ,⋯,
∈ , , ,⋯, , x ∈ I , j 3,4.
. (16)
Algorithm steps are as follows:
(1)For the training sample set, calculating the output probability of Logit regression model, calculate, and divide the interval [0, 1] into four continuous intervals.(2)On each interval, the training set is divided into four, recorded as, calculating the prediction accuracy of Logit and LS-SVM model respectively, recorded as.(3) According to the test set, on each interval, similarly, the test set respectively uses Logit and LS- SVM model to calculate.(4) according to the prediction accuracy of second step, establishing the following evaluation criteria: if ,using the predicted results of Logit; otherwise, using the predicted results of LS-SVM.
The model changed the classification rules of traditional Logit with 0.5 as boundaries, and in accordance with the prediction accuracy of four intervals divided by the output probability compared with the LS-SVM, namely, using the results of LS-SVM to provide support for fuzzy intervals of Logit, on this account we can amend the prediction results of Logit and increase the prediction accuracy of financial performance.
The Empirical Study
The Sample Source and Selection
All the samples come from CSMAR database, using all manufacturing listed companies 2013-2015 data on Shanghai and Shenzhen Stock Markets, and the lead time of prediction is half a year. Eliminating the ST companies and the companies whose Performance volatility is less than 50%, The final selection of the number of research samples are 264, and randomly selected 70% of them as a training sample (about 176), the remaining 30% as a test sample (about 88), in the training and test samples, the rise and fall of performance accounted for 50% respectively.
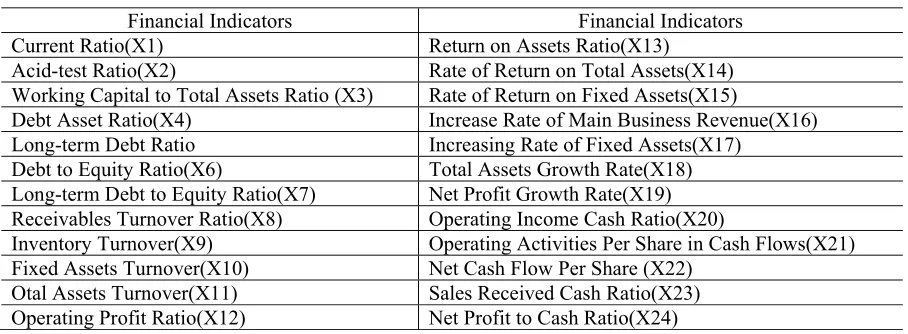
[image:4.612.80.534.583.750.2]Selection and Screening of Initial Indicators
Table 1. The Financial Indicators Selected in This Paper.
Financial Indicators Financial Indicators
Current Ratio(X1) Return on Assets Ratio(X13)
Acid-test Ratio(X2) Rate of Return on Total Assets(X14)
Working Capital to Total Assets Ratio (X3) Rate of Return on Fixed Assets(X15)
Debt Asset Ratio(X4) Increase Rate of Main Business Revenue(X16)
Long-term Debt Ratio Increasing Rate of Fixed Assets(X17)
Debt to Equity Ratio(X6) Total Assets Growth Rate(X18)
Long-term Debt to Equity Ratio(X7) Net Profit Growth Rate(X19)
Receivables Turnover Ratio(X8) Operating Income Cash Ratio(X20)
Inventory Turnover(X9) Operating Activities Per Share in Cash Flows(X21)
Fixed Assets Turnover(X10) Net Cash Flow Per Share (X22)
Otal Assets Turnover(X11) Sales Received Cash Ratio(X23)
Based on the reference of related research at home and abroad, this paper finally chose 24 financial indicators, as shown in table 1.
On this basis, using the 24 primary indicators to have significant differences test of single indicator, there are a total of eight indicators have significant differences at 5% significance level, they are: X11, X12, X13, X14, X15, X19, X20 and X21. Finally, using the method of "down" stepwise Logit regression, that is to say, removing variables from the eight indicators one by one, to observe whether the prediction accuracy can be improved or not until the prediction accuracy can't be improved.
Model Parameter Settings
The key to predicting the effect of LS-SVM model lies in the choice of kernel function and punish coefficient, and the inappropriate choice will lead to over fitting or insufficient fitting, this article selected Gaussian kernel function with strong nonlinear mapping ability. From the training samples obtained the optimal penalty factor C and Gaussian kernel parameters σ by using 5-fold cross-validation method, the search range is set to [2-10,2+10], and the step length are all set as 0.1.
The Empirical Result Analysis
On the training samples, the probability intervals are given by Logit are as follows:I1:[0,0.35),I2:[0.35,0.47), I3:[0.47,0.58),I4:[0.58,1], the prediction accuracy of the test sample set is shown in Table 2:
Table 2. The Prediction Accuracy of Single Model in Each Interval (%).
Model I1 I2 I3 I4
Logit 62.5 51.0 65.7 86.6
LS-SVM 62.8 65.5 78.1 80.3
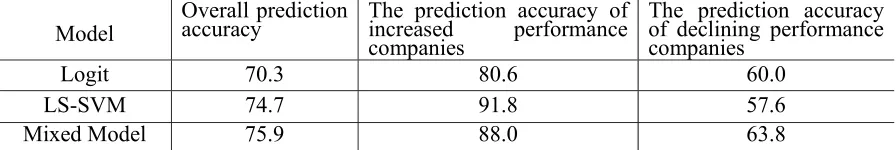
[image:5.612.83.531.481.556.2]According to the integrated criterion, using the prediction results of LS-SVM on I1, I2, I3 interval, using the prediction results of Logit on I2 interval, and compared with single model, obtaining the prediction results as is shown in table 3.
Table 3. Comparison of the Prediction Accuracy Between Single Model and Mixed Model (%).
Model Overall prediction accuracy The prediction accuracy of increased performance companies
The prediction accuracy of declining performance companies
Logit 70.3 80.6 60.0
LS-SVM 74.7 91.8 57.6
Mixed Model 75.9 88.0 63.8
As is shown in table 3: (1)As to the overall prediction accuracy, compared with single Logit model, LS-SVM has better prediction performance, achieved 74.7%, but in I4 interval, its performance is not as good as Logit model (86.6%), and the mixed prediction model has the best accuracy (75.9%); (2) As to the samples of declining performance, results show that the prediction accuracy of mixed model is highest, achieved 63.8%, increases 3.8% than the Logit model, and 6.2% higher than that of the LS-SVM model; (3)As to the samples of increased performance, the prediction accuracy of mixed model declined compared with the LS-SVM, but have significant increase than that of the Logit model.
Conclusion
of logit and LS-SVM, this demonstrated that the mixed model is effective as proposed in this paper. At the same time, the empirical study also shows that the prediction accuracy of increased performance companies are generally better than declining performance companies in different models, which shows that the selected index data for the distinguishing ability of declining performance companies still exist certain room for improvement.
Acknowledgement
This research is supported by the Shandong Provincial Natural Science Foundation Project (ZR2012GM009).
Reference
[1] Sun J., Li H., Listed companies’financial distress prediction based on weighted majority voting combi-nation of multiple classifiers, Expert System with Applications. 35(2008)818-827.
[2] Sun Jie, Li Hui, Genetic algorithm to optimize the grey case-based reasoning on prediction of financial distress, Journal of Scientific Research Management. 30(2009)119-125.
[3] Tsai C.-F., Wu J.-W., Using neural network ensembles for bankruptcy prediction and credit scoring, Expert System with Applications. 34(2008)2639-2649.
[4] Jiang Yanxia etc, Classification research based on the integration model of enterprise financial performance of support vector machines (SVM), Management Science in China. 02 (2009)56-60. [5] Shi Jianzhong, Cheng Longsheng, Niu Junlei, Listed companies’financial distress prediction based on RS-Bag classifier ensemble technology, Journal of Mathematical Statistics and Management. 05 (2013)34-39.
[6] Liu Jian, The Shanghai stock composite index prediction based on new combination algorithm, Computer Simulation. 12 (2013)45-49.
[7] Xu Hong, Shen Bin, Variable weight combination forecast method based on the auxiliary function. Journal of System Management. 06(2014)78-83.
[8] Li Song, Li Yan, Improving the forecast model based on OWHA operator combination, Computer Engineering and Application. 03(2015)34-39.