2017 2nd International Conference on Wireless Communication and Network Engineering (WCNE 2017) ISBN: 978-1-60595-531-5
A Comparative Study of Morphological Gradient and Its Improved
Form for CT Saturation Detection
Ather KHAN, Bao-hua WANG
*, Irfan TARIQ and Syed Raza ABBAS
Nanjing University of Science and Technology, P.R China
*Corresponding author
Keywords: CT saturation, Mathematical morphology, Morphological gradient.
Abstract. Magnetization of a Current Transformer (CT) is a non-linear characteristic, which can cause distortion in its secondary waveform, causing malfunction of protective relay. In this paper, two algorithms based on mathematical morphology, morphological gradient and improved morphological gradient have been compared for detection of CT saturation. The improved morphological gradient is effective in removing noise and separating transient information from the signal. Starting and end time of saturation can be detected using this algorithm.
Introduction
Major function of the protective CT is to transform the maximum possible current under normal as well as during faulty conditions, but its saturation is unavoidable. The amount of saturation depends on the level of fault current, residual flux, magnitude of the DC component, primary & secondary time constant of CT and burden on secondary side of CT. A number of methods have been suggested by researchers for detection of CT saturation.
Kang et al. [1] presented an algorithm based on calculation of flux available in core of CT using
secondary current. But, the prime drawback of this algorithm is that the value of residue flux remains zero during initial calculation, which is not true in all situations. Fernandez et al. [2] proposed
impedance-based CT saturation detection algorithm for busbar differential protection. But the necessity of both voltage and current signals for detection of CT saturation is the main shortcoming of this scheme. Later on, Pan et al. [3] described CT compensation algorithm based on conversion of
current waveform distorted by CT saturation to a compensated current waveform. However, this scheme is comparativly slower than other schemes because it requires one-and-half cycle (after inception of fault) to calculate compensated value of current.
Afterwards, [5] suggested scheme based on second and third current difference function. Nevertheless, fixed value of threshold may not be able to detect very low saturation condition and presence of noise & harmonics during fault condition. Thereafter, Hong et al.[5-6] presented Wavelet-based techniques for CT saturation detection. But susceptibility of Wavelet against noise, which may present during fault, is the fundamental disadvantage of the said two schemes. Later on various researchers have proposed different techniques of CT saturation detection based on different techniques.
Mathematical Morphology
Originally introduced by Matheron and Serra as a tool for investigating geometric structure in binary images, is a nonlinear theory for signal processing and analysis [5]. Other than most filtering methodologies emphasizing on the response of frequency domain, MM prefers to depict the profile of signal waveform in the pure time domain. The underlying basis of the morphological filtering technique is to process signals by a function, known generally as the Structuring Element (SE) or the structuring function. When operating upon a signal of complicated shapes, MM operations are capable of decomposing a signal into certain parts with specific purposes and highlighting them from the background. As known, most applications of power system analysis are the processing of a one-dimensional signal. A superimposed transient signal is normally taken to represent foreground regions, while the steady-state signal, no matter whether pre-fault or post-fault, acts as the background. Suppose that the original sampling is expressed by the function
X x
( )
whose domain isx
D
and the structure function is given byG y
( )
whose domain isg
D
.Therefore, two basicmorphological operators can be specified as erosion and dilation [6], defined as follows:
( )
min[ (
)
( )],
g
x x
y D
X
G x
X x
y
G y
D
∈
Θ
=
+
−
∀ ∈
(1)( )
min[ (
)
( )],
g
x x
y D
X
G x
X x
y
G y
D
∈
⊕
=
−
+
∀ ∈
(2)The gradient operator is an effective tool to show up the edge (rapid change) information and thus is appropriate to detect the transient superimposed on a steady-state signal. However, it is sensitive to most noises as well. In contrast, the morphological filter has outstanding denoising ability. Thereby, the combination of morphological filter and arithmetic differential operation naturally results in the emergence of a morphological gradient (MG). The basic MG is defined as the arithmetic difference between the dilated and the eroded original sampling function, with the elementary SE. The definition of MG is given by
MG=(
f
⊕
g
)( )-(
x
f
Θ
g
)( )
x
(3)MG is actually other than the gradient in mathematical fundamentals. Beside the successive sampled signal, the MG is determined by the difference between maxima and minima obtained within the domain of the flat SE. Analogous to the wavelet analysis; the concept of multi-resolution analysis is introduced to MM.
Multi-resolution Morphological Gradient
Multi-resolution morphological filtering can limit various noises effectively. Combined with the concept of MG, the goal of highlighting singularity information together with the depressing noise can be achieved in the meantime. Accordingly, a multi-resolution morphological gradient (MMG) is proposed [8]. The technique is introduced here to recognize and characterize the moments of transient change, such as fault occurrence and CT saturation. To extract the ascending and descending edges of
the transient signal, the MMG is designed to possess scalable flat lines SE
g
+and
g
−with different
origins. Where
g
+is the SE used for extracting the ascending edges andg
− is for the identifying the descending edges.Improved Form of Morphological Gradient
In this paper, studies have been made on the basis of improved morphological gradient,. This algorithm has two aspects, firstly filtering and secondly singularity detection, filtering and singularity detection are carried out with different types and lengths of SEs (
g
1,2
alternating filter method. In below equation
( )
stands for opening which is dilation of the eroded
signal.
( )
•
Stands for closing which is erosion of the dilated signal.2
1 1 1
( )
[(
)( )
(
)( )] 2
F x
=
f
g
•
g
x
+
f
•
g
g
x
(4)The improved morphological gradient is defined as
2 2
(
)( )
(
)( )
F
GRADE
=
F
⊕
g
x
−
F
Θ
g
x
(5)In this paper, the SE and the appropriate length and type of SE for CT saturation detection, noise elimination and singularity detection are studied by simulation.
Result and Discussion
[image:3.612.100.509.234.333.2]G1 G2 CB 1 CB 2 CB 3 CB 4 CB 5 CB 6 G3 CT F L1 80km L2 50km L3 100km
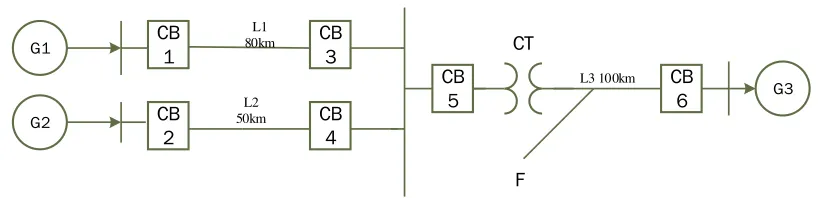
Figure 1. Single Line Diagram of Power System.
Figure 1 shows single line diagram of a power system network consisting of three sources represented by its Thevenin’s equivalent. These sources are connected to the common bus through bay L1, L2 & L3, respectively. The 500 kV transmission model is shown in Figure 1. The total length of line where studies have been made L3 is 100 km. The distribution parameters are given below.
Table 1. Distributed Parameters of Transmission Line.
Sequence km 1
R
−
Ω − mH-km 1
L
− µF-km 1
C
−
Positive sequence 0.014 31 0.869 4 0.013 72 Zero sequence 0.071 65 2.608 2 0.008 57
The saturated CT model selected from [11] core turns ratio 1
2
N
5
N
=
600
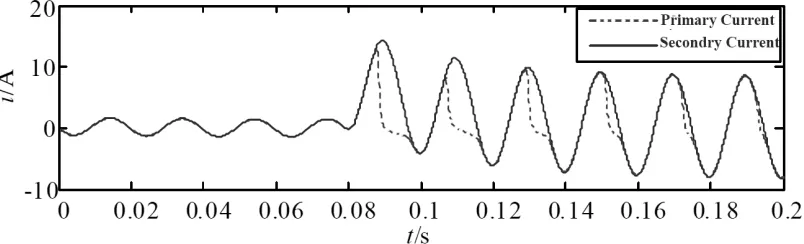
,The core has across-sectional area of 25.08 cm2, an average magnetic path length of 62 cm and a rated load of 30 VA. Sampling frequency is set at 20 kHz; all sides have the phase angle difference of 10°. At time 0.08s three-phase short circuit occurs on L3, the saturation current waveform shown in Figure 2 (limiting to the secondary side). CT primary short-circuit current RMS value I1 = 800 A; CT
secondary impedance R = 2Ω, L = 1 mH.
There are many factors that affect the saturation of current transformer CT, such as core structure parameters, magnitude of the steady-state component of fault current, non-periodic component of fault current, and load. For studies structural parameters and turn ratio of CT are fixed .Whereas effects of change in the magitude of steady-state component of short-circuit,non-periodic component, load etc are studied through simulation.
For the influence of steady-state component at 600A,900A,and 1200A , initial phase angle at 0o and seconday load is kept fixed at 5Ω .Then for non-periodic components,steady-state component of 600A and 5Ω load was kept unchanged, and initial phase-angle of fault current was taken 0o,30o,90o..After that initial phase angle was kept at 0o, steady state component was taken as 600A, and CT secondary load was changed.
serious. When non-periodic component is largest,as at 0o, the saturation is the most serious.and finally, the larger the secondary side load,the more easily the CT core is saturated and the more serious the secondary side current distortion is.After a number of simulations the following CT saturated curve was chosen.
Figure 2. CT Saturated Current Waveform.
Selecting Appropriate Type and Length of SE
Function of SE is similar to the filter window in general signal processing and type and length of SE will have direct impact on morphological operations.Selecting different length or type of SE will produce completely different results. Power signals are generally sinusoidal signals of power frequency 50Hz, which may be contaminated by different interferences such as , random background noise, transient spikes interference, and electromagnetic transient interferences. The disturbance will affect saturation detection and must be filtered before saturation detection. Generally SE should be close to the graphic charachteristics of signal to be analyzed as far as possible. The prionciple of filtering is to filter noise to the maximum extent and preserve singularity of the original signal.
In this paper ,for the selection of optimal structing element selection, simulations were carried out on saturated CT model presented.30db of white noise was added to the signal to be processed, while the length of all types of SEs was kept unchanged i.e 8 for the evaluation of their filtering effects.For this pupose Ball shaped, Diamond, Disc-Shaped, Semicircular, Straight line(flat), and Ladder type SEs were used..Analyzing the Root mean Sqaure erroer RMSE, and Signal to noise ratio SNR of all the selected types of SEs SE for filtering, it was found that Straight line(flat) and semicircular type SE has the maximum retention characteristics.
Length of SE
In the following table ,flat type SE was taken ,and then effects of different lengths were used to calculate the SNR and RMSE values as shown in table below.
Table 2. RMSE and SNR for Different SE Length.
SE size 2 4 6 8 10 12 14 16 18 20 24 30 RMSE 0.38 0.23 0.11 0.11 0.14 0.17 0.21 0.25 0.33 0.39 0.55 0.96 SNR(dB) 36.5 40.5 47.3 46.1 44.7 43.1 41.3 39.9 37.9 36.6 33.8 29.4
From the simulation studies of length of SE, 2,6,12,24.and from the table ,we can see that as the length of the SE is increased ,the RMSE is decreased first,and SNR increases,so as the ability to filter the interferences is enhanced . After the simulation studies it was found that the optimal interval for SE from 6 to 12 is more appropriate.So considering the filtering effects for different noises, time consumption and other factors, a flate SE with length 8 is selected for morphological filtering.
Similar simulation studies were made for selecting proper type and length of SE for singularity detection. Ladder type SE with a length of 4 was chosen as the most appropriate for this purpose.
Results
Figure 3 shows the ideal condition of CT saturation without noise interference. In the picture the first spike correspond to the time of fault and the second spike correspond to the CT saturation moment, third small spike correspond first saturation ending and so on.It can be seen that the peak of singular charachteristic is obtained at the time of fault and saturation time of CT.The time of fault occurance is 80ms ,whereas the CT enters into saturation at 86.5ms. In the absense of noise, morphological gradient and improved morphological gradient quite effective in detecting fault occurence and CT saturation moment.
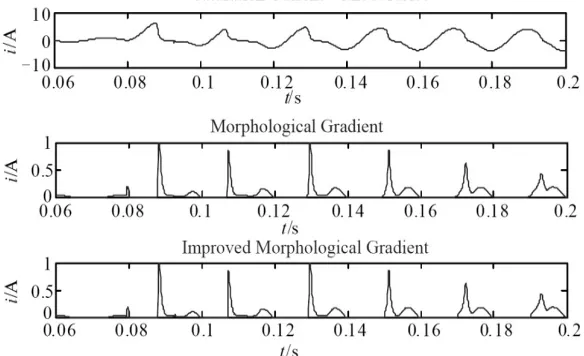
[image:5.612.163.455.287.465.2]Figure 4 shows that when 30dB white noise is added at 90 ms. In the presence of white noise the morphological gradient detection method is ineffective. Singular information at saturation can barely be obtained. whereas, the information at the end of saturation is completely noisy In the presence of white noise interference; the sensitivity of morphological gradient method is not good. We can see that in the improved morphological gradient method, the CT saturation occurs for the first time at 86.5 ms and ends at 98.5 ms, spikes corresponding to the end time are affected by white noise but still can be detected correctly. It can be seen from the above comparision that in the presence of white noise, the improved morphological gradient method can still effectively detect the singularity of the secondary current when saturation occur.
[image:5.612.157.449.503.647.2]Figure 3. Without noise comparision.
Figure 4. White Noise Comparisons.
Conclusion
comparative evaluation, the performance of the proposed scheme is found to be superior compared with the existing schemes. Moreover, the results obtained from the analysis demonstrate the effectiveness of the proposed scheme for the accurate detection of CT saturation.
References
[1]Y. C. Kang et al., “An algorithm for compensating the secondary current of current transformers,” IEEE Trans. Power Delivery, vol. 12, pp. 116–124, 1997.
[2]C. Fernandez, “An impedance-based CT saturation detection algorithm for bus-bar differential protection,” IEEE Trans. Power Delivery, vol. 16, pp. 468–472, 2001.
[3]Pan, J., Vu, K., Hu, Y.: ‘An efficient compensation algorithm for current transformer saturation effects’, IEEE Trans. Power Deliv., 2004, 9, (4), pp. 1623–1628.
[4]Dos Santos, E.M., Cardoso, G., Farias, P.E., de Morais, A.P.: ‘CT saturation detection based on the distance between consecutive points in the plans formed by the secondary current samples and their difference-functions’, IEEE Trans. Power Deliv., 2013, 28, (1), pp. 29–37.
[5]Hong, Y.Y., Chang-Chian, P.C.: ‘Detection and correction of distorted current transformer current using wavelet transform and artificial intelligence’, IET Gener. Transm. Distrib., 2008, 2, (4), pp. 566–575.
[6]Hong, Y.Y., Wei, D.W.: ‘Compensation of distorted secondary current caused by saturation and remanence in a current transformer’, IEEE Trans. Power Deliv., 2010, 25, (1), pp. 47–54.
[7]Lin, X., Zou, L., Tian, Q., Weng, H., & Liu, P. (2006). A series multiresolution morphological gradient-based criterion to identify ct saturation. IEEE Transactions on Power Delivery, 21(3), 1169-1175.
[8]Zhang, D. J., Li, Q., Zhang, J. F., & Wu, Q. H. (2002). Improving the accuracy of single-ended transient fault locators using mathematical morphology. International Conference on Power System Technology, 2002. Proceedings. Powercon (Vol. 2, pp. 788-792 vol. 2). IEEE.
[9]Gautam, S., & Brahma, S. M. (2009). Overview of mathematical morphology in power systems A tutorial approach. Power & Energy Society General Meeting, 2009. PES '09. IEEE (pp. 1-7). IEEE.