Method for estimating tyre cornering sti
ff
ness from
basic tyre information
P Hewson
School of Computing and Engineering, University of Huddersfield, Queensgate, Huddersfield HD1 3DH, UK. email: [email protected]
The manuscript was received on 13 September 2004 and was accepted after revision for publication on 15 August 2005.
DOI: 10.1243/095440705X35071
Abstract: This paper proposes a simple mathematical tyre model that estimates tyre cornering stiffness. The model is derived by considering the tyre to be a combination of two independent systems. The sidewalls are assumed to be negligibly stiff in the lateral direction, and hence their influence on the lateral dynamics of the tyre will be ignored. The belt and tread area of the tyre will be considered to be an homogeneous uniform band, and its stiffness will be estimated with reference to measured tyre data. The resulting model is estimated to yield cornering stiffness values within about 30 per cent of the actual measured values.
Keywords: tyres, vehicle dynamics, tyre modelling, vehicle handling, cornering stiffness, tyre properties
1 INTRODUCTION below about 3 m/s2, then it is often sufficiently accurate to consider the tyres to have a linear relationship between slip angle and lateral force [8]. Modern computers now have the power to solve very
complex vehicle dynamics models, and software such Unfortunately, the only way accurately to establish the actual cornering stiffness of a tyre is to test the as ADAMS has become widespread in the industry
[1,2]. The accuracy with which vehicle handling per- tyre, once again resulting in high costs.
This paper proposes a method for estimating tyre formance may be modelled is dependent upon the
accuracy of the parameters used in the model. One cornering stiffness on the basis of nothing more than the major dimensions of the tyre. It must be stated set of parameters that is often difficult to establish
is the characteristics of the tyres, specifically their at this point that the results are not expected to be highly accurate, since tyres are too complicated to ability to generate forces. Complex handling models
may require complex tyre models, and a number of be accurately predicted using simple measures, but the resulting values should provide a starting point such models have been developed. One such model
for the vehicle handling modelling process in the that has rapidly become well regarded and used in
absence of better data. The method also provides a the industry is called the ‘magic formula’, which has
simple way to compare the likely change in cornering been developed by Pacejka over the last 20 years
stiffness that results from a change in tyre dimensions [3–7].
(all other factors being constant). One problem with such models is the generation
of the many coefficients required in them, which is only possible with extensive laboratory testing and
hence can be an expensive process. However, many 2 MODEL DERIVATION handling studies can be successfully carried out by
the bulk of the structural support when moments are these net lateral displacements has any significant influence on the following analysis, and hence they applied through the contact patch. Hence, the lateral
stiffness of the belt is the critical factor in deter- are not shown in Fig. 1.
For small slip angles the belt of the tyre may mining the cornering stiffness of the tyre. It should be
noted that in tyre construction the ‘belt’ has a specific be considered to be symmetrically identical, and hence only one-half of the belt need be analysed, as meaning relating to the internal circumferential bands
in the structure of the carcass. For this paper, how- illustrated in Fig. 2. In Fig. 2 the contact patch has been omitted, and the forces are applied to the trail-ever, the belt refers to all parts of the tyre within the
tread region (i.e. only excluding the sidewalls). ing (or leading) edge of the contact patch. Inclusion of the contact patch would cause a further small lateral If the tyre is running at a small slip angle,a, and
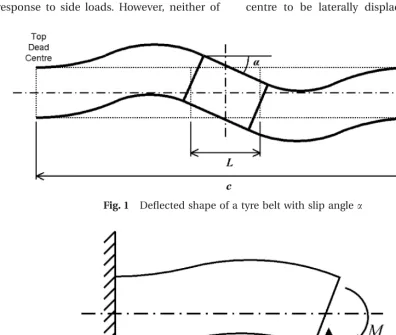
the belt of the tyre is imagined to be ‘cut’ at top displacement at the point of force application. This additional displacement will generally be less than dead centre and unwrapped, the belt would look as
shown in Fig. 1 (exaggerated). It will be noted that 3 mm for typical tyres in their linear operating range. Including this aspect would result in significantly the belt has assumed a characteristic ‘S’ shape. The
belt is aligned with the direction in which the tyre more complication to the mathematical model, and so is not considered necessary in this simple model. is pointing at top dead centre, the contact patch is
aligned with the direction the tyre is travelling, and The shape of the belt results from two influences, the self-aligning moment,M, and the shear force,W, the angle between the two,a, is the slip angle of the
tyre. In reality, the contact patch will be laterally which combine to generate contact patch twist during cornering. The easiest way to visualize the displaced from the centre-line of the belt, and the
entire belt will be laterally displaced from the centre- shear force is to consider the top dead centre of the tyre. With no shear force, the contact patch moment line of the wheel since the flexible sidewalls of a
radial tyre allow sideways movement of the entire would cause the two ‘ends’ of the belt at top dead centre to be laterally displaced from each other. belt in response to side loads. However, neither of
Fig. 1 Deflected shape of a tyre belt with slip anglea
[image:2.595.73.472.379.523.2] [image:2.595.65.462.381.716.2]This displacement discontinuity is prevented by the Substituting equations (4) and (5) into equation (3) yields
action of the shear force. The shear force may be considered to be two equal but opposite lateral forces
acting at the contact patch. Each of these forces Tyre cornering stiffness= 4Ebw3
3x[2p(r+wa)−L] (6) acts on one-half of the belt and is of a magnitude
to return the contact patch to the centre-line. Equation (6) defines the cornering stiffness. It Determination of the magnitude of W is given in contains the pneumatic trail, x, and the contact
Appendix 2. patch length, L, which are not necessarily known.
In the development of this beam model, shear force Fortunately, the contact patch length can be esti-deflection has been neglected. It is conventional to mated with reasonable accuracy if the sidewall neglect shear deflection when the length–width ratio vertical deflection is known [10]. Tyres always tend exceeds about 5 : 1 [9], since with such a ratio the to run in quite a small band of sidewall deflections, error introduced is less than 4 per cent. The belt probably as a result of the need to avoid excessive of a typical tyre has a circumference–width ratio of heat build-up (suggesting smaller sidewall deflection) between 12 : 1 and 8 : 1, so the equivalent ‘beam’ while maintaining the largest possible contact patch shown in Fig. 2 would have a length–width ratio of (suggesting larger sidewall deflection). Experience between 6 : 1 and 4 : 1 (or a little less if the contact suggests that properly inflated road car tyres tend to patch is allowed for), which implies that the validity run with a sidewall deflection of about 15 per cent of the assumption to neglect shear deflection is of the undeflected sidewall height, while race car marginal. The intention of this model is, however, to tyres run nearer 10 per cent (primarily owing to represent the belt of the tyre with a very simple their extreme widths). Simple geometry leads to the model, and then apply statistical methods to ensure following expression for the contact patch length conformance with real data. It is not the intention of
this model accurately to predict exact behaviour on
L=2(r+wa) sin
C
acosA
1− swar+wa
BD
(7) the basis of the absolute physical properties of thetyre. It is therefore suggested that the assumption of
The derivation of equation (7) is given in Appendix 2. pure bending and no shear deflection is sufficiently
Once the contact patch length is found, the pneumatic valid for typical passenger car tyres.
trail is also easy to establish. For small slip angles the The slip angle resulting from these two forces is
contact patch meets the ground at the undeflected analogous to the end slope of a simple cantilever
position, then follows a straight line at an inclination beam. For simplicity it will be assumed that the belt
equal to the slip angle away from the undeflected is linear, elastic, and isotropic. Therefore the slip
position. This is shown in Fig. 3. angle is given by
At any point along the length of the contact patch the lateral force produced is approximately pro-a=M[(c−L)/2]
4EI (1) portional to the lateral displacement from the
undeflected position, and hence the triangle thus The complete derivation of equation (1) is given in described represents a lateral force distribution. Appendix 2. MomentMis defined as Longitudinal forces are not represented on the diagram. The resultant sum of the lateral forces can
M=Fx (2)
be considered to act at the centroid of the triangle. Hence, the pneumatic trail is given by
Tyre cornering stiffness is defined asF/a, and hence
x=L
6 (8)
Tyre cornering stiffness= 8EI
x(c−L)×2 (3)
Substituting equations (7) and (8) into equation (6) (Note that at this point the cornering stiffness is
leads to doubled to take account of the fact that there are
actually two ‘beams’.) Tyre cornering stiffness
ParametersIandcare given by
= 2Ebw3
(r+wa)2sin{acos[1−(swa)/(r+wa)]}
×(p−sin{acos[1−(swa)/(r+wa)]}) I=bw3
12 (4)
Fig. 3 Detail of the contact patch shape
Equation (9) gives an estimate of the tyre cornering compound. Although the strain rate can be assumed stiffness using parameters that can easily be found. to be very low, and the hardness of the rubber for typical tyres could be assumed to be between 50 and 1. Parametersr, w,andacan be read offthe sidewall
65 Shore A [11], the shape factor is an unknown of the tyre.
quantity. The purpose of the plies in the belt of the 2. Parameterscan always be assumed to be 0.15 for
tyre is to provide structural support for the rubber. road tyres and 0.1 for racing tyres, unless a better
They are bonded to the rubber and restrict the strain figure is known.
of the rubber in particular directions. In other words, 3. Parameterb is the material thickness of the belt.
the plies are there specifically to increase the effective It is suggested that a value of 0.015 m be used for
shape factor of the rubber, but the resulting shape road tyres, and a value of 0.01 m for race tyres
factor is almost impossible to estimate, and thus it (to allow for lighter construction methods). The
is not possible to establish a value forEon the basis value ofbis not critical since the belt is, in reality,
purely of the physical properties of the belt. a complex non-homogeneous structure, and hence
To address this problem, the value of E may the stiffness of any particular belt cannot be
be derived from experimentally measured tyre data known with any accuracy. The value ofb should
by establishing the value that best conforms to a be considered in conjunction with the value ofE,
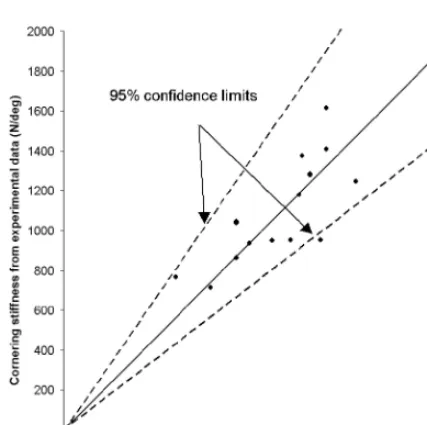
range of tested tyres. Figure 4 shows a comparison with the factorEbrepresenting the typical stiffness
of theoretical cornering stiffness, as predicted by of belts in general. The value ofE, for any given
equation (9), against measured cornering stiffness for value ofb, may be established by comparison with
a range of road tyres. The range of tyres covered is real tyre test data, as demonstrated in section 3 of
from 145/80R13 to 235/75R15. It should be noted this paper.
that equation (9) yields results in the SI units of 4. ParameterEis the belt compression modulus. The
N/rad, but the units used in Fig. 4 are N/deg. This is suggested value is 27×106N/m2, and section 3
simply because the units N/deg are more typically describes how this was arrived at.
used by vehicle and tyre engineers. A simple regression technique gave the best fit when a value of 27×106N/m2 was chosen for E. This value falls 3 ESTIMATION OFE
within the typical range for rubber and suggests quite a high shape factor (perhaps somewhere between 1 The belt primarily consists of rubber, and hence the
and 3). The solid diagonal line is the line of best fit compression modulus should be similar to that of
for the data and is, by definition, a perfect correlation rubber. Unfortunately, the compression modulus
between the predicted and the measured data. The of rubber is highly variable and dependent on many
[image:4.595.134.414.59.277.2]REFERENCES
1 Blundell, M. V. Full vehicle modelling and simu-lation using the ADAMS software system. Autotech Congress, November 1991, Seminar 16, paper C427/ 16/170.
2 Rao, S. P., Roccaforte, D., Campbell, R.,andZhou, H. Developing an ADAMS model of an automobile using test data, SAE paper 2002-01-1567, May 2002. 3 Bakker, E., Nyborg, L., and Pacejka, H. B. Tyre modelling for use in vehicle dynamics studies, SAE paper 870421, 1987.
4 Bakker, E., Pacejka, H. B.,andLidner, L.A new tire model with an application in vehicle dynamics studies, SAE paper 890087, 1989.
5 Pacejka, H. B. and Bakker, E. The magic formula tyre model. In Proceedings of 1st Tyre Colloquium, Delft, October 1991;Veh. Syst. Dynamics, 1993,21. 6 Pacejka, H. B.The role of tyre dynamic properties.
In Smart vehicles, 1995, pp. 55–68 (Swets and Fig. 4 Measured tyre cornering stiffness versus
pre-Zeitlinger, The Netherlands). dicted tyre cornering stiffness (measured data
7 Pacejka, H. B.andBesselink, I. J. M.Magic formula supplied with the kind permission of MSC
tyre model with transient properties, Veh. Syst.
Software Limited)
Dynamics, 1997,27, 234–249.
8 Dixon, J. C. Linear and non-linear steady state vehicle handling,Proc. IMechE, Part D: J. Automobile Engineering, 1988,202(D3), 175.
(i.e. two standard deviations) for the data presented.
9 Den Hartog, J. P.Strength of materials, 1949, p. 108 These confidence limits show that for the range of (McGraw-Hill).
data studied there is a 95 per cent likelihood that a 10 Clarke, S. K. (Ed.) Mechanics of pneumatic tyres, predicted value will be within±30 per cent of the United States Department of Commerce, National
actual measured value. Bureau of Standards, November 1971, p. 460.
11 Clarke, S. K. (Ed.) Mechanics of pneumatic tyres, The values for b and E have been established
United States Department of Commerce, National with reference to only a very limited set of measured
Bureau of Standards, November 1971, p. 11 tyre data. The relationship between the thickness of
the belt, the hardness of the rubber compound, and the structure and number of the belt plies could be
APPENDIX 1 investigated in more detail. The number of belt plies
is usually quoted on the tyre, the hardness of the
Notation rubber compound is relatively easy to measure,
and the belt thickness could easily be established. Symbols in final model Analysis of these parameters could lead to a more
a tyre aspect ratio (tyre section height/tyre reliable estimate for the value ofE, and may reduce
section width) the scatter of the data presented in Fig. 4.
b belt thickness (m)
E compression modulus of the belt (N/m2) r wheel radius (m)
4 CONCLUSIONS s sidewall vertical deflection when loaded (unitized per cent)
A simple model has been derived to estimate the w belt width (m) tyre cornering stiffness on the basis only of tyre
information that is readily available. Comparison
Symbols used in derivation
with measured data indicates that, to two standard
deviations (95 per cent confidence), a result pre- c tyre outside circumference F lateral (cornering) force dicted using this model is likely to be within 30 per
cent of the actual measured result, although it must I second moment of area of the belt radial cross-section
be noted that the measured dataset is probably too
[image:5.595.33.247.57.269.2]M moment on the tyre contact patch (self-aligning moment)
W shear force in the belt x pneumatic trail
a slip angle
APPENDIX 2
Derivation of the shear load,W, and the slip angle,a
From the ‘Myosotis formulae’, the end deflections caused byMandWare given by
Def
M=
M[(c−L)/2]2
2EI (10)
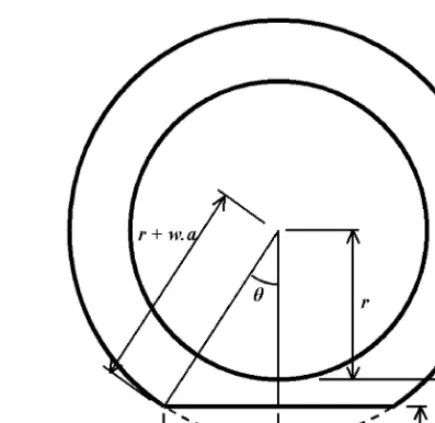
Fig. 5 Tyre under vertical load, showing the defor-Def
W=
W[(c−L)/2]3
3EI (11) mation at the contact patch
To avoid a discontinuity in the belt, the end deflection caused byMmust equal the deflection caused byW
is longitudinally stiff, and so, while Fig. 5 appears to M[(c−L)/2]2
2EI =
W[(c−L)/2]3
3EI (12) show a reduction in the length of the belt when
loaded, this is actually compensated for by a certain
which simplifies to amount of circumferential bulging away from the
contact patch area. W= 3M
c−L (13) From simple trigonometry
The Myosotis formulae also provide expressions for h=acos
A
r+wa−swar+wa
B
(16)the end slope of the beam, and, by the principle of superposition, the total end slope of the beam
and (and hence the slip angle of the tyre) is given by
h=asin
A
L/2r+wa
B
(17)a=M[(c−L)/2]
EI −
W[(c−L)/2]2
2EI (14)
Combining equations (16) and (17) yields Substituting equation (13) into equation (14) leads to
asin
A
L/2r+wa
B
=acosA
r+wa−swa
r+wa
B
(18)a=M[(c−L)/2]
4EI (15)
which leads to Derivation of the length of the contact patch
The tyre is assumed to deform as shown in Fig. 5. L=2(r+wa) sin