2017 2nd International Conference on Communications, Information Management and Network Security (CIMNS 2017) ISBN: 978-1-60595-498-1
The Analysis of Visible Light Communication System in the Elevator
Qian HUANG
1,*, Ya-hua SUN
2and Wei TANG
21
State Key Laboratory of Information Photonics and Optical Communications, Beijing University of Posts and Telecommunications, No. 10, Xitucheng Road, Haidian District, Beijing, China,
2
School of Electronic Engineering, Beijing University of Posts and Telecommunications, No. 10, Xitucheng Road, Haidian District, Beijing, China,
*Corresponding author
Keywords: Visible light communication, LEDs distribution, Field of View (FOV), Q factor.
Abstract. This paper studies the visible light communication in the elevator. In the tiny space (1.6*1.4*2.3m), it has different distribution of illumination performance compared to the room of common size (5*5*3m). This paper analyzes 4 different lamp distribution strategies, each of which has different performance in the illumination distribution and luminous power. This paper shows that the rectangular line structure of the lamp distribution has the advantages in the illumination and communication. Under this lamps distribution, the average illumination intensity is 497.79[lx]; The mean signal-to-noise ratio (SNR) is 52.99[dB] and the optimal FOV is 65°. The results of simulation show it in the tiny space of the elevator, it can satisfy the demand of illumination and communication.
Introduction
Compared to the traditional lighting techniques, Light-emitting-diode(LED) lights have lower power cost, longer utility time. Light-emitting-diode(LED) technology not only provides economical, efficient illumination and a long service time, but also paves the way for smart lighting and visible light communication. VLC exists many advantages. Firstly, visible light provides unlimited bandwidth to the shortage of current spectrum problem. Secondly, the light waves are unable to penetrate through the door and the wall, hence it won’t cause any signal interference. Thirdly, VLC can be widely applied in many RF sensitive environments such as mines, power plants and hospitals, due to the fact that light waves never generate any electromagnetic interference[1]. Fourthly, VLC is applicable as long as illumination infrastructure exists, hence the hard cost is decreased.
Most people have such experience: when you surf on the Internet or take the phone, and you get into an elevator, the communication quality becomes bad. To solve the communication barrier in the elevator, a visible light communication system is proposed. Because of the limitation of single light power, LED arrays are used in most situation to satisfied the demand of uniform illumination and communication quality. There are some optimal strategies over the illumination and communication equality. The studies manly focus on optimal strategies over the light distribution, power and emission angle [2,3,4]. The light distribution has great impact on the illumination characteristic and communication equality in the visible light communication of elevator.
Illumination of Light Source
In the visible light communication of elevator, the light is emitted by LED. Assuming that the model of the LED light is the ideal Lambert radiation. The illumination model of the light shows as
follows: m is the order of Lambert’s emission, and
1/2 is the half-power angle of irradiance ofan LED. The irradiation angle distribution is given as follows:
2 / 0
2 / , 2 / )
( cos 2
1
m m
R (1)
The Lambert’s order m is related to the semi-angle at half-power of an LED
1/2:
cos 1/2
ln
2 ln
m (2)
Radiation strength of light source is given by Eq. 3[5]:
mt
m
P
I
cos2 1
(3)
When =0, I
0 is the central strength of illumination of LED.The LED illumination intensity of the PD detector for any spot in the elevator is given by Eq. 4:
cos
)
(
cos
)
0
(
2 d
m
D
I
E
(4)LED Light Placement Strateges
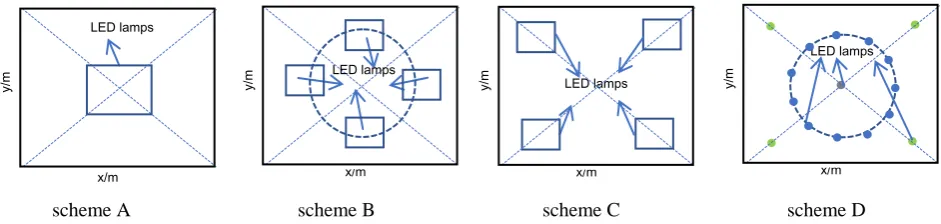
Scheme A (central structure): The LEDs are all within 1 lamps. The lamp is placed around the center of the ceiling. Scheme B (four lamps circle structure): The LEDs are within 4 lamps, where each lamp is placed symmetrically as the locus of a circle. Scheme C (diagonal line structure): The LEDs are within 4 lamps, where each lamp is placed near one corner of the ceiling, lies in the diagonal line of the ceiling. Scheme D (seventeen lamps circle structure): The LEDs are within 17 lamps, 12 of these lamps is placed as the locus of a circle. One lamp is placed in the center. The left 4 lamps is distributed in the corner of the elevator [6].
For each scheme, every lamp receives the same information from the central processing unit for downlink communication in the VCL system. The total power of these lamps is equal. In different schemes the the power of each lamp is equal to the total power divided by the number of lamps.
[image:2.595.68.539.615.727.2]scheme A scheme B scheme C scheme D
Figure 1. Structure of LED array placement.
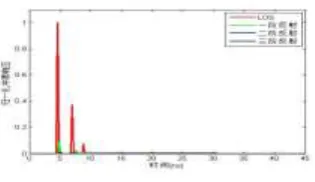
Figure 2 shows the one pulse response results which take different reflection times into consideration in the elevator.
y/m
x/m LED lamps
m
y/m
x/m LED lamps
m
y/m
x/m m LED lamps
y/m
x/m LED lamps
Figure 2. One pulse response results.
[image:3.595.234.362.252.347.2]From Figure 2 we can see the different reflection influence to the one pulse response results: straight flection: 90.68%, first-order reflection: 8.72%, second-order reflection: 0.6%. Hence in this paper, we analysis the illumination distribution that consider light of sight and one time reflection. Figure 3 demonstrates the direct and first-order reflection channel model of the system.
Figure 3. Direct and first reflection channel model of visible light in elevator.
To make the illumination intensity uniformly distributed, the paper takes the illumination intensity mean square error (MSE) to measure the performance of 4 schemes and use MSE to optimize the locaiton of the lamps in each scheme. Table 1 shows the parament for simulation.
[image:3.595.55.540.448.670.2]
Table 1. The Parameter for The Simulation.
Semi-angle at half power 60[deg] Reflection coefficient of ceil and walls 0.5
Total transmitted power 16[W] Reflection coefficient of floor 0.3
Center luminous intensity I(0) 80[cd] Gain of an optical concentrator 3
FOV of detector 70[deg] Receiver height 1.3[m]
Detector physical area of a PD 1[cm2] Absolute temperature 285[K]
Refractive index of a lens at a PD 1.5 O/E convert efficiency 0.53
Gain of an optical filter 1
[image:3.595.53.537.450.667.2]scheme A scheme B scheme C scheme D
[image:3.595.125.475.712.765.2]Figure 4. The illumination distribution of the four schemes
Table 2. Shows the the optimal performance of illumination intensity of the schemes.
Type of scheme A B C D
average values(lx) 738.19 648.84 497.79 490.31
mean square error 247.29 147.26 25.52 48.84
Direct link Reflet link
receiver
LED
Table 2 shows that the scheme C has the smallest MSE. The smallest MSE means scheme C has the most uniformly illumination distribution. The average illumination intensity is 497.79lx, which is satisfied the illumination request (300lx-1500lx). For both scheme A and scheme B have the bigger average illumination. However, the most illumination is concentrated on the center, scheme D performs better than scheme C in the ordinary room (5*5*3). In the elevator, the reflection rate of the inner and the higher receiver platform lead to a different illumination distribution result.
The Receive Power Model
The scheme C is choosen as the example to analyze the receive model. The left schemes are similar to it. The coordinate of the lamps are A, B, C, D. In which, the placement of the lamp is symmetry.
In the VLC communication system, the DC gain is given as follows[6]:
c c sm T g
d A m H 0 0 cos cos 2 1
0 2 (5)
A is the active area of the detector; d is the disatance source and the receiver; is the emission angle; is the receiver angle; Ts
is the gain of optical filter; c is the receiver field of view.The channel gain after a reflection is shown as follows[5]:
c c s i i i mR T g
D D A m H 0 0 cos cos cos 2 cos 1
0 2 ,1 2
1 , 2 2 1 , ref (6) i
is the source array emission angle; i,1 is the angle of incidence of reflection spot; 2 is the emission angle of the reflection; i is the angle of incidence of receiver surface; is the emission coefficient; Di,1 is the distance between emission spot and receiver spot; D2,i is the
distance between reflection spot and final receiver spot.
g is the light concentrator gain is given by Eq. 7:
c c c n g 0 0 sin2 2 (7)
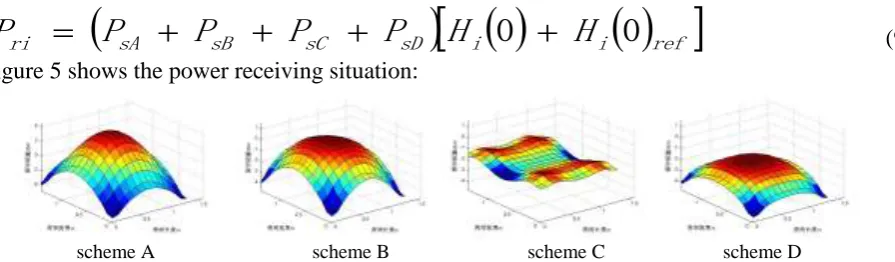
The relationship between receiver power and emission power:
ref
sr H H P
P 0 0 (8) When the number of LED array is 4. Light receiver power is equal to direct power with a reflection power:
sA sB sC sD
i i
ref
ri
P
P
P
P
H
H
[image:4.595.53.543.342.768.2]P
0
0
(9)Figure 5 shows the power receiving situation:
scheme A scheme B scheme C scheme D
[image:4.595.78.526.638.769.2]The Influence of FOV on SNR Distribution
The SNR is a value to measure the communication quality.
In the receiver, light detector turns the received light signal into current I , given by
ri aP
R
I (10)
ri
P is the received total light power. Ra is the O/E convert efficiency.
22 2
2
flection a
thernal
shot R P
I SNR
(11) q is the electronic charge; B is the equivalent noise band width; Ibg is background current;
2
I is the noise bandwidth factors.
thermal
is the thermal noise, given by
3 3 2 2 2
2 2 2
thermal
16
8 A I B
g kT B
AI G
kT
m k
k
(13)
K is Boltzmann’s constant, Tk is absolute temperature, G is the open-loop voltage gain,
is the fixed capacitance of photo detector per unit area, is the FET noise factor, gm is the FET
trans-conductance, I3 is the noise bandwidth factor.
This paper use the qualification parameter Q to measure SNR distribution and evaluate the communication qualification for multiple users in in different space, defining as:
) var(
2 SNR
SNR
QSNR (14)
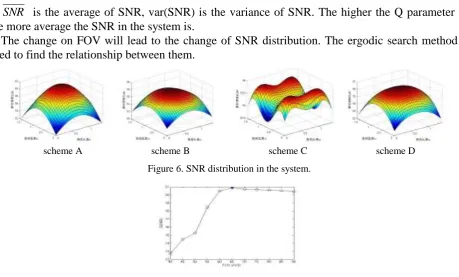
SNR is the average of SNR, var(SNR) is the variance of SNR. The higher the Q parameter is,
the more average the SNR in the system is.
The change on FOV will lead to the change of SNR distribution. The ergodic search method is used to find the relationship between them.
scheme A scheme B scheme C scheme D
[image:5.595.68.528.458.735.2]Figure 6. SNR distribution in the system.
Figure 7. The influence of FOV on QSNR.
most uniform communication experience despite the location of users. The stability of the system is most excellent. However, in the range of 65° to 90°, the influence on QSNR is not very obvious. When the FOV is smaller than 65°, the QSNR increases as detector power getting bigger. When the FOV is over 65°, the bigger signal noise causes the decreasing of the QSNR.
Summary
In this paper, an indoor visible light system in the elevator is performed, and the result of the simulation shows that the lamp placement has dramatic influence on the performance of illumination and communication quality. To satisfy both illumination and communication performance, the scheme distributes four LEDs array on the diagonal line. In this lamps distribution situation, the average illumination intensity is 497.79[lx]; The mean signal-to-noise ratio(SNR) is 52.99[dB] and the optimal FOV is 65°. the FOV of 65° enables the system with a more uniform communicaiton quality. This system is satified the illumination request and communication requirement. It provides a new method to solve the poor communication situation in the elevator.
References
[1] Fu Q, Chen C Y, Hong Y, et al., Key technologies of improving system performance of indoor visible light communication, J. Automation & Information Engineering. 2(2010): 4-7.
[2] Collins S, Mulyawan R, Rajbhandari S, et al., A simple wide field of view concentrator for free space visible light communications, C. Summer Topicals Meeting Series, IEEE. 2015:43-44.
[3] Hussein A T, Elmirghani J M H, High-speed indoor visible light communication system employing laser diodes and angle diversity receivers, C. International Conference on Transparent Optical Networks, IEEE. (2015):1-6.
[4] I. Din, H. Kim, Energy-efficient brightness control and data transmission for visible light communication, J. Photon. Technol, IEEE. Lett. 26(2014): 781-784.
[5] Komine, T, and M. Nakagawa, Fundamental analysis for visible-light communication system using LED lights, J. IEEE Trans. on Consumer Electronics. 50(2004):100-107.