2017 2nd International Conference on Computer, Mechatronics and Electronic Engineering (CMEE 2017) ISBN: 978-1-60595-532-2
An On-line Feature Extraction Method for Transformer Vibration Signals
Li LI and Ya-qi SONG
School of Control and Computer Engineering, North China Electric Power University, Baoding 071003, Hebei Province, China
Keywords: Transformer vibration, FFT, Wavelet packet transform, Feature extraction.
Abstract. FFT or wavelet transform method is usually used in transformer on-line vibration signal analysis apparatus. In order to extract features of transformer vibration signals reliably and accurately, a method which is based on FFT and wavelet packet transform was proposed for type identification of transformer vibration signals using k-nearest neighbor (KNN). First of all, the known transformer vibration signals were decomposed by FFT and several characteristic bands which were used to determine the layer number of wavelet packet decomposition were extracted; secondly, the feature vectors contained energy entropy of a selective wavelet packet decomposition for characteristic bands was obtained; Finally, KNN classifiers are utilized for pattern recognition. Five kinds of winding and core state vibration signals under conditions of transformer short-circuit test in the laboratory were extracted and recognized using the above methods. Simulation results demonstrate that the method proposed can extract the features of transformer vibration signals accurately and reliably, providing a good reference for the recognition of partial discharge signals.
Introduction
According to incomplete statistics, the system accident caused by the transformer fault occupies a large proportion [1 - 3]. It is very important to study on-line condition monitoring and fault diagnosis of transformer winding and iron core. It can help to discover the fault hidden trouble in the transformer timely and repair it in time, then reduce or avoid the sudden accident caused by the transformer winding and iron core defect.
There are many methods of detecting transformer winding deformation and iron core looseness, including short circuit test, low pressure pulse method, frequency response method, gas chromatography and so on. But none of these methods can reflect the operation status of the transformer on line [4].
In this paper, the vibration signals of 6 channels on the surface of the tank during the short - circuit operation are obtained when the transformer winding and core are in normal and fault condition for an SZ - 20000 / 35KV three-phase winding transformer. Then a feature extraction method based on FFT and wavelet packet transform is proposed. In this method, firstly, the characteristic frequency of the vibration signal is identify by FFT, then wavelet packet is used to extract wavelet packet coefficient energy entropy of characteristic frequency quickly. The energy entropy is used to judge the state of transformer windings and iron cores. It provides a new idea for on - line monitoring of transformer vibration signal.
Feature Extraction of Vibration Signals Based on FFT and Wavelet Packet
The FFT method is simple in principle, fast in analysis, and can well represent the typical frequency characteristic of the signals. It is one of the most widely used signal processing methods. But the Fourier frequency is defined with a global sine wave, regardless of time, and assuming that the signal waveform is steady - state and periodic, the number of cycles of the sample is an integer. So it is also limited to the nonlinear and non-stationary of the complex vibration signal by FFT.
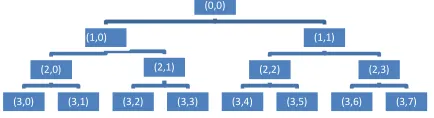
[image:2.612.198.415.388.447.2]Wavelet packet transform has excellent time-frequency resolution characteristics, which can effectively extract the characteristics of the vibration signal [17-20]. Fig. 1 is a three-layer wavelet packet decomposition diagram. Compared with wavelet transform, wavelet packet analysis provides a finer decomposition method. It not only decomposes the low frequency band but also decomposes the same scale for high frequency. Therefore, it improves the resolution of the signal analysis, and more characteristic information is extracted. However, the computational complexity of wavelet packet analysis greatly reduces the real-time performance of signal feature extraction because of the high-resolution analysis of all the high frequency bands.
Figure 1. The decomposed diagram of the three layers wavelet packet.
In this paper, FFT and wavelet packet transform combined, the characteristics of the transformer vibration signal extraction, Firstly, the signal is analyzed by FFT, and the main frequency components of the signal are obtained. Then according to these frequency components, the wavelet packet decomposition level is adaptively selected, and the frequency band is decomposed and reconstructed. In this method, based on the spectrum obtained by FFT, the wavelet packet decomposition level can be adaptively selected and the frequency band can be selectively analyzed for high resolution. It improves the accuracy of wavelet packet analysis; meanwhile, it also reduces the computational complexity and improves the real-time performance of feature information extraction.
Transformer vibration signal feature extraction method based on FFT and wavelet packet steps are as follows:
(1) FFT analysis of transformer vibration signal. The first m frequency peaks are screened by using the mean value of the spectrum as the characteristic frequency of the signal F = [f1, f2, f3, ..., fm].
(2) Calculate the minimum interval frequency f of each frequency in the signal characteristic frequency F. Then calculate the wavelet packet decomposition level n. The frequency interval Fi of
each frequency segment after the n-layer wavelet packet decomposition is less than f.
Fi= (Fs/2)/2^n (1)
Where Fs is the sampling frequency.
(4) Select the wavelet packet decomposition band coefficient containing the signal characteristic frequency F as the characteristic vector T = [t1, t2, ..., tl] of the vibration signal.
(5) Calculate the energy entropy of T as the eigenvector of the final vibration signal.
This feature vector can comprehensively show the status information of transformer windings and iron cores.
Test Environment and Conditions
In order to verify the previous method and realize the diagnosis of transformer core and winding faults, this paper analyzes and tests the transformer vibration signal. A short circuit test was performed on a SZ-20000 / 35KV three-phase winding transformer in the laboratory. 6 ICP-type acceleration vibration sensors (100mV / g) are permanently mounted on the transformer tank. The sampling data of 6 channels are acquired synchronously. Data sampling frequency is 10240Hz. Short circuit test is divided into 10 times the load current to the upper limit, respectively: 10%, 20%, 30%, 40%, 50%, 60%, 70%, 80%, 90%, 100%.
In the experiment, the vibration signals of the transformer under normal operating conditions were obtained, and the fault conditions of the transformer windings and the iron core were also simulated. Faults are artificial settings. Among them, the core failure is the state of the top of the iron core fastening bolts off; Winding failure include: extraction of the top two layers of low-voltage winding pad, analog winding pad off, as winding failure 1; concave deformation of the side of the winding, radial Deformation does not exceed 1cm, simulated radial deformation of the winding, as a winding fault 2; so that both the concave deformation of the winding failure and winding pad off, mixed winding fault simulation, as a winding fault 3.
Transformer Vibration Signal Analysis
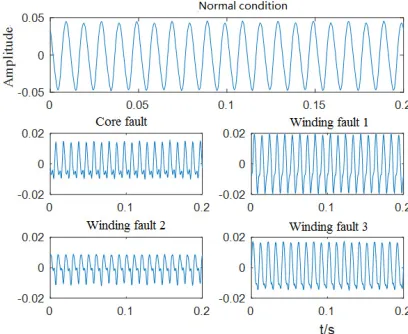
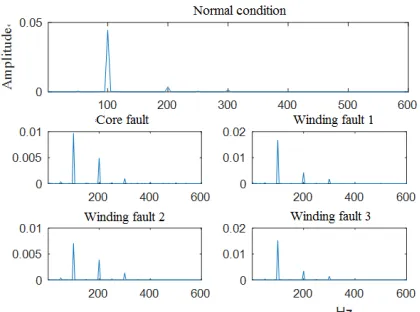
[image:3.612.202.406.427.594.2]Fig. 2 is a time-domain plot of the acquired vibration signal under the normal and core fault and winding fault transformer conditions in the short-circuit test, the load current is 90% of the upper limit of the rated current. It is the second channel. Fig. 3 is the corresponding spectrum of the signal in Fig. 2.
Figure 3. Frequency spectrum of the signal at short-circuit state.
The amplitude of the fundamental frequency component (100Hz) of vibration signal is the largest which is the main frequency component under normal working condition in Fig. 3. This confirms that the fundamental frequency of the transformer winding and the core is 2 times of the grid frequency. Therefore, the change of 100Hz fundamental frequency component is also often used as the main characteristic parameter of the transformer state diagnosis. According to the method proposed in reference [11], we find that the method can well distinguish the core fault and the winding fault from other fault conditions of the transformer, and the algorithm is simple and the recognition rate is high. However, the change of amplitude of the 50Hz component and its frequency multiplication component is relatively small, and only the sensor near the point of failure can be obviously monitored. In addition, this method for winding fault 2 and winding fault 3 resolution is not obvious, and it can't effectively identify. It may produce undetected if only using the result of FFT spectrum analysis. Wavelet packet analysis is an excellent representation of non-stationary signals. In this paper, FFT and wavelet packet analysis are used to make full use of the advantages of both.
Transformer Vibration Signal Feature Extraction
In this paper the transformer vibration signals measured by short circuit test are extracted and diagnosed based on FFT and wavelet packet. Take the data shown in Fig. 2 as an example.
(1) The FFT spectrum analysis is performed on the vibration signal. Using the spectrum mean value as the threshold, the first m frequency peak is filtered, as the characteristic frequency F = [ f1, f2,
[image:4.612.201.411.68.224.2]f3, ..., fm], as shown in Table 1.
Table 1. The main characteristic frequency of transformer vibration signal.
Short - circuit test Characteristic frequency /Hz Normal condition 100 200 250 300 400 500 700
Core fault 100 150 200 250 300 400 600 700
Winding fault 1 100 150 200 250 300 400 450 500
Winding fault 2 100 150 200 250 300 350 400 500
Winding fault 3 100 150 200 250 300 400 600
(2) The minimum interval frequency f = 50 Hz as shown in Table 1. Signal sampling frequency fs =
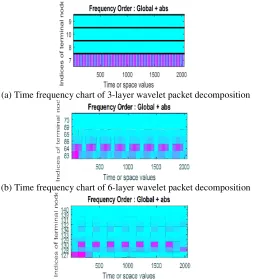
(a) Time frequency chart of 3-layer wavelet packet decomposition
(b) Time frequency chart of 6-layer wavelet packet decomposition
[image:5.612.180.435.65.344.2](c) Time frequency chart of 7-layer wavelet packet decomposition
Figure 4. Time frequency map of wavelet packet.
[image:5.612.190.422.434.512.2](3) According to the characteristic frequency of the vibration signal obtained in Table 1, the selective wavelet packet high resolution analysis is carried out, and 18 wavelet packet reconstruction signal components are obtained, as shown in Fig. 5. The frequency range of each reconstructed signal wavelet packet is shown in Table 2.
Figure 5. Process of wavelet packet transform based on FFT
(4) The 18 wavelet packet decomposition band coefficients obtained by the step (3) are used as the characteristic vector T = [ t1, t2, ..., t18 ] of the vibration signal.
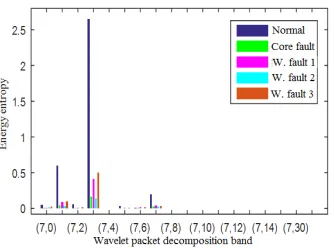
(5) The energy entropy of T is calculated, and the energy entropy of 18 characteristic vectors of the final vibration signal is obtained, as shown in Fig.6.
Table 2. The frequency spectrum of reconstructed signal decomposed by wavelet packets.
Wavelet packet components
Frequency Range /Hz
Wavelet packet components
Frequency Range /Hz
Wavelet packet components
Frequency Range /Hz
(7,0) 0-40 (7,6) 201-240 (7,12) 401-440
(7,1) 41-80 (7,7) 161-200 (7,13) 441-480
(7,2) 121-160 (7,8) 481-520 (7,14) 361-400
(7,3) 81-120 (7,9) 521-560 (7,15) 321-360
(7,4) 241-280 (7,10) 601-640 (7,30) 681-720
[image:5.612.117.498.603.706.2]Figure 6. Energy entropy distribution of vibration signal feature vector.
Case Analysis and Comparison
In order to verify the superiority of the feature extraction method based on FFT and wavelet packet, this paper uses FFT and 3 - layer wavelet packet decomposition feature extraction method separately. Then, using KNN method to classify the vibration signal of transformer, the average positive rate of six channel data is analyzed and compared.
In the short circuit test, 50 samples under 5 kinds of working conditions (normal state, iron core failure, winding fault 1, winding fault 2 and winding fault 3) were selected. There are 200 samples. 150 samples were randomly selected as training samples, and the remaining 50 were test samples.
Fig.7 is an average diagnostic accuracy of the data of each channel with the load current in the short circuit test. It can be seen that when the loading current is 60 % to 80 % of the upper limit current in the short circuit test, the positive rate of each channel data is the most stable and the highest.
[image:6.612.208.399.432.550.2]Fig. 8 is the average positive rate of 6 channel data using three feature extraction methods. It can be seen the average positive rate of the FFT& wavelet packet feature extraction method can reach more than 90 % in various state of transformer. It is proved that it is more advantageous to improve the correct rate of transformer winding state diagnosis by using the FFT method and using the 3-layer wavelet packet decomposition feature.
[image:6.612.208.402.579.713.2]Summary
In this paper, the time and frequency domain of the vibration data of the six channels of the transformer are compared and analyzed in detail. Then combining the advantages of FFT and wavelet packet, the main characteristic frequency of transformer winding is analyzed by FFT, and the accurate wavelet packet decomposition level is obtained. According to the main characteristic frequency, the selective wavelet packet high resolution decomposition is carried out, and the energy entropy of wavelet packet decomposition coefficient is calculated as the characteristic vector of the transformer.
By comparing the average positive rate of the feature method with the FFT extraction feature and the 3-layer wavelet packet decomposition method, the superiority of the proposed method is verified. The average positive rate of the six channel data is more than 90 % under the condition of each transformer. The feature extraction method based on FFT and wavelet packet provides an efficient method for feature extraction of transformer vibration signal.
Acknowledgement
Project supported by Hebei Provincial Natural Science Foundation, China (F2014502069) and the Fundamental Research Funds for the Central Universities (2016MS116, 2016MS117).
Reference
[1] Jin Wenlong, Chen Jianhua, Li Guangfan, et al. Statistics and Analysis on Power Tranformer Damages Caused by Short-Circuit Fault in 110kv and Higher Voltage Classes [J]. Power System Technology, 1999, 23(6):70-74.
[2] Yang Tingfang, Zhou Lixing, Li Jinglu, et al. Power Transformer Fault Diagnosis Based on Optimal Weights Combined Model [J]. Power System Technology, 2013, 37(1):190-194.
[3] C. Bengtsson. Status and Trends in Transformer Monitoring. IEEE Transaction on Power Delivery. 1996, 11(3):1379~1384.
[4] García Belen, Burgos Juan Carlos, Alonso Angle Matias. Transformer tank vibration modeling as a method of detecting winding deformations-part I: theoretical foundation [J]. IEEE Transaction Power Delivery, 2006, 21(1): 157-163.
[5] Xie Poan. Study on Application of Vibration Analysis to the Condition Monitoring of Power Transformers Windings [D]. Shanghai Jiaotong University, 2008: 32-34.
[6] Wu Shuyou. Research on Condition Monitoring and Fault Diagnosis of Power Transformer Based on Vibration Signal Analysis [D]. University of Science and Technology of China, 2009.
[7] Ji Sheng-chang, Li Yan-ming, Fu Chen-zhao. Application of On-Load Current Method in Monitoring the Condition of Transformer’s Core Based on the Vibration Analysis Method[J]. Proceedings of the CSEE, 2003, 23(6):154-158.
[8] Ji Sheng-chang, Liu Wei-guo, Shan Ping, et al. The Application of the Wavelet Packet to the Monitoring of the Core and Winding Condition of Transformer [J]. Proceedings of the CSEE, 2001, 21(12): 24-27.
[9] Ji Sheng-chang. The Study of Winding and Core Vibration Characteristics and Application in Fault Monitoring of Transformer [D]. Xi'an Jiaotong University. 2003
[11] Ma Hongzhong, Geng Zhihui, Chen Kai, et al. A New Fault Diagnosis Method for Power Transformer Winding Deformation Based on Vibration [J]. Automation of Electric Power Systems, 2013, 37(8):89-95.
[12] Fang Guo-zhi, Yang Chao, Zhao Hong. Detection of Harmonic in Power System Based on FFT and Wavelet Packet [J]. Power System Protection and control, 2012, 40(5):75-79.
[13] Ji Shengchang, Cheng Jin, Li Yanming. Research on Vibration Characteristics of Windings and Core of Oil-Filled Transformer [J]. Journal of Xi’an Jiaotong University, 2005, 39(6): 616-619,658.
[14] Shao Yuying, Xu Jian, Rao Zhushi, et al. On-line Diagnosis for a Transformer Winding’s State Under Short-Circuit Shock [J]. Journal of Vibration and Shock, 2011, 30(2):173-176.
[15] Yu Jianyu. Transformer Short-Circuit Impact Condition Monitoring System Application [J]. Shanghai Electric Power. 2005, 18(2):200~202.
[16] Transformer Manufacturing Technology Series Editing Committee. Transformer winding manufacturing process. Beijing: Mechanical Industry Press, 1999.