2017 International Conference on Computer Science and Application Engineering (CSAE 2017) ISBN: 978-1-60595-505-6
Application of WebGIS Technology in Information Management of
Agricultural Science and Technology Park
Chun Li1, Guoqi Lou1, Jianwei Ma1 and Lu Yang2* 1
Yunnan Kunming Taiwan Farmer Pioneer Park Administrated Committee, Kunming, China
2
College of Information Science & Engineering, Yunnan University, 650500 Kunming, China
ABSTRACT
WebGIS has many advantages such as widely recognition, abundant users, platform crossing, low average cost and easy to use for the final users. Now, it has been widely used in all walks of life. This paper introduced the WebGIS technology first, and then introduced the functions of the "Kunming Shilin Taiwan farmers entrepreneurial park" information platform and the way to realize these functions. Finally we use WebGIS technology to develop the geographic information visualization platform based on ArcGIS and realize the visual management function of the park-based infrastructure (including enterprises, roads, pumping stations, water storage Pool, water supply pipes, video monitoring points and other geo-features) based on map. For now, the platform has been in operation for the management of "Kunming Shilin Taiwan Farmer Pioneering Park".
INTRODUCTION
present, WebGIS has been used by many researchers in the agricultural field, G Modica, X Liu and other researchers hava applied WebGIS to analyze terraces [2], assess crops [3], prevent crop diseases [4], control agricultural pollution [5] and design the farming system [6]. However, WebGIS is less used in the field of agricultural irrigation, and now we will use WebGIS to develop a visualization system that can manage the park's water supply lines and agricultural irrigation.
MATERIAL AND METHODS
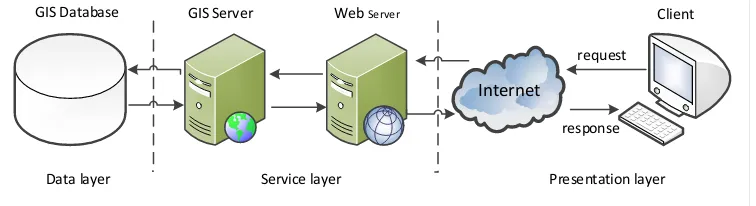
WebGIS is a combination of Web technology and traditional GIS. With the global, low cost, high efficiency and openness of Web technology, WebGIS is widely used in all walks of life and allows geographic information systems to enter the ordinary people’s daily life. The basic architecture of WebGIS is shown in Figure 1.
Internet
GIS Database GIS Server Web Server Client
Data layer Service layer Presentation layer
request
[image:2.612.111.489.265.368.2]response
Figure 1. WebGIS basic architecture diagram.
Similar to Web applications, the basic workflow for WebGIS is that users use the Web client (typically a browser) to send HTTP (HyperText Transfer Protocol) requests to the Web server. The Web server forwards requests for GIS functionality to the GIS server, the GIS server reads the required data from the GIS database, processes the request, and then returns the data, map, or other operation results to the client via an HTTP response display. WebGIS server is the most important part of the WebGIS architecture. A modern, complete WebGIS server must at least provide the release and processing of maps to support interoperability, fast performance, robust scalability and highly customizable functionality between different vendors' products at the Web service level. A geodatabase is a collection of data about a certain geographic feature in a region. It can store different types of geographic data, such as vector data (points, lines and polygons) and raster data (satellite and aerial imagery). Geographic database is the foundation of WebGIS application support. The value of a WebGIS application often depends on the quality of its data. The client plays two roles in the WebGIS application: on the one hand, it represents the final user interface of the entire system, and be responsible for interacting with the user such as collecting user input, sending a request to the server, and displaying the results to the user. On the other hand, the client, especially the fat client, can also run some spatial analysis tasks, such as the dynamic classification of geographic features to make thematic maps, clustering over-intensive points, and interpolating dot-like information to generate heat map and so on.
telecommunications, transportation, environmental protection, planning, land, natural resources, national defense, public security, aerospace, commercial and other fields, and has become a number of local government departments to manage geographic information standards. This paper uses ESRI's ArcGIS Server to realize Web-based campus geographic information visualization management and analysis. ArcGIS Server is ESRI's Web Map Server product, which represents the cutting-edge development of today's WebGIS technology and enables developers and system designers to implement a centrally managed GIS. A single, centrally managed GIS application (web application) can reduce development costs, support multiple users, and reduce the cost of installing and managing desktop applications on client machines.
Figure 2. Map GPS positioning and coordinate acquisition.
Geometric cross method is used to compute the area and perimeter of the plot under the jurisdiction of 1.3 million mu of core area based on ArcGIS@[8] platform.
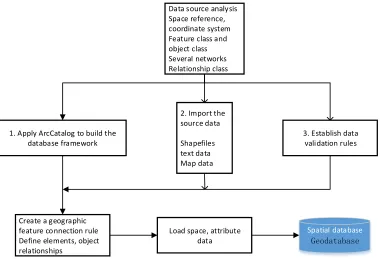
The project platform uses a new generation of object-oriented spatial data model-GeoDatabase as a smart campus integrated information platform spatial data model. The model uses standard relational database technology to express the data model of geographic information, and integrates spatial data and attribute data into the standard relational database in the background to realize the seamless integration of spatial data and attribute data. It is an intelligent spatial data model based on RDBMS (Relational Database Management System). GeoDatabase uses object-oriented technology to abstract the real world into feature classes (points, lines, faces) that contain spatial information and object classes (feature attributes) that do not contain spatial information. Each feature class and object class has attributes, behaviors and rules, and the elements are associated with objects such as relational classes, geometric networks, and so on. Construction process of spatial database is shown in Figure 3.
Data source analysis Space reference, coordinate system Feature class and object class Several networks Relationship class
1. Apply ArcCatalog to build the database framework
2. Import the source data
Shapefiles text data Map data
3. Establish data validation rules
Create a geographic feature connection rule Define elements, object relationships
Load space, attribute data
Spatial database
[image:4.612.109.489.272.531.2]Geodatabase
Figure 3. Construction process of spatial database.
This paper designs and establishes reasonable spatial data element class, object class and relation class based on the new generation object-oriented spatial database model-Geodatabase, and designs efficient, stable, safe and practical agricultural science and technology park information management space database.
Wisdom Park Integrated Information Platform Geodatabase is a collection of geographic feature data sets, object classes, and relational classes in accordance with certain models and rules. That is, the spatial database of the agricultural science and Technology Park organizes the geographic data according to the hierarchical data objects, including the Feature Dataset, the Feature Class and the Object Class.
basic data, park roads, park buildings, water supply lines, water supply pipelines, pumping stations, water storage pool, soil moisture monitoring points, water level monitoring points. Among them, the basic data layer within the range of the park area are high-precision remote satellite images.
In spatial database of the wisdom park, the feature data set is a collection of feature class of the shared space reference system. In the spatial database, all feature classes in the same geographic feature dataset must have the same spatial reference, that is, the coordinate system, the spatial domain, and the precision are the same. Spatial reference is an important part of database design. Agricultural Science and Technology Park spatial database built in Microsoft SQL Server 2008 SDE database, achieve the creation of spatial database process through ArcCatalog. The spatial database layers are shown in Figure 4.
Agricultural Science and Technology Park Information Management Spatial Database
Basic data Professional data
High precision remote sensing image
Entrance
enterprises Plots Park road
Water supply line
Reservoir Pumping station Water points
Video monitoring
[image:5.612.104.494.245.350.2]point
Figure 4. Spatial Database Layer Structure.
RESULTS
The GIS-based geographic information visualization management platform designed based on 3S (Geographical information System, Remote Sensing, Global Positioning System) technology to realize the map-based campus infrastructure’s (mainly including park enterprises, plots, park roads, pumping stations, reservoirs, water supply lines and video monitoring points) visual management. Its main functions include: display for high-precision remote sensing image map of the park, park information space query and browsing, park enterprise visualization management, park block visual management, park road visualization query and management, park water supply pipeline visual query and management, park pumping station visualization query and management, park cistern visualization and management, park video monitoring point visualization management, map measurement (length, area, perimeter), map GPS positioning, thematic map production and map export and others.
CONCLUSIONS
Pioneer Park. Through the development of the system, the platform realizes the modernization of resource and environment information management of the park and meets the requirement for the entire park information query, retrieval, extraction and application form each department. Meanwhile, the platform also achieves the rapid update of the park resources and environmental information, which has improved the efficiency for departments and visitors to obtain the park information and achieve the park information resources online sharing and services.
REFERENCES
1. Murray, A. T. 2002. “GIS and multicriteria decision analysis (review),” J. Geographical Analysis, 34(1): 91-92.
2. Modica, G., Praticò, S., Pollino, M., and Fazio, S. D. 2014. Geomatics in Analysing the Evolution of Agricultural Terraced Landscapes, M. Computational Science and Its Applications – ICCSA 2014. Springer International Publishing.
3. Liu, X., Yan, Z., Xia, Y., Tian, Y., and Cao, W. 2006. “WebGIS-based system for agricultural spatial information management and aided decision-making,” Transactions of the Chinese Society of Agricultural Engineering, 22(5):125-129.
4. Laisheng, X., Zhengxia, W., Xiaohong, P., Min, W., and Guangzhou, Y. 2009. Remote Diagnosis and Control Expert System for Citrus Agricultural Diseases and Insect Pests Based on BP Neural Network and WebGIS.
5. Shi, J. C., Jian ming, X. U., Shi, Z., Xie, Z. M., and Liu, X. G. M. D. 2003. “Practise and application of agricultural non-point source pollution information system based on WebGIS,” Journal of Zhejiang Agricultural University.
6. Huang, F., and University, N. A. 2009. “Design and implementation of model and webgis-based digital farming support system,” Journal of Nanjing Agricultural University, 32(1):12-17.
7. Shan, Y., Tysklind, M., Hao, F., Ouyang, W., Chen, S., and Lin, C. 2013. “Identification of sources of heavy metals in agricultural soils using multivariate analysis and GIS,” Journal of Soils & Sediments, 13(4): 720-729.
8. ESRI. ArcGIS Server Administrator and Developer Guide. 2004.
9. Nie, Y., Zhou, Y., Yu, J., and Ren, Y. 2004. “Gradation of agricultural land based on GIS and the fuzzy-material analysis method,” J. Transactions of the Chinese Society of Agricultural Engineering, 20(5): 297-300.