Nelson, M, Bradbury, Jane, Poulter, J, McGee, A, Mesebele, S and Jarvis, L
School Meals in Secondary Schools in England
Original Citation
Nelson, M, Bradbury, Jane, Poulter, J, McGee, A, Mesebele, S and Jarvis, L (2004) School Meals in Secondary Schools in England. Research Report. Department for Education and Skills, London, UK.
This version is available at http://eprints.hud.ac.uk/id/eprint/13443/
The University Repository is a digital collection of the research output of the University, available on Open Access. Copyright and Moral Rights for the items on this site are retained by the individual author and/or other copyright owners. Users may access full items free of charge; copies of full text items generally can be reproduced, displayed or performed and given to third parties in any format or medium for personal research or study, educational or notforprofit purposes without prior permission or charge, provided:
• The authors, title and full bibliographic details is credited in any copy;
• A hyperlink and/or URL is included for the original metadata page; and
• The content is not changed in any way.
For more information, including our policy and submission procedure, please contact the Repository Team at: E.mailbox@hud.ac.uk.
School Meals in Secondary
Schools in England
Michael Nelson, Jane Bradbury, Jenny Poulter,
Alice McGee, Siphosami Msebele and Lindsey Jarvis
King’s College London
National Centre for Social Research
Nutrition Works!
No 557
School Meals in Secondary
Schools in England
Michael Nelson, Jane Bradbury, Jenny Poulter, Alice McGee, Siphosami Msebele and Lindsey Jarvis
King’s College London
National Centre for Social Research Nutrition Works!
The views expressed in this report are the authors’ and do not necessarily reflect those of the Department for Education and Skills or the Food Standards Agency
Table of contents
EXECUTIVE SUMMARY...IV INTRODUCTION...IV
KEY FINDINGS...IV
METHODS...VI
DISCUSSION AND CONCLUSIONS...VI
RECOMMENDATIONS...VIII
1 INTRODUCTION ... 1
1.1 BACKGROUND... 1
1.2 AIMS AND OBJECTIVES... 2
1.3 PROJECT OVERVIEW... 2
1.4 NATIONAL NUTRITIONAL STANDARDS: HISTORICAL PERSPECTIVE... 2
1.5 CAROLINE WALKER TRUST GUIDELINES FOR SCHOOL MEALS... 4
1.6 TYPES OF SCHOOL MEALS CATERING CONTRACTS... 5
2 SAMPLING, RECRUITMENT, DATA COLLECTION AND CODING ... 8
2.1 SAMPLING AND RECRUITMENT... 8
2.2 DEVELOPMENT OF DATA COLLECTION TOOLS AND PILOTING... 11
2.3 DATA COLLECTION... 13
2.4 DATA PREPARATION... 16
2.5 STATISTICAL ANALYSIS... 17
3 THE CATERING SERVICE, COOKING PRACTICES AND THE EATING ENVIRONMENT... 18
3.1 THE SCHOOL MEALS SERVICE... 19
3.2 COMPETING OUTLETS... 20
3.3 EATING ENVIRONMENT: THE DINING ROOM... 22
3.4 COOKING PRACTICES... 23
3.5 HEALTHY EATING ACTIVITY... 24
4 CONTRACTS AND SPECIFICATIONS... 26
4.1 RESPONSE RATE... 27
4.2 CONTENT OF DOCUMENTATION... 27
5 FOOD AVAILABILITY... 38
5.1 MEETING THE NATIONAL NUTRITIONAL STANDARDS AND ADDITIONAL RECOMMENDATIONS... 39
5.2 INVENTORY ANALYSIS... 42
5.3 FOOD PROVISION AND THE NUTRITIONAL STANDARDS... 48
5.4 SET MEALS AND THE CWT GUIDELINES... 48
5.5 FOOD PROVISION AND THE CWT GUIDELINES... 52
5.6 FACTORS ASSOCIATED WITH MEETING CWT GUIDELINES... 52
6 WHAT SECONDARY SCHOOL PUPILS EAT AT LUNCHTIME... 54
6.1 WHAT DO CHILDREN EAT?... 55
6.2 WHAT FACTORS WERE ASSOCIATED WITH FOOD PURCHASES?... 56
6.3 NUTRIENT CONTENT OF SCHOOL MEALS... 59
7 DISCUSSION AND CONCLUSIONS... 66
7.1 SURVEY REPRESENTATIVENESS AND QUALITY OF DATA... 66
7.2 CONCLUSIONS REGARDING THE CATERING SERVICE, COOKING PRACTICES AND EATING ENVIRONMENT... 67
7.3 CONCLUSIONS FROM ANALYSIS OF SPECIFICATIONS... 67
7.4 CONCLUSIONS FROM INVENTORY ANALYSIS AND TRAY CHECK... 67
7.5 OVERALL CONCLUSIONS... 68
8 RECOMMENDATIONS ... 70
8.1 PRIMARY RECOMMENDATIONS... 71
8.2 FURTHER SUGGESTIONS... 72
9 ACKNOWLEDGMENTS... 73
List of tables
Table 1.1. Major changes in school meals provision post 1980. ...3
Table 1.2. The national nutritional compulsory standards: At least two items from each food group must be available every day...4
Table 1.3. Additional recommendations for school lunches...4
Table 1.4. Summary of Caroline Walker Trust nutritional guidelines for school meals. ...5
Table 1.5. Organisation and types of documentation defining the school meals service. ...6
Table 1.6. Broad types of contractual agreements for provision of school meals services. ...6
Table 1.7. Types of subsidies operating between schools/LEAs and providers. ...7
Table 2.1. Characteristics of participating and non-participating schools, the issued sample and all schools...9
Table 2.2. Multiple deprivation score (MDS) for participating, non-participating and the issued sample schools...10
Table 2.3. Response rates, by type of school and whether or not they agreed to take part in the study. ...10
Table 2.4. Main reasons given for non-participation ...11
Table 2.5. Data collection tools, primary purpose and level of collection of data...11
Table 2.6. Distribution by school year, age and gender of 5 695 pupils participating in the present study. ...15
Table 3.1. Catering service provider in 79 secondary schools in England. ...19
Table 3.2. Type of contract or service level agreement in 57 secondary schools in England. ....19
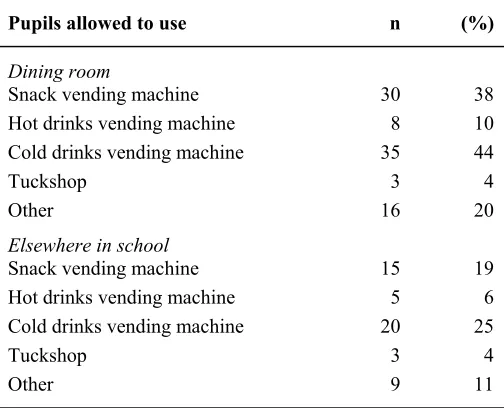
Table 3.3. The number (%) out of 79 secondary schools in England that had vending machines and tuckshops in the dining room and elsewhere in the school that pupils were allowed to use at lunchtime...21
Table 3.4. The number (%) of school caterers that offered various types of foods and beverages at morning break in 79 secondary schools in England...21
Table 3.5. Where school caterers believed pupils bought food from outside school in 51 secondary schools in England. ...22
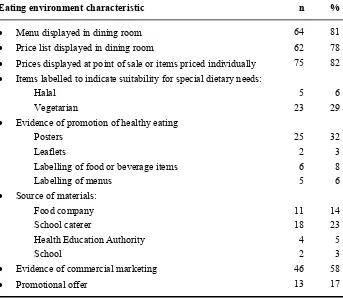
Table 3.6. Assessment of the eating environment in 79 secondary schools in England...23
Table 3.7. Usual method of cooking fish and meat products...24
Table 3.8. Usual method of cooking potato products ...24
Table 3.9. Type of training in healthy eating or healthy cooking received by head cooks, catering managers or catering staff in 19 secondary schools in England...25
Table 3.10. The number of caterers that reported seeking the opinion of pupils, parents and governors in 53 secondary schools in England. ...25
Table 3.11. Median (IR)* price for ‘more healthy’ and ‘less healthy’ options for schools that had a policy of making ‘healthier’ options cheaper (n indicates number of items on which median price is based). ...25
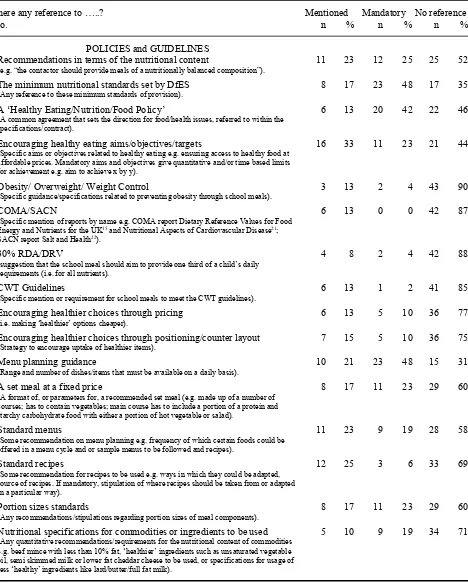
Table 4.1. Specifications relating to healthy eating within contractual documentation (n=48)....28
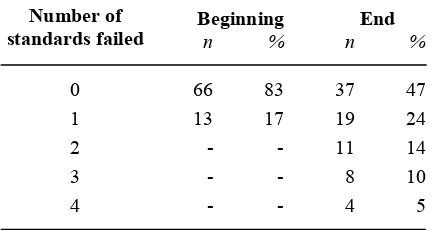
Table 5.1. The number (%) of caterers failing to meet one or more standards on one or more days at the beginning and end of service in 79 secondary schools in England...39
Table 5.2. The number (%) of caterers that failed to meet each standard or component of a standard every day at the beginning and end of service in 79 secondary schools in England. ...40
Table 5.3. Number and percentage of 52 school cooks or catering managers who were able to identify each nutritional standard or component of a standard. ...41
Table 5.4. Examples of responses from the school cook or catering manager in reply to “who monitors these standards in your school?”...41
Table 5.6. Number of days on which specific foods offered in 79 secondary schools in England according to whether the specification was mentioned in the contract/service level
agreement, was deemed mandatory, or was not mentioned...47 Table 5.7. Summary of influences of eating environment characteristics, catering practices and
training, and contract specifications on food provision in 79 secondary schools in England. ...47 Table 5.8 Examples of types of school set meals according to cluster membership. ...48 Table 5.9. The nutrient content (mean and SD) of the seven common groupings for set meals and the percent contribution of energy from macronutrients...50 Table 5.10. Percent of each of seven meal types failing to meet CWT guidelines in 814 set meals
offered in 79 secondary schools in England...51 Table 5.11. Number of days on which selected foods offered according to whether or not school
had met CWT guideline (n=70 schools). ...53 Table 6.1. Energy and nutrient content of 5 695 school meals consumed in 79 secondary schools
in England, percent energy from macronutrients, CWT guideline and percent of meals meeting the guideline, by gender. ...59 Table 6.2. Energy and nutrient content of 5 642* school meals consumed in 79 secondary
schools in England, and percent energy from macronutrients, by amount spent or receipt of free school meal. ...61 Table 6.3. Percent of pupils who met CWT guidelines for specific nutrients: all pupils and those
who met six or more guidelines, by gender. ...62 Table 6.4. Predictors of high CWT score in 5 695 pupils in 79 secondary schools in England,
based on stepwise multiple regression analysis. ...64 List of figures
Figure 1. The Balance of Good Health. ...43 Figure 2. Percent of 5 695 pupils choosing specified foods in 79 secondary schools in England.
...55 Figure 3. Percent of all food choices by 5 695 pupils in 79 secondary schools in England. ...56 Figure 4. Food consumption profiles of boys and girls attending 79 secondary schools in
England, by amount spent or receiving a free school meal...60 Figure 5. Food consumption profiles of boys and girls attending 79 secondary schools in
England, according to whether or not their food choice met 6 or more of the CWT
guidelines. ...63 Figure 6. Food consumption profiles of pupils attending 79 secondary schools in England,
according to whether or not their food choices met the six most discriminating CWT guidelines (folate, percent energy from fat, protein, vitamin C, retinol and percent of EAR for energy). ...64 Figure 7. Percent of pupils meeting CWT guideline for percent energy from fat according to
number of days per week chips (and other potatoes cooked in oil) offered in school, in 78 secondary schools in England. ...65
Executive summary
Introduction
Following concern about the quality of children’s diets and the contribution of school meals, statutory National Nutritional Standards were reintroduced in April 2001. These standards set out the frequency with which school caterers must provide items from the main food groups (starchy foods, milk and dairy, fruit and vegetables, meat, fish and alternative sources of protein). They apply to all maintained schools in England.
The Department for Education and Skills (DfES) and the Food Standards Agency (FSA) commissioned a survey to assess compliance with the standards and to measure food consumption in secondary school pupils. This report presents the findings from a nationally representative sample survey of 79 secondary schools in England which provided information about catering practice and food provision at lunchtime, and information on the food selections of 5 695 secondary school pupils age 11-18 years.
Key Findings
Catering service, cooking practices and the eating environment
• The school catering service was usually provided by a contractor appointed by the school (38%), Direct Service Organisation (37%) or was provided “in-house” (19%). The most usual type of contract was profit & loss or breakeven (49%) followed by fixed cost/fixed price. The majority of schools (76%) operated a cash cafeteria system; 18% operated a cashless smart card system, and 5% a cash/smart card system.
• Whilst many schools followed healthy cooking practices (e.g. frying in vegetable oil, using semi-skimmed milk), other healthy practices were followed by only a minority (e.g. 15% restricted access to table salt, 17% used low fat spreads in sandwiches). Rather than use oven chips (which are lower in fat), 99% of schools fried their chips.
• A quarter of head cooks/catering managers or their staff had received training in healthy eating or cooking in the past 12 months.
Analysis of specifications
• Forty-eight schools (61%) provided documentation setting out specifications relating to healthy eating or nutrition. None of the 15 schools that provided their own catering service (“in-house”) had any documentation.
• While the language within this documentation was worthy and indicated a strong commitment to the notion of healthy eating, it was largely intentional, non-specific, and failed to specify tight contractual structures to ensure that providers delivered meals with a healthier nutritional profile and to encourage children to make healthier choices.
• Approximately two thirds of the documents examined mentioned or made explicit mandatory requirements for providers to meet the National Nutritional Standards.
Compliance with the nutritional standards
• 83% of schools met all the nutritional standards for school meals every lunchtime at the beginning of service. This had fallen to 47% by the end of service.
• 82% met the additional recommendation for drinking water at the beginning of service, and 77% by the end. For drinking milk, 54% met the recommendation at the beginning of service, 42% by the end.
• At the beginning of service, those caterers who did not meet all of the standards were most likely not to provide two items from the milk and dairy foods group (4% of all schools). By the end of service, caterers were most likely not to provide two starchy items one of which was not cooked in oil or fat (25%). The tool for measuring compliance did not identify whether the missing starchy item was cooked in oil or not.
Food provision
• The food groups most commonly served on at least four days per week were cakes and muffins (95% of schools), sandwiches (92%), soft drinks (92%), and fruit (91%). Vegetables (excluding baked beans) were served on at least four days in 70% of schools, and baked beans 81%. Chips and other potatoes cooked in oil were served in 76% of schools on 4 or more days, high fat main dishes such as burgers and chicken nuggets in 86%. In 28% of schools, no fruit juice was served.
• There was no association between the school caterers’ success in meeting the nutritional standards and the profile of foods offered. The profile of foods offered did not conform to the Balance of Good Health.
• None of the “set meals”, which were provided by 89% of schools, met all 12 of the Caroline Walker Trust guidelines. Only 7% of schools provided set meals over the course of one week that met eight or more of the Caroline Walker Trust guidelines. The guidelines for which meals were most likely to fail were iron, calcium and percent energy from carbohydrate (starchy foods). They were most likely to meet the guidelines for protein, vitamin C and non-milk extrinsic sugars (primarily added sugar).
Pupil food choices and nutrient intakes
• 48% of pupils chose high fat main dishes (e.g. burgers), 48% chose chips and other potato products cooked in oil, 45% chose soft drinks and 24% chose cakes or muffins. The least popular choices were fruit (2%), fruit juice (3%), and vegetables and salads (6%).
• 41% of total energy was derived from fat, within which 14% of total energy was from saturated fatty acids. The Caroline Walker Trust Guideline is 35% or less for fat, and 11% or less for saturated fatty acids. 14% of total energy was derived from non-milk extrinsic sugars. The Caroline Walker Trust guidelines is to achieve 11% or less. Pupils whose meals met six or more CWT guidelines chose more baked beans, vegetables and salads, starches (both chips and low fat starches), desserts, fruit, fruit juice and milk, and fewer high fat main dishes, cakes and muffins, sandwiches, sweets and chocolates and crisps and savoury snacks and soft drinks
• 54% of pupils spent less than £1.50 on their lunch; 13% had a free school meal. Those pupils spending less than £1.50 compared with more than £1.50 were more likely to buy chips. Pupils who spent more on their lunch had higher energy and nutrient intakes than pupils receiving a free school meal, who in turn had higher intakes than those spending less than £1.50.
Methods
A representative sample of 79 maintained secondary schools were recruited into the study. Data was collected at the school and pupil level. Pairs of interviewers from the National Centre for Social Research visited each school over five consecutive lunchtimes. They recorded all the food and beverage items on offer each day, and assessed compliance with the National
Nutritional Standards at the beginning and 10 minutes before the end of service. Individual pupil choices were also recorded. At 5 minute intervals, one of the interviewers approached a pupil after he or she had paid for lunch. After ascertaining their willingness to participate, the interviewer recorded what was on the pupil’s tray, attached an identifying label to the tray, administered a brief questionnaire, and asked the pupil to return his or her tray with all leftovers to a ‘weighing table’ set up in the school dining room. Fifteen pupils were asked to participate each lunchtime. Food choices of 5,695 pupils were recorded.
At the beginning of service, one of the interviewers collected from the catering staff two portions of a range of foods, including the components of set meals if served. These items were weighed by the interviewers to establish typical portion sizes. Individual pupil leftovers were also
weighed.
Telephone interviews were conducted with the school head cook or catering manager and the person responsible for the school meal provision (Head/Bursar/LEA) by researchers at King’s College London.
Individual pupil food choices were coded using the Food Standard Agency’s Nutrient Databank. Statistical analysis was conducted using SPSS. Compliance with the nutritional standards was assessed in relation to food provision. The nutrient profiles of the set meals were compared with the Caroline Walker Trust (CWT) guidelines, as were the nutrient profiles of the pupils’ food choices. Food provision and pupil food choice was also assessed in terms of food groups. Copies of school meal contracts or service level agreements were requested and obtained for 48 of the 79 schools. A quantitative and qualitative analysis was conducted of the content specific to nutrition and healthy eating.
Discussion and conclusions
Catering service, cooking practices and the eating environment
The types of catering providers and contracts observed in the present study are characteristic of those found throughout England. Over one-fifth of schools operated a smart card system. In over three-quarters of the schools, pupils who receive free school meals can be identified by other pupils. Over one-third of schools allow access at lunchtime to vending machines and tuck shops in the dining room that sell sweets, chocolate and soft drinks.
were rare. Only one quarter of staff had had training relating to healthy catering in the 12 months prior to the survey.
Some schools operated a pricing policy to make healthy options cheaper, but this was in some cases undermined by “meal deals” or “burger promotions” that included unhealthy food
combinations (e.g. 10p off burger and chips). In only one third of schools was there evidence of promotion of healthy eating (e.g. posters, labelling of food or menus).
On balance, the findings of the present survey show that the majority of children are not making healthy food choices. Moreover, practices in the dining room intended to promote healthy eating had little positive influence on pupil choices.
Analysis of specifications
The specifications currently operating in schools were ineffective tools for assuring that healthier choices were available and promoted to children at lunchtime. Within the documents, the
language relating to healthy eating was generally non-specific, nor was it measurable or time-bound. Detailed examination of the content of the documentation suggested that many schools were paying ‘lip service’ to healthy eating and nutrition by failing to set tight standards and defining tools and processes for monitoring these standards.
These documents demonstrated an awareness, interest and commitment to nutrition and
encouragement of healthy eating by those responsible for catering services in schools. However, the integration and translation of nutrition-related standards into meaningful specifications were generally poor. As a consequence, few documents effectively stipulated healthy eating or nutrition related standards above those set out by the DfES. Moreover, there was no consistent association between nutritional references in the contracts and food provision.
Inventory analysis and pupils’ food choices
While schools offered a wide variety of foods, the overall balance of foods on offer was not healthy. It failed to conform to the Balance of Good Health. There were no constraints on what pupils could choose for school lunch that promoted healthier choices. Pupils in many schools were free to select the same types of food every day (e.g. burger and chips) and there was no control over the balance of meals or the variety of foods chosen over a week. Although most schools were providing healthy options on most days, the evidence from the present study shows that if the pupils’ choices are unconstrained the majority fail to make healthy choices.
None of the set meals met all of the CWT guidelines and only 7% of schools provided set meals that met 8 or more of the CWT guidelines over the week. This may tie into the lack of nutritional knowledge on the part of caterers and those who write the contracts. If it were argued that pupils should choose a set meal, current provision would not promote healthy eating. Even if set meals did meet the CWT guidelines, as long as pupils were free not to choose them it would do little to promote healthier eating.
The majority of set meals on offer did not meet the CWT guidelines even though the balance of food provided satisfied the National Nutritional Standards. Given the similarities between the present findings and those reported in 2000 in the NDNS3 of young people, there appears to have been no improvement in the profile of nutrient intake from school meals following the
introduction of the National Nutritional Standards in 2001.
It is clear that the current National Nutritional Standards, coupled with the present model of food service and the provision of set meals that do not have to meet clearly defined nutritional
requirements, failed to encourage children to select combinations of foods that contributed to a healthy diet. Whilst caterers were providing some meals with healthier profiles, pupils were favouring less healthy foods, of which there was enormous variety within school dining rooms.
Recommendations
The evidence from the present study suggests a number of ways in which the dietary choices of secondary pupils at lunchtime can be improved. The failure of the National Nutritional Standards and contract specifications to have a substantial positive influence on food choice justifies a call for alternative strategies.
The most likely way to ensure healthy eating in schools is to constrain choice to healthy options, manipulate recipes, use modern presentation techniques with which pupils can identify (e.g. the “fast food” approach, vending machines with healthier options), and provide encouragement through reward.
Recommendation Evidence
1. National Nutritional Standards for school food must be compulsory and based on a combination of food-based and nutrient-based guidelines.
The current food-based standards did not yield a profile of foods on offer that reflected the Balance of Good Health. Although food provision and the content of set meals met the National Nutritional Standards, the nutrient profile of set meals failed to meet the Caroline Walker Trust guidelines.
2. Lunch as chosen must be a combination of foods that meet the Balance of Good Health.
Government advises that food choices should conform to the Balance of Good Health. Pupils who chose meals that were closest to the Balance of Good Health were most likely to meet the Caroline Walker Trust guidelines. 3. The range of choice must be restricted to a
range of healthier options, based on menus balanced over one week.
In the majority of cases, unrestricted choice of foods at lunchtime was associated with
unhealthy food choices. Restricted choice over one week (e.g. number of days on which chips were served) was associated with healthier eating.
4. Documentation and monitoring a) All schools must have written
documentation with specifications relating to the nutritional quality of school lunches, and they must be specific, quantitative, measurable and time-bound.
b) The standards must be monitored. a) Resources to support the framing of
nutritionally-relevant specifications must be provided for those developing written documentation
The specifications within the contracts and service level agreements relating to the
Recommendation Evidence
5. Training and resources
a) All head cooks and catering managers must have certified training in healthy catering and how to meet the revised standards. b) Resources (training sessions, websites, software, recipes, portion size and food composition data) must be provided by the DfES to support training and to facilitate monitoring.
The majority of head cooks and catering managers could not name three or more of the current standards. Only one quarter of staff responsible for provision of school catering had training (unspecified) in “healthy eating or cooking”. Current Government resources focus on the DfES Guidance for School Caterers. There is no certified training scheme for school caterers.
6. The DfES should establish a Committee with the authority to develop a new set of compulsory nutritional standards for school meals in England. It is recommended that the new standards be formulated so as to apply to all food provision within schools (the “whole school” approach).
1 Introduction
1.1 Background
School meals make a vital contribution to the dietary intake of school children in England. Every day, over 3 million school meals are served.1 In secondary schools, about 14% of pupils are entitled to free school meals; about 11% actually took up their entitlement to free school meals2. The National Diet and Nutrition Survey of Young People aged 4 to 18 years3 reported that in 11-18 year-old children, school meals contribute between one-quarter and one-third of the daily intake of energy, fat, dietary fibre, iron, calcium, vitamin C and folate. The contribution was typically greater in children receiving free school meals. This analysis, published in 2000, was undertaken specifically to inform the preparation of new National Nutritional Standards for school lunches.
There is concern, however, about the quality of pupils’ choices. Amongst 11-18 year-old pupils, school meals contributed 53-55% of their chip consumption, 36-54% of their total pudding consumption (including milk and sponge puddings and crumbles, but not fruit or fruit salad), and 31-36% of their soft drink consumption. The main contributor to vitamin C intake was potato, not fruit or vegetables. A Consumers Association survey of children’s school meal intake in 20024 found that pizza, chicken nuggets and fish cakes were among the most popular main courses. Chips and fried potato products were the most frequently consumed starchy foods, and baked beans the most popular vegetable. School meals contributed on average less than one portion to their daily fruit and vegetable intake. The recommended intake for children and adults is at least five portions (about 400g) per day5.
It is important to recognise the value of school meals in the context of overall diet and eating patterns. Young people’s energy from fat is close to the recommended 35%, but the percentage contribution from saturated fat is over 14% of energy, compared with the recommendation of 11%. Intakes of vitamin A are lower than the recommended intake, as are intakes of iron (particularly in girls), calcium, magnesium, potassium and zinc3. Coupled with these high saturated fat and low micronutrient intakes is the rise in the level of obesity in children. Recent data on English adolescents suggest that 13%-19% of boys and 13%-22% of girls are
overweight, and at least 3% of boys and 5% of girls are obese. 67 The chairman of the Food Standards Agency, Sir John Krebs, has suggested that if nothing is done to halt this trend, “for the first time in a hundred years life expectancy will actually go down”.8 There are specific concerns about the ways in which school food in general and school meals in particular may be contributing to this epidemic.9
School lunch is especially important for those children who have nothing to eat in the morning before school. Eight percent of all 8 to 16 year-old children skip breakfast. Older children are least likely to eat breakfast: 16% of 15-16 year-old boys and 20% of 15-16 year-old girls reported having nothing to eat before school.10
Concern about the quality of children’s dietary intake and their school lunch choices led to the re-introduction of National Nutritional Standards for school lunches in 2001. In order to
1.2 Aims and objectives
1.2.1 Aims
The study had three main aims:
1. To assess whether the food provided by the school caterer met the statutory National
Nutritional Standards, set out in the regulations and associated guidance, for all the children throughout the service period.
2. To assess whether the food provided met the Caroline Walker Trust Expert Working Group’s Nutritional Guidelines for School Meals11.
3. To identify the food consumption and nutrient intakes of the secondary school children from school meals, and to compare nutrient intakes to the guidelines set out in the Expert Working Group’s report.
1.2.2 Objectives
The main objectives were:
1. To recruit into the study a country-wide selection of 80 secondary schools using appropriate sampling techniques and weightings
2. To determine lunchtime food provision in these schools
3. To measure consumption of lunchtime meals in approximately 4800 pupils
4. To make appropriate comparisons between food availability, food consumption and nutrient intake on the one hand, and guidelines for healthy eating in schools on the other
5. To identify factors related to catering provision and the school environment that were associated with the provision and consumption of healthy foods
6. To estimate the proportion of school lunches being consumed that met the guidelines for healthy school meals.
1.3 Project overview
Seventy-nine secondary schools in England participated in the mainstage of this project.
Fieldwork was conducted during the period October to November 2003. Two interviewers from the National Centre for Social Research (NatCen) visited the school over five consecutive lunchtimes and recorded the foods and beverages on offer from the caterers. The food and beverage choices of up to 15 pupils were recorded each lunchtime and their leftovers were weighed. A total of 5 695 pupils provided information on food eaten and completed a brief interviewer administered questionnaire. Information on catering practice and the lunch service was collected via a telephone interview with the head cook or catering manager. Information on the type of contract for each school was collected via a telephone interview with the relevant person (school Head teacher/Bursar, LEA, contract caterer). A copy of the specifications or service level agreement was obtained from 48 schools. A pilot study to test measuring instruments and logistics was conducted in ten schools prior to the mainstage study.
1.4 National Nutritional Standards: historical perspective
The 1980 Education Act brought about major changes in the school meals service. The Act removed the obligation for LEAs to provide school meals, except to those children entitled to free school meals. It also removed the obligation to sell meals at a fixed price and the obligation to meet any nutritional standards. The result was that LEAs were left to decide for themselves the price, type and quality of the meals they provided, if indeed they decided to continue providing meals. One purpose of this major change was to save money: net expenditure on the school meals service was over £400 million per year in 1980, and school meals were identified as an area where substantial savings could be made to public expenditure. It was not until 2001 that National Nutritional Standards for school meals were reintroduced, as a result of concerns about the quality of children’s diets. Major changes in school meal provision post 1980 are presented in Table 1.1.
Table 1.1. Major changes in school meals provision post 1980.
1980 The 1980 Education Act removed the obligation of Local Education Authorities (LEAs) to provide school meals (except for children entitled to free school meals), sell meals at a fixed price, or meet any nutritional standards.
1983 A dietary survey of British school children was commissioned to assess the impact of the school meals provision of the Education Act (1980) on the diets of children.
1986 The Social Security Act (1986) restricted eligibility for free school meals to children of parents receiving Income Support only, removing over 400,000 children from eligibility. Those families receiving Family Credit received a small cash allowance instead.
1988 Enactment of the Local Government Act (1988) introduced Compulsory Competitive Tendering (CCT), obliging all LEAs to put school meals services out to tender. The Education Reform Act (1988) introduced Local Management of Schools (LMS) and Grant Maintained schools (GM). The LEA retained the school meals budget for LMS schools. GM schools received a grant from central government, which included school meals provision.
1989 The findings from the survey commissioned in 1983 were published in The Diets of British
Schoolchildren13. Three quarters of the children surveyed had a fat intake greater than 35% of energy;
iron in girls was below the recommended intake as was calcium and riboflavin in older girls. School meals contributed 34% to 58% of the children’s daily chip consumption and 32% to 60% of buns and pastries.
1992 The School Meals Campaign was launched, calling for the re-introduction of nationally agreed
nutritional standards for school meals. The Expert Working Group on Nutritional Guidelines for school meals was established by the Caroline Walker Trust.
1997 Best Value replaced CCT. Local Authorities were expected to ensure that the quality and cost of services properly reflected what local people wanted and could afford – the expectation was that the efficiency and quality of services should improve.
1999 The School Standards and Framework Act allowed the Secretary of State to set new National Nutritional Standards.
2000 As part of a new funding framework, Fair Funding, the budget for school meals was delegated to schools. This delegation was compulsory for secondary schools and optional for primary and special schools.
2001 The National Nutritional Standards for school lunches were implemented in April 2001.
1.4.1 National Nutritional Standards for school lunches: compulsory standards and additional recommendations
The ‘Education (Nutritional Standards for School Lunches) (England) Regulations 2000’ (Statutory Instrument 2000 No. 1777) came into force in April 2001. They set out minimum
standards, in terms of food groups, that school caterers must meet. There were separate,
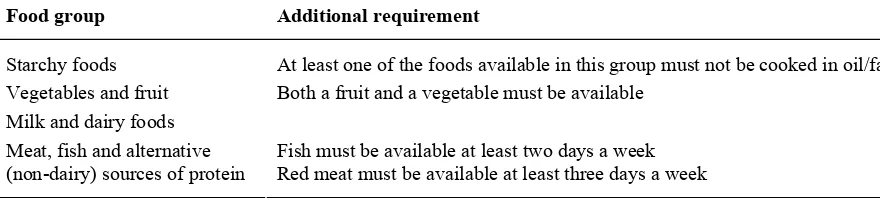
The Regulations for secondary schools stipulate that at least two items from the food groups in Table 1.2 must be available every day and throughout the lunch service. These are the
[image:16.595.68.508.171.270.2]“compulsory standards”. The Regulations do not make any reference to portion size.
Table 1.2. The national nutritional compulsory standards: At least two items from each food group must be available every day.
Food group Additional requirement
Starchy foods At least one of the foods available in this group must not be cooked in oil/fat Vegetables and fruit Both a fruit and a vegetable must be available
Milk and dairy foods
Fish must be available at least two days a week Meat, fish and alternative
(non-dairy) sources of protein Red meat must be available at least three days a week
The DfES produced guidance to school caterers on how to implement the new standards14.
Included in this guidance were “additional recommendations” regarding drinking water, drinking milk and provision of hot food (Table 1.3).
Table 1.3. Additional recommendations for school lunches.
The Secretary of State:
• Expects that drinking water should be available to all pupils every day, free of charge
• Strongly recommends that schools should offer some hot food, particularly in the Winter months • Strongly recommends that drinking milk is available as an option every day
Further recommendations include serving oily fish once per week and making milk free to pupils entitled to free school meals.
Ensuring that the National Nutritional Standards are met is the responsibility of the LEA, or school governing body if the school meals budget has been delegated.
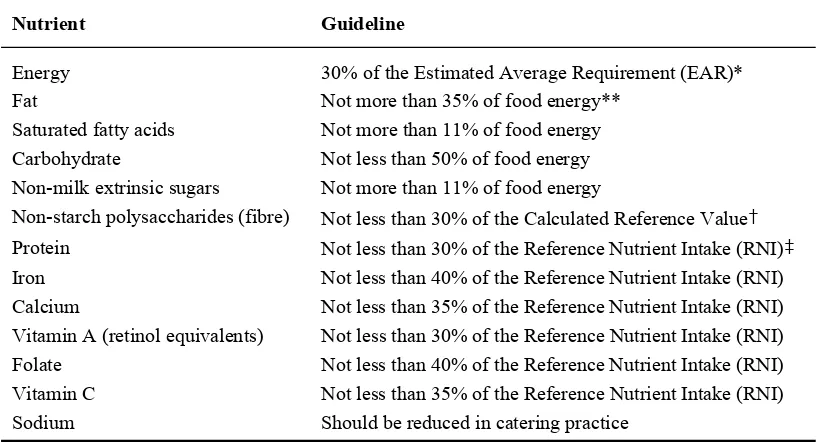
1.5 Caroline Walker Trust Guidelines for School Meals.
Table 1.4. Summary of Caroline Walker Trust nutritional guidelines for school meals.
Nutrient Guideline
Energy 30% of the Estimated Average Requirement (EAR)* Fat Not more than 35% of food energy**
Saturated fatty acids Not more than 11% of food energy Carbohydrate Not less than 50% of food energy Non-milk extrinsic sugars Not more than 11% of food energy
Non-starch polysaccharides (fibre) Not less than 30% of the Calculated Reference Value†
Protein Not less than 30% of the Reference Nutrient Intake (RNI)‡
Iron Not less than 40% of the Reference Nutrient Intake (RNI) Calcium Not less than 35% of the Reference Nutrient Intake (RNI) Vitamin A (retinol equivalents) Not less than 30% of the Reference Nutrient Intake (RNI) Folate Not less than 40% of the Reference Nutrient Intake (RNI) Vitamin C Not less than 35% of the Reference Nutrient Intake (RNI) Sodium Should be reduced in catering practice
* Estimated Average Requirement (EAR) = “estimated average requirement of a group of people. About half will usually need more than the EAR, and half less”.15 In the analysis of school meals in this report, “30%” has been interpreted as “providing between 20% and 40% of the EAR
for energy in a single meal”.
** Food energy = energy obtained from food, assuming no contribution from alcohol15.
† Calculated Reference Value = a value calculated by the Working Group for children based on a non-starch polysaccharides (NSP) intake of 8g/1000 kcal11.
‡ Reference Nutrient Intake (RNI) = “an amount of the nutrient that is enough, or more than enough, for about 97% of people in a group. If the average intake of a group is at RNI, then the risk of deficiency in the group is very small”15.
1.6 Types of school meals catering contracts
A number of legislative changes have had considerable effects on how the school lunch service is organised and provided within schools in England (see Table 1.1). The Education Act (1980) was particularly controversial as it removed the responsibility from LEAs to meet nutritional standards or to provide a “set meal” for pupils. The introduction of Compulsive Competitive Tendering (CCT) (1988) required LEAs to invite bids for the provision of school meals from private catering contractors as well as the authority’s own service, known as ‘Direct Service Organisations’ (DSO’s)16. This tendering precipitated a clear division in roles within school meals catering between:
• client services within LEAs, who defined the quality of catering services within schools through detailed specifications
• ‘providers’ (either private catering firms or DSO’s) who demonstrated how they would meet the service specification through a tender, which would be evaluated along with others before a contract was awarded.
Subsequently, local management of schools and the delegation of catering budgets to schools led to further diversity in the organisation of school meals services (Table 1.5).
In secondary schools in England, 60% of catering contracts are operated by DSOs, 24% by large private contractors, 5% are self-operated (“in-house”) and 11% are run by other small
contractors1.
This diversity of organisation of school meals has lead to a varied mix of documentation, contractual terminology and language, which have been adopted to define catering services for schools and set out standards against which the service needs to be delivered (Table 1.5).
Table 1.5. Organisation and types of documentation defining the school meals service.
Organisation of the school meals service
Schools provide the service themselves through catering staff directly employed by the school
LEAs still maintain a client services role overseeing a contract with catering providers operating within individual schools or a consortia of schools
Individual schools hold and manage a contract with a catering contractor
LEAs (DSOs) provide a catering service within individual schools or groups of schools.
Documentation defining the school meals service
Schools hold a service level agreement with LEAs
There is some type of contractual agreement containing specifications between school and contractor or LEA and contractor
Schools may have developed their own catering service specifications
There is also wide variability in the financial structure of school meals contracts/agreements. These are summarised in Table 1.6.
Table 1.6. Broad types of contractual agreements for provision of school meals services.
Name of Agreement/Contract Financial organisation
Fixed Cost/Fixed Price The school pays an agreed cost for a specified service. This cost or price for service provision may be varied e.g. if the number of pupils changes considerably
Management Fee/Cost Plus All the costs of providing the service are paid by the provider and recharged, with a management fee, or part management fee, to the school
Management Contract The school pays a contractor to manage the service for them, however there is less incentive for the contractor to make revenue for the school
Profit and Loss/Breakeven (sometimes referred
to as a ‘Nil Cost/Nil Subsidy contract’) The provider has control over the menu and pricing and the service is paid for by the pupils. There is no subsidy of the service by the school and the provider tends to have more autonomy over what is offered
Table 1.7. Types of subsidies operating between schools/LEAs and providers.
Cross subsidy between free school meals and paid meals
A subsidy of the service (e.g. school or LEA subsidise new equipment or management service to help run the service efficiently)
School or LEA specifically subsidise the management of the catering service
The contractor pays back an agreed portion of the profit from the catering service to the school or LEA If a contractor fails to meet predicted meal targets then the school or LEA may subsidise this deficit If catering staff have transferred over from LEA to contractor employment then the LEA or schools may subsidise any fall in rates of pay
2 Sampling, recruitment, data collection and coding
2.1 Sampling and Recruitment
2.1.1 Selecting the schools
Two samples were drawn from the DfES’s database EduBase, from which the pilot and mainstage schools were recruited.
The sample was drawn during July 2003. The sample frame included secondary and middle deemed secondary schools in England, which were to be open in the autumn term 2003. Community, Voluntary Aided, Voluntary Controlled and Foundation Schools were included in the sample. Schools that had been inspected by OFSTED during the previous nine months were excluded, as were small schools containing fewer than 150 pupils.
Prior to sampling, the frame was stratified or ordered in the following way using EduBase variables:
1. Region – the schools were split into the nine Government Office Regions (GOR). 2. School type – within each of the nine regions, the schools were grouped into the four
school types (Community, Voluntary Aided, Voluntary Controlled and Foundation) creating 36 bands. The schools were listed in the same order within each GOR.
3. Admissions policy – within each of these 36 bands, the four types of school admissions policy (Comprehensive, Selective, Secondary Modern and Not applicable) were listed in order, giving 144 bands.
4. Single sex schools vs. mixed – finally, within each of the 144 bands created, ‘boys only’, ‘girls only’ and ‘mixed’ schools were listed creating a total of 432 bands.
The resulting sampling frame contained 2 281 schools, from which the mainstage sample was drawn, with probability proportional to size.a The total number of pupils in each school was cumulated down the complete stratified list of schools. A sampling interval was calculated and administered after generating a random starting point. One hundred and thirty five schools were selected, with the intention of recruiting 80.
The pilot sample was drawn as a ‘quota’, ensuring a good spread of the relevant school
characteristics including school type, region, gender, admissions policy and whether the school was located in an urban or rural area. Forty schools were selected, with the intention of
recruiting ten.
2.1.2 Recruitment of schools
Mainstage and pilot sample schools were approached by letter towards the end of the summer term (July 2003). A second letter was sent at the beginning of the autumn term (September 2003) to those schools that had not replied. The letters were followed-up by telephone calls.
a Probability proportional to size’ means that schools were sampled in relation to their total number of pupils.
2.1.3 Response rate
Pilot sample
Ten schools were recruited for the pilot study, representative of the main school characteristics likely to be encountered in the mainstage.
Mainstage sample
Eighty schools were initially recruited for the mainstage study. Two schools withdrew prior to the onset of fieldwork. One of the schools that had initially declined was recruited into the study. Thus, 79 schools participated in the project, giving a response rate of 59% of the issued sample.
Responders and non-responders
[image:21.595.76.535.378.686.2]The responding and non-responding schools were compared in relation to Government Office Region, type of school, admissions policy and whether single sex or mixed (Table 2.1). The only significant difference was found within the number of ‘girls only’ and ‘boys only’ schools. Of the seven ‘boys only’ schools approached, only one participated; of the eight ‘girls only’ schools approached, seven participated. The ‘boys only’ school was a Voluntary Aided School. Five of the ‘girls only’ schools were Community Schools, one was a Foundation school and one was a Voluntary Aided School.
Table 2.1. Characteristics of participating and non-participating schools, the issued sample and all schools.
Participated
(n = 79) Refused (n = 56) Issued sample (n = 135) Total schools (n = 2281)
n % n % n % n %
East Midlands 7 9 5 9 12 9 203 9
East of England 13 17 4 7 17 13 313 14 Government
Office Region
London 10 13 6 11 16 12 249 11
North East 3 4 4 7 7 5 137 6
North West 10 13 9 16 19 14 317 14
South East 14 18 7 13 21 16 344 15
South West 10 13 4 7 14 10 236 10
West Midlands 5 6 10 18 15 11 256 11
Yorkshire and The Humber 7 9 7 13 14 10 226 10
Community 54 68 36 64 90 67 1516 67
Type of
Establishment Foundation 13 17 10 18 23 17 334 15
Voluntary aided 10 13 8 14 18 13 349 15
Voluntary controlled 2 3 2 4 4 3 82 4
Comprehensive* 74 94 50 89 124 92 1957 86
Admissions
Policy Selective 3 4 3 5 6 4 119 5
Not Applicable 2 3 3 5 5 4 205 9
Gender Boys 1 1 6 11 7 5 119 5
Girls 7 9 1 2 8 6 149 7
Mixed 71 90 49 87 120 89 2013 88
* Includes the “secondary modern” schools listed in EduBase.
a greater degree of deprivation. Table 2.2 compares participating and non-participating schools with the deprivation score for the ‘issued sample’. There were no significant differences for deprivation score between responders, non-responders and the issued sample.
Table 2.2. Multiple deprivation score (MDS) for participating, non-participating and the issued sample schools
Participated
(n = 79) Refused (n = 56) Issued sample (n = 135)
MDS n % n % n %
0 - <10 18 23 7 13 25 19 10 - <20 17 21 16 29 33 24 20 - <30 17 21 11 20 28 21 30 - <40 13 17 8 14 21 16 40 - <50 8 10 7 13 15 11
50 - <60 2 3 1 2 3 2
60 - <70 3 4 5 9 8 6
70 - <80 1 1 1 2 2 1
Table 2.3 compares responding and non-responding schools by education phase (middle deemed secondary vs. secondary), religious affiliation, and whether the area is classified as urban or rural. Within religion, the church schools category represents Church of England and Roman Catholic Schools. The None and Do Not Apply categories include schools who have no religious affiliation and those who cater for all religions. Although these indicators were not used to stratify the sample, they show that the schools that participated were representative of the issued sample.
Table 2.3. Response rates, by type of school and whether or not they agreed to take part in the study.
Participated
(n = 79) Refused (n = 56) Issued sample (n = 135)
n % n % n %
Middle deemed Secondary 2 3 3 5 5 4
Phase of Education Secondary 77 97 53 95 130 96
Church Schools 10 13 9 16 19 14 Religious affiliation None/Does Not Apply 69 87 47 84 116 86 Rural Local District 18 23 13 23 31 23 Urban/Rural Area Urban Local District 61 77 43 77 104 77
Table 2.4. Main reasons given for non-participation
Reason for refusal n %
Not given 22 39
Pressure of work and time constraints 11 20 OFSTED Inspection imminent 4 7 Limited/no cooking facilities 3 5 School undergoing administration changes 3 5 Involved in similar/other projects 3 5
Other 10 18
2.2 Development of data collection tools and piloting
2.2.1 Pilot study
The data collection tools and research protocol were piloted in ten schools over two consecutive lunchtimes during two weeks in September 2003. The pilot interviewers attended a de-briefing session where they provided feedback on the data collection tools.
2.2.2 Data collection tools
[image:23.595.65.545.444.719.2]Table 2.5 lists the data collection tools and their primary purpose. Copies of all data collection instruments are in Appendix A. There were two levels of data collection: school level and pupil level.
Table 2.5. Data collection tools, primary purpose and level of collection of data
Data Collection Tool Primary Purpose
School level
Food Inventory Record all foods and beverages on offer each day in the school cafeteria, including the set or main meal.
Food Visibility Tool Assess compliance with the Nutritional standards for School Lunches at the beginning and end of service.
Eating Environment
Assessment Assess the dining room in terms of display of menus, price lists and material promoting healthy eating. Portion Weights Sheet Record weight of 2 portions of a range of foods.
School Caterer
Telephone Interview Obtain information from school caterer about the lunch service, cooking practices, and health promotion activities. Bursar/Head/LEA
Telephone Interview Obtain information on nature of contract, extent of monitoring, and to obtain a copy of the specifications/service level agreement for the school lunch service. Specifications ‘Qual’
& ‘Quant’ Tools Extract information from school lunch specification/service level agreement.
Pupil level
Tray Check Sheet Record pupil food and beverage choices, and weight of leftovers.
2.2.3 School level data collection instruments
Food inventory
The purpose of the Food Inventory was to record all foods and beverages offered each day by the school caterers at lunchtime. A checklist of foods and beverages was compiled from
representative menus obtained from a number of private contract and DSO caterers. The dishes and items that were offered by the greatest number of school caterers were included in the inventory. Foods were grouped into categories (e.g. main meals, vegetables, fruit, sandwichesb) with a tick box for each of the five days of data collection beside each item. Each section (main meals, vegetables etc.) also had blank spaces with tick boxes for the NatCen interviewer to record items that did not feature in the pre-printed lists. As one of the aims of this research was to compare food provision with the Caroline Walker Trust Guidelines, it was important to record the ‘set meal’ (if offered). Five boxes, one for each day, were included for the interviewer to record the ‘set meal’. An additional column was included for packaged foods to record the item weight where it might vary by school (e.g. packaged cakes and biscuits, pre-packed sandwiches). For packaged items where the weight was unlikely to differ (e.g. chocolate confectionery,
canned soft drinks) the item weight was pre-printed on the inventory.
Food Visibility Tool
The Nutritional Standards for School Lunches stipulate that certain items from the major food groups must be available at the beginning and throughout the lunch service (see Table 1.2). The purpose of the Food Inventory was to record all food and beverages that were visible at the beginning of service. Items that were available but not visible, for example items kept hot in an oven or cool in a fridge, might not have been recorded in the Food Inventory. In order to avoid falsely recording school caterers as not meeting the nutritional standards it was necessary to devise a tool that specifically assessed compliance. For each of the standards the tool asked the interviewer if he/she could see an item that would meet the standard. If not, the tool instructed the interviewer to ask a member of the catering staff if such an item was available, what the item was, and why it was not visible. This tool also assessed the availability of drinking water and drinking milk, provision of which, whilst not compulsory, is strongly recommended in the advice given to caterers on how to meet the standards14.
Eating Environment Assessment
The Eating Environment Assessment tool was designed to record features of the school dining room such as whether menus and price lists were displayed, the set-up of the food service (for example, how many food service points and whether there were competing outlets such as vending machines) and any evidence of the promotion of ‘healthy eating’.
Portion Weights Sheet
In addition to recording the foods and beverages available to the pupils and pupil food choice, it was also necessary to obtain information on typical portion weights in each school. Portion weight sheets were devised, one for each day, on which the weight of two portions of 12 items could be recorded. Caterers were reimbursed for this food and a column was included to record cost.
School Caterer Telephone Interview
A semi-structured questionnaire was developed which was administered to school head cooks or catering managers via a telephone interview. The purpose of the interview was to obtain
information on the school food service, including when food was offered (i.e. breakfast, morning break and lunchtime); the number of lunches served, including the percentage of free school
b Throughout the report, the term “sandwiches” is used to mean sandwiches, filled rolls, baguettes, panini, filled
meals; competing outlets, both within and outside the school; the nature of the contract; and cooking practices, in particular in relation to fat and salt. The information gathered on cooking practices was both to allow an assessment of the extent to which school caterers were adopting ‘healthy’ cooking practices and to facilitate food coding.
Bursar/Head/LEA Telephone Interview
A questionnaire was also developed to be administered to the person responsible for the catering in the school, for example Head teacher or Bursar, LEA or Caterer. This questionnaire was also delivered as a telephone interview. The main objectives were to establish the nature of the catering contract and the nature of the monitoring of compliance with the nutritional standards. It was also designed to elicit a copy of the school meal specifications or service level agreement, if such a document existed.
Specifications ‘Qual’ & ‘Quant’ Tools
In order to examine whether and how the school meal specification or service level agreement was addressing nutrition and healthy eating, two data collection instruments were devised utilising both a quantitative and a qualitative approach (‘Qual Tool’ and ‘Quant Tool’). This approach was taken because it was believed that the level and content of specifications relating to nutrition and healthy eating would be extremely diverse. The purpose of the tools was to capture and interpret this variation in an analytical and descriptive way.
One key strand within the quantitative analysis was to determine to what degree any statements relevant to nutrition within the documentation were mandatory. The two tools were designed to be used in parallel. The ‘Quant Tool’ was designed to record whether a range of issues relating to nutrition and healthy eating were mentioned in the document, and whether compliance was
mandatory. The ‘Qual Tool’ contained the same headings as the ‘Quant Tool’. Its purpose was to extract and record the relevant text from the documents. The design and development of these tools was based loosely on the approach of Coles and Turner17.
2.2.4 Pupil level data collection tools
Tray Check Sheet
The purpose of the Tray Check Sheet was to record individual pupil lunchtime choices. The format echoed that of the Food Inventory, and was organised with the same section headings. Items identified as likely to be offered (see Food Inventory, section 2.2.3) were pre-printed onto the sheet, with a corresponding tick box. A number of blank spaces with tick box were included under each section heading for the interviewer to record items that were on the pupils’ trays but not in the pre-printed lists. Against each food or beverage there was also a box for recording any leftovers after the pupil had finished his or her lunch.
Pupil Questionnaire
The individual pupil questionnaire was placed on the reverse of the Tray Check Sheet. It was designed to record demographic data, expenditure on lunch and whether the pupil received a free school meal, and whether the pupil participated in any activity that impacted on time available for eating lunch. Pupils were asked their age rather than their date of birth as it was found in the pilot study that many of the younger pupils did not report accurately their own birth date.
2.3 Data collection
2.3.1 Mainstage briefings
working in more than one school over the fieldwork period. Exercises were used during the briefings to help illustrate the tasks they were asked to perform, including using the interviewer tools and the weighing of the food portions and leftovers. The fieldworkers received training on categorising foods by food group, including composite foods, so that they could complete the Food Visibility assessment. All interviewers received a set of detailed project instructions.
2.3.2 Pre-Fieldwork visit
One of the NatCen interviewer pair for each school made a pre-fieldwork visit to arrange the fieldwork dates, make contact with the Head cook/Catering manager, and observe at least part of a lunch service. He or she also delivered sufficient ‘parent/pupil’ letters for every child to take home, sufficient ‘teacher’ letters for every form teacher, and a poster to be displayed in the school dining room to advertise the dates of the fieldwork.
2.3.3 Fieldwork
The NatCen interviewers worked in pairs. Each interviewer was assigned one of two roles:
Weigher or Selector. The schools were visited on five consecutive days.
Both interviewers arrived at the school 30-60 minutes before the beginning of food service. The
Weigher recorded all food and beverages visible in the Food Inventory Booklet. The Selector
completed the Food Visibility Tool. They also set-up a ‘weighing table’, which was covered with a brightly coloured cloth to increase visibility. The length of the lunch service (entire lunch break) varied greatly between schools, from as little as 25 minutes to 120 minutes. The
Selector’s role was to select a pupil at 5 minute intervals, after the child had chosen and paid for his or her meal. If the pupil refused, or was unable to participate (e.g. language difficulties), the
Selector was instructed to record the interview as ‘non-productive’ and to wait 5 minutes before selecting the next pupil. The Selector either interviewed the pupil at the till, or accompanied them to a table. This was left to the interviewer’s discretion, depending on how crowded the dining room was and the child’s preference. The Selector attached a label with an individual pupil number to the Tray Check Sheet and then recorded what was on the child’s tray. The
Selector then administered the pupil questionnaire, asked the pupil to take his/her tray with all leftovers to the weighing table when they had finished their lunch, and affixed another label with pupil number to the tray. The Selector was instructed to approach 15 pupils each day, with an expected response rate of 80%.
There was a diversity of catering arrangements in schools ranging from a single service point with one dining area, to a number of service points, some of which offered a limited range of foods, for example sandwiches or burgers. Where there was more than one service point, the interviewers were instructed to select pupils from all points or locations.
At the beginning of service the Weigher obtained two portions of 12 items from the catering staff. He or she was instructed to obtain the ‘set meal’ first (to compare with the CWT guidelines), and then to select other particularly popular foods up to a total of 12. These were weighed to the nearest 2g on kitchen scales (Soehnle) and recorded on the Portion Weight Sheets.
For those schools with a shorter lunch break, once the food portions had been obtained, the
Weigher assisted the Selector in selecting and interviewing pupils. The length of time each
Weigher would need to assist the Selector was detailed in the project instructions, depending on the length of the lunch break.
At the end of the lunch service, the Tray Check Sheets were matched with the trays containing leftovers. All leftovers were weighed to the nearest 2g and recorded on the Tray Check Sheets. This procedure was repeated each day. If a child was selected who had previously participated, the Selector chose the next child leaving the till.
The Eating Environment Assessment was completed on one day by the Weigher.
The interview with the Head cook or Catering manager was conducted by a nutritionist from KCL prior to the fieldwork week. The interview with the person responsible for the catering service within the school (Head/Bursar/LEA) was conducted post-fieldwork, as was securing of the school meals contract or service level agreement.
2.3.4 Pupil response rate
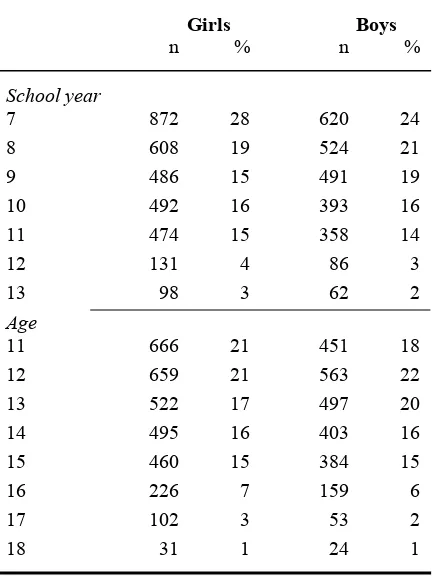
[image:27.595.68.284.375.663.2]A total of 5 780 pupils were approached. Of these 47 (0.8%) refused or were unable to participate. It was decided to exclude from the analysis those pupils for whom age, sex and school year were not known (38). Analysis was thus conducted on 5 695 pupils (3 161 girls, 2 534 boys). Table 2.6 shows the breakdown of the sample by school year, age and gender.
Table 2.6. Distribution by school year, age and gender of 5 695 pupils participating in the present study.
Girls Boys
n % n %
School year
7 872 28 620 24
8 608 19 524 21
9 486 15 491 19
10 492 16 393 16
11 474 15 358 14
12 131 4 86 3
13 98 3 62 2
Age
11 666 21 451 18
12 659 21 563 22
13 522 17 497 20
14 495 16 403 16
15 460 15 384 15
16 226 7 159 6
17 102 3 53 2
18 31 1 24 1
2.3.5 School level response rate
2.4 Data Preparation
2.4.1 Food coding
The Food Standards Agency (FSA) nutrient databank was used as the source of nutrient data. Completed Food Inventories were coded at KCL, then passed to NatCen to act as coding guides for the individual pupil Tray Check Sheets. Where appropriate, existing databank codes were used. However, there were many occasions where a suitable code did not exist, for example sandwiches, filled rolls and baguettes, or where it was not clear from the dish name what the dish contained (e.g. Beany Nest, Chicken Roma, Burger Crowns). Items for which there was not an appropriate existing code were assigned a temporary code. Information on types of cooking oil or fat used, cooking method, type of milk used, and addition of salt to cooking water obtained from the Caterer Interview was used to assign codes appropriate to each school. Information on the ingredients in dishes and recipes were obtained from school caterers and for sandwiches, etc., the relevant proportions of fillings were obtained from the FSA-commissioned survey19. The data were entered onto the nutrient databank to create new permanent codes. Information on the usual type of spreading fat used by each school to make sandwiches allowed the creation and addition to the databank of new codes appropriate to each school.
The Tray Check Sheet data were entered using Blaise20, employing a look up file containing
food codes from the FSA nutrient data bank. Queries were referred to KCL nutritionists for clarification where necessary.
2.4.2 Data preparation
Allocation of food groups
Food groups for inventory and tray check analysis were based on a combination of nutrient databank food group allocations (e.g. “white bread”, “egg dishes”, “sausages”, “peas”) and inventory food group descriptions (“main meals”, “salads”, “jacket fillings”, “bread (unfilled)”, “dessert”). Using the two sets of groupings together facilitated distinction between, for example, bread offered on its own and a burger bun accompanying a beefburger offered as a main meal. This helped to avoid double counting when describing the options offered and the types of meals consumed. The crosstabulation of the two sets of groups yielded 116 easily identified groups of food and drink. These were aggregated into 17 groups, which highlighted the key groups (e.g. chips and potatoes cooked in oil, baked beans, low fat or high fat main dishes (see section 6.1) likely to make up the bulk of children’s choices at lunchtime, and facilitated a presentation of food group profiles that linked to the nutritional standards and the CWT guidelines.
Portion size allocation
Interviewers routinely recorded the portion sizes of soft drinks and other pre-packed foods. In addition, they weighed duplicate portions of up to 12 different items each day in each school, selecting the components of set meals first and then completing the list with a variety of other foods on offer that day. This generated a total of 3908 food weights based on the foods offered in all 79 schools.
Weights were not recorded for every individual item offered in every school. Therefore, it was necessary to compute some weights in order to be able to estimate the nutrient content of foods in the set meals and of foods eaten. The following procedures were applied to establish a weight for every item:
1. Use the weight of food offered in each school on each day as recorded by the interviewer; 2. Use the average weight of the food, based on information in all of the schools where a weight
had been recorded;
4. Use the weight of food corresponding to the average serving within 116 food groups, measured using all of the weights recorded in all the schools.
This generated a weight for every item offered or consumed.
When estimating the nutrient content of foods as eaten, the weight of food leftover was subtracted from the allocated portion weight. This was the basis for estimating the nutrient content of the food actually consumed. There were 115 instances (in over 17 000 measurements) in which the amount of food left over (recorded by the interviewer) exceeded the weight of the food portion allocated. In these instances, the child was assumed to have left the bulk of the food chosen, and the weight of food eaten was assumed to be zero. This is likely to have had no appreciable effect on the measured outcomes or conclusions from the study.
Determining the number of days on which items in the inventories were available
Because some schools provided inventory data for only four days (e.g. because of staff training (INSET) days), it was necessary to adjust the data in these schools so that estimates of
availability could be averaged across all schools and presented in the results per 5-day week. This was achieved simply by dividing by 0.8 the estimates of availability over four days. Overall, the data on consumption are likely to be unbiased. Variations in portion size are reflected in the measurements made within and between schools, INSET days occurred on different days of the week, and pupils’ choices are fully reflected in the tray check data collected.
2.5 Statistical analysis